FIGURE 1. Location of Niedźwiedzia Cave (1 and 2) and position of profiles in the middle horizon of Nied?wiedzia Cave (3). Two fossil cave bear specimens used for DNA extraction were excavated from profiles located in Lion's Hall and Primitive Man's Corridor, respectively.
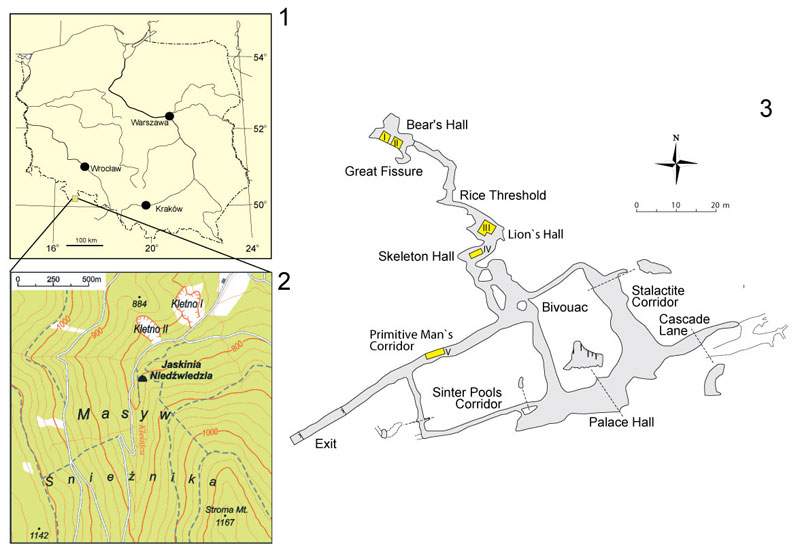
FIGURE 2. UPGMA cluster dendrogram for all molar teeth (1) and lower carnassial m1 (2) from cave bear specimens with confirmed or the most probable taxonomic affiliation. Numbers at nodes correspond to p-values expressed as percentages calculated using approximately unbiased test (AU) and bootstrap resampling (BP), respectively. For full names of localities see Material and Methods.
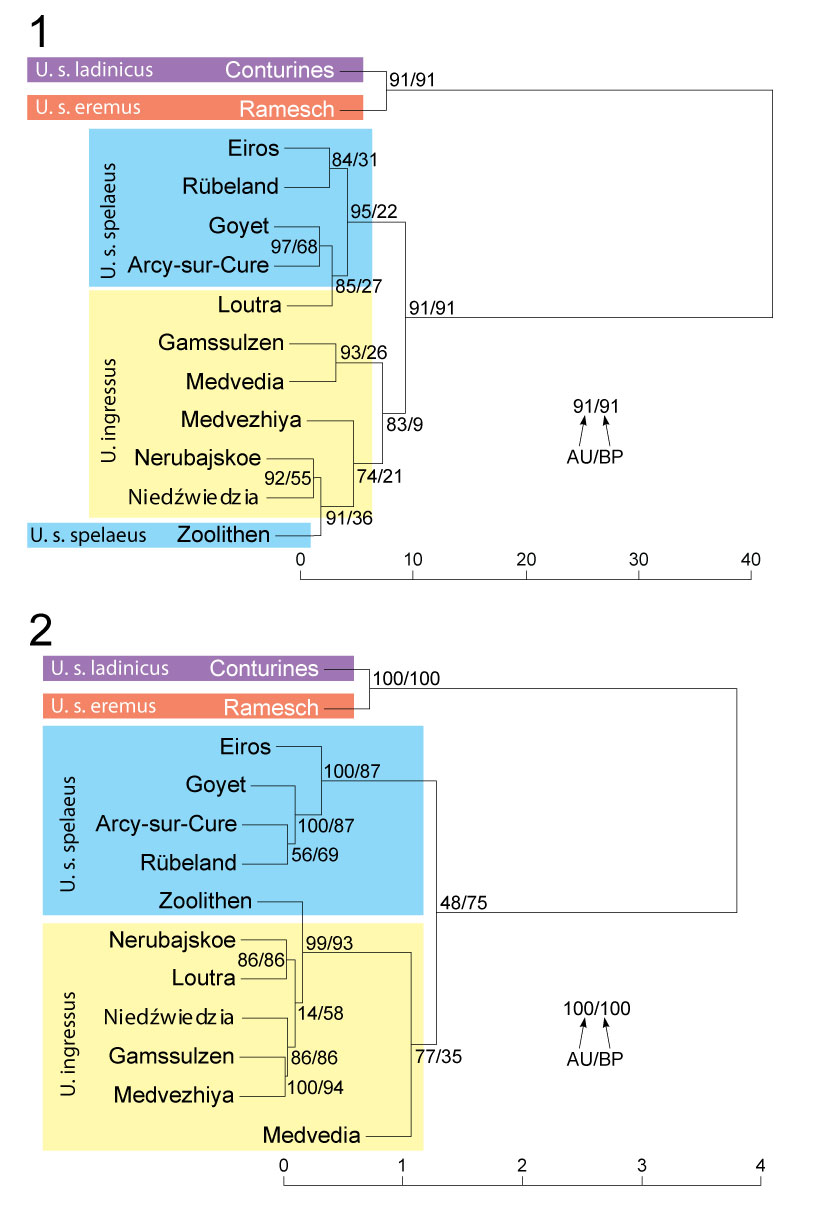
FIGURE 3. Comparison of skull measurements from Niedźwiedzia Cave (Nie) specimens with medians calculated by Baryshnikov and Puzachenko (2011) for Ursus ingressus (Ing), U. s. spelaeus (Spe), and U. s. eremus (Ere): (1) total length, (2) basal length, (3) neurocranium length, (4) viscerocranium length, (5) palatal length, and (6) tooth-row length. Triangles denote males, circles females, and squares juveniles.
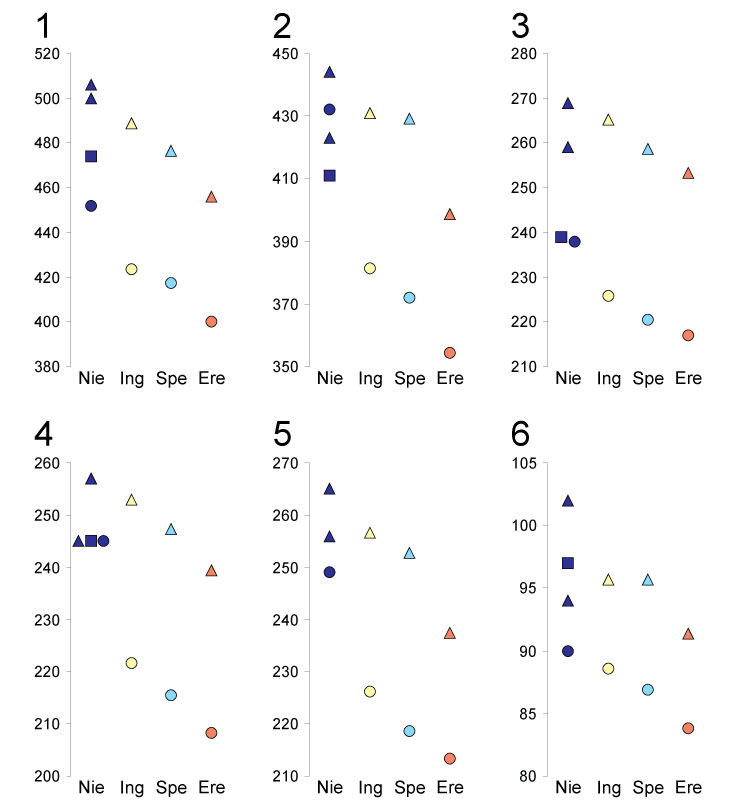
FIGURE 4. Bayesian tree for the mitochondrial D-loop region from cave bears obtained in PhyloBayes under the CAT-Poisson model. The two sequences obtained in this study are shown in bold. Numbers at nodes, in the order shown, correspond to posterior probabilities estimated in Phylobayes under CAT-Poisson model (CAT-Poi), Poisson model (Poi), and GTR model (GTR), as well as in MrBayes (MB). Values placed below them correspond to support values calculated in PhyML and PAUP. PhyML's support values were obtained by the approximate likelihood ratio test (aLRT) and bootstrap analysis (boot). Bootstrap values in PAUP were ordered by method used: maximum likelihood (ML), weighted least squares (WLS), minimum evolution (ME), neighbor joining (NJ), and maximum parsimony (MP). Values of probabilities and bootstrap percentages lower than 0.40 and 40%, respectively, were omitted or indicated by a dash "-". Asterisks at nodes denote corrected significance of branches at 0.05 (*), 0.01 (**) and 0.001 (***) level, estimated by WLS-LRT and F-test in WeightLESS. Thick branches were present in at least nine of the ten tree topologies inferred by the ten applied methods.
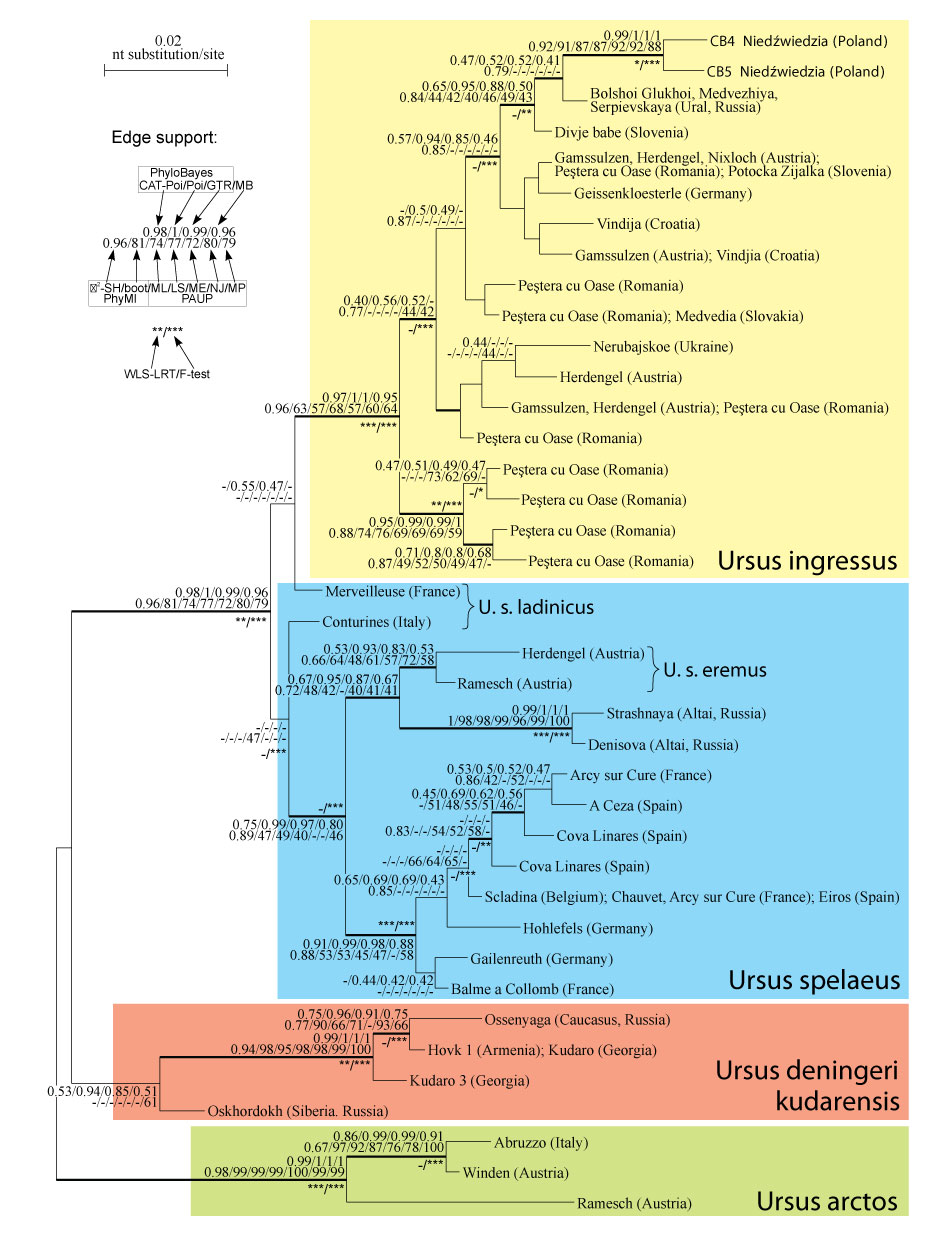
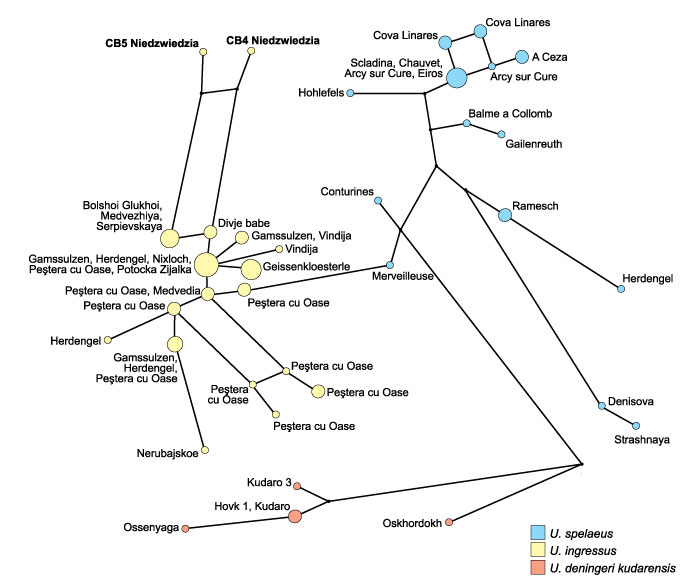
FIGURE 5. Median-joining network of 70 cave bear sequences. Haplotypes are colored according to their species affiliation. Inferred missing haplotypes are presented as black dots. The area of the circle is proportional to the haplotype frequency whereas the length of connecting lines corresponds to the number of substitutions between the haplotypes.