FIGURE 1. Idealized drawings showing the morphological variability of the ichnogenus Schaubcylidrichnus. Short single tubes of Schaubcylindrichnus could be mistaken for the morphologically similar trace fossil Palaeophycus heberti. P. heberti, however, does not display the typically U-shape of single Schaubcylindrichnus tubes.
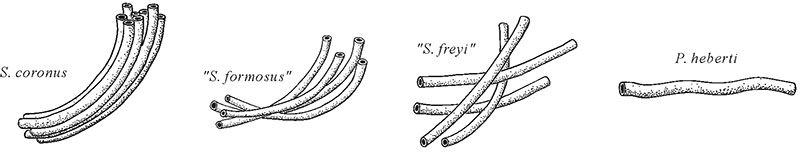
FIGURE 2. 2.1. Conceptual reconstruction of the trace fossil Schaubcylindrichnus coronus showing feeding funnel, diverging tubes and fecal mound of a probable enteropneust. After Nara (2006). 2.2. Photograph showing Schaubcylindrichnus coronus with attached feeding funnel in Miocene strata from the Wakayama Prefecture in Japan.
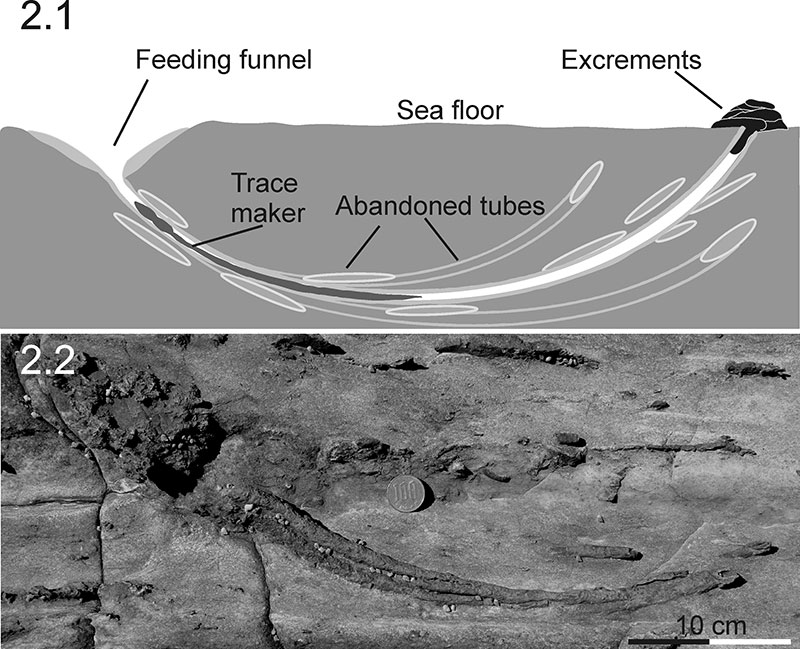
FIGURE 3. Maps showing regional locations of the observed sections of Tsubaki Onsen, Wakayama Prefecture, central Japan (3.1), and the observed sections at Yehliu Penisula and Hoping Island, northeastern Taiwan (3.2).
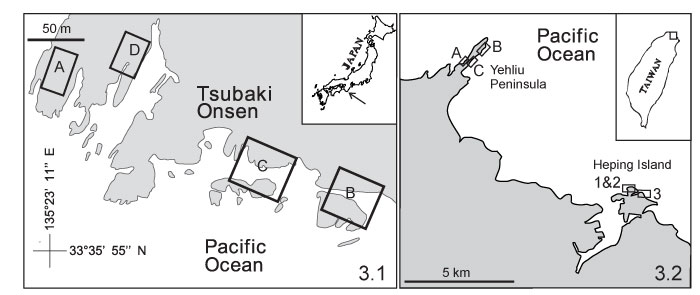
FIGURE 4. Columnar sections of the Tsubaki Onsen Sections in central Japan.
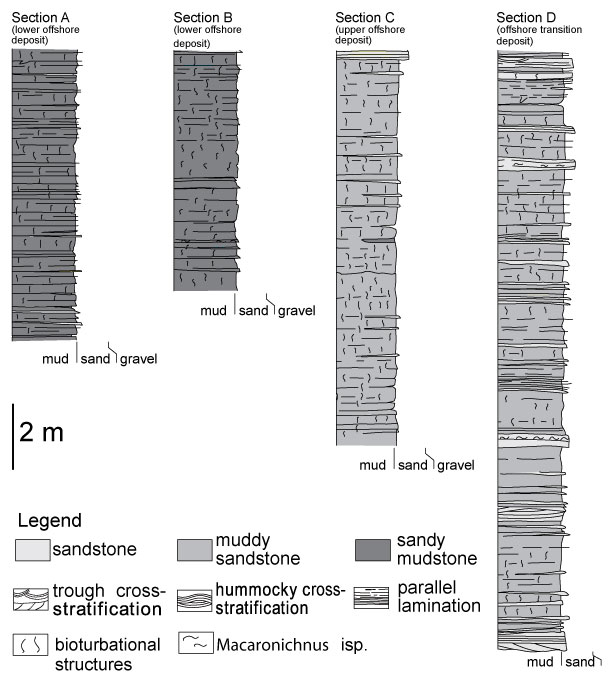
FIGURE 5. Photographs showing co-occurring trace fossils found at the studied sections in Japan: 5.1. Scolicia isp., 5.2. Macaronichnus isp., 5.3. Thalassinoides isp., 5.4. Rosselia socialis, 5.5. Teichichnus isp., 5.6. Unnamed oblique burrows found at Section A.
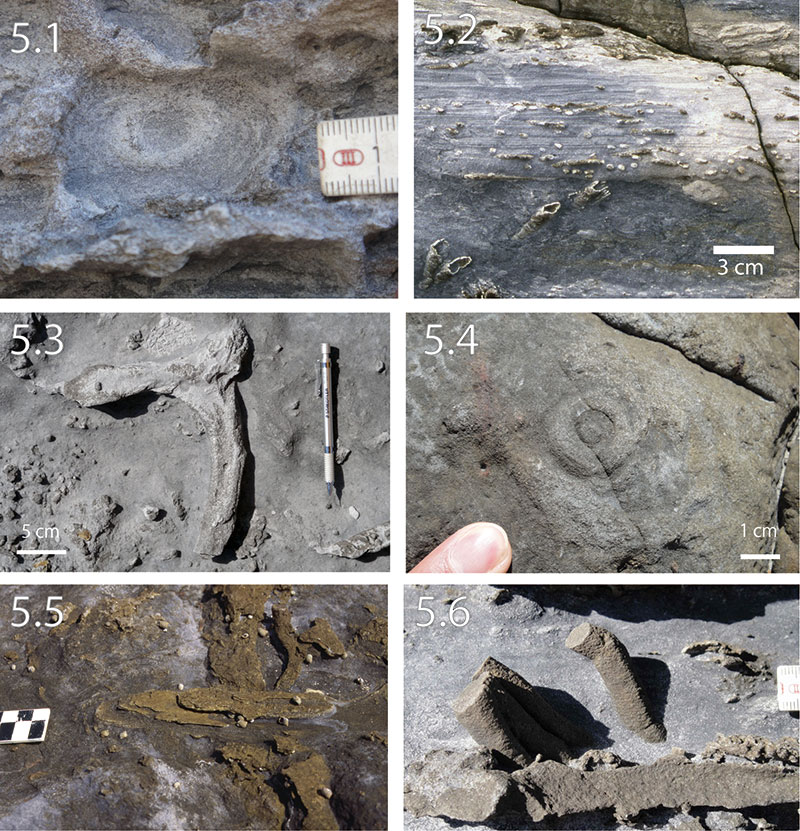
FIGURE 6. Photographs showing co-occurring trace fossils found at the studied sections in Taiwan. 6.1. Bichordites isp., 6.2. Macaronichnus segregatis, 6.3. Ophiomorpha nodosa, 6.4. Phycosiphon incertum, 6.5. ?Häntzschelina isp., 6.6. Piscichnus waitemata.
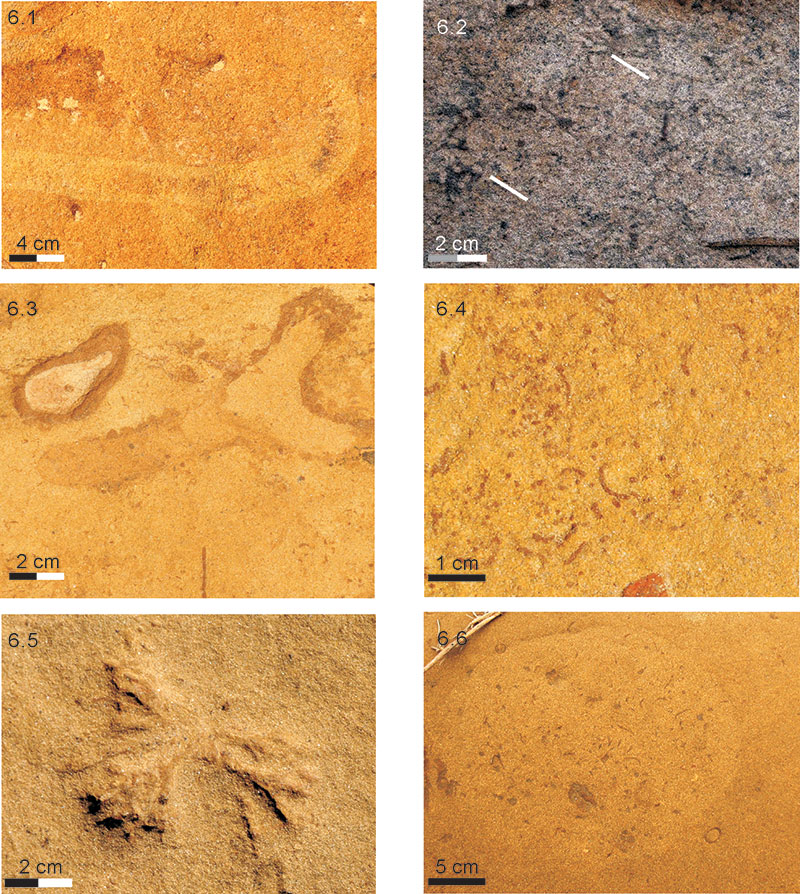
FIGURE 7. Columnar sections of the Taliao Formation in Yehliu and Hoping Island, northeastern Taiwan.
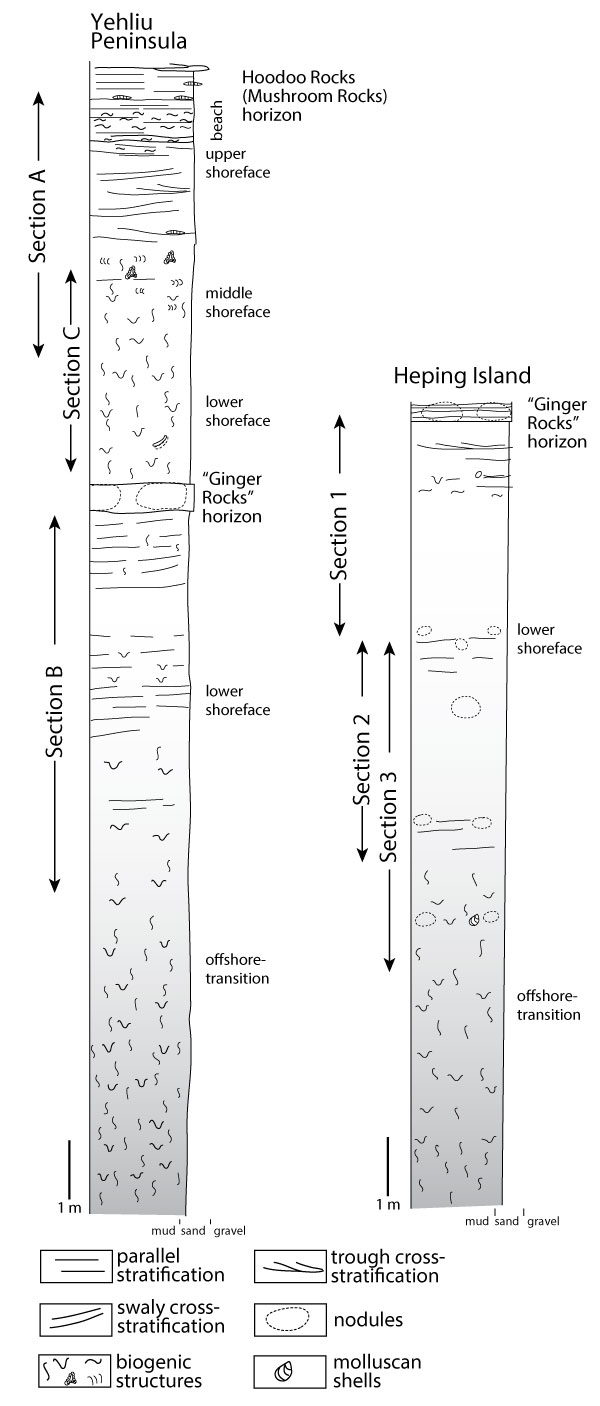
FIGURE 8. Tube fragments nested around younger tubes from Tsubaki Onsen, Japan.
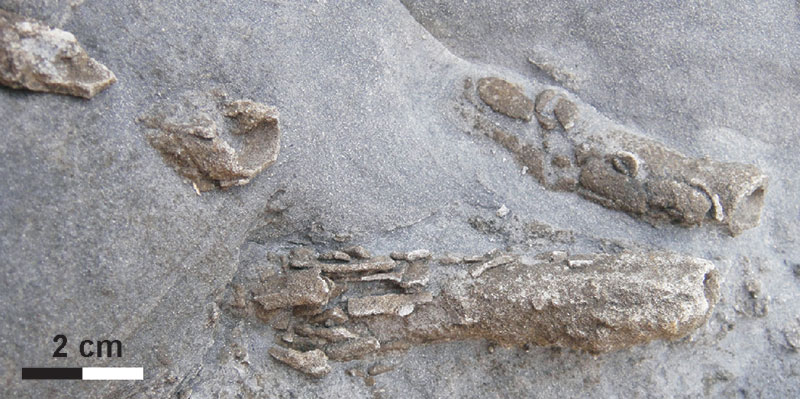
FIGURE 9. Histograms showing the variations in tube number in the different localities.
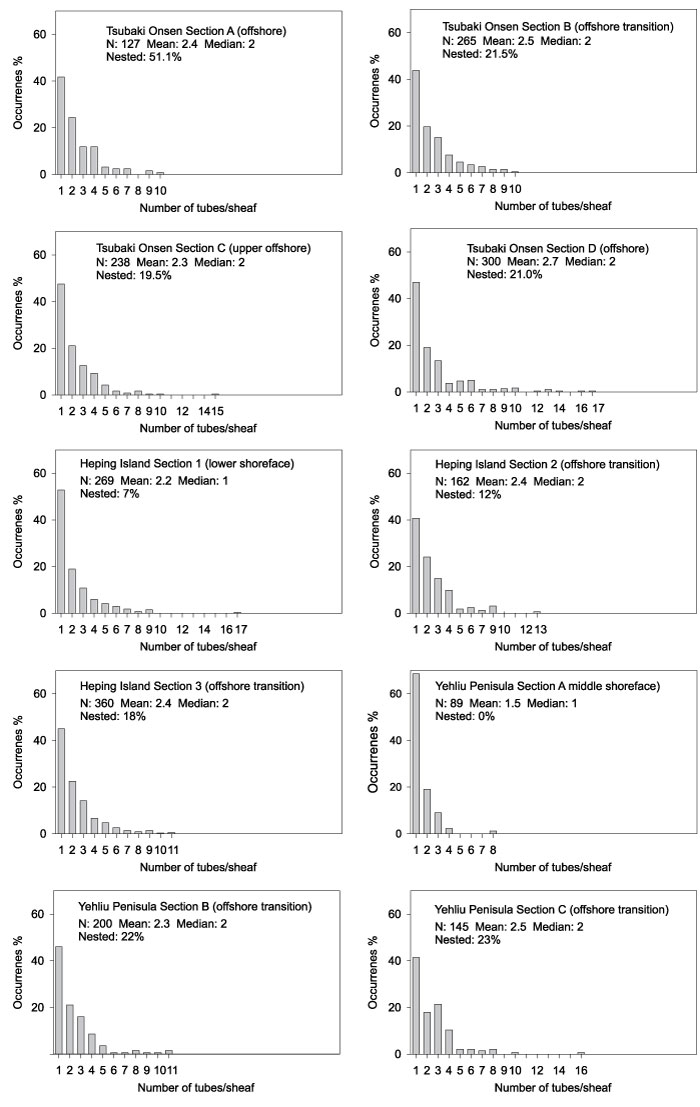
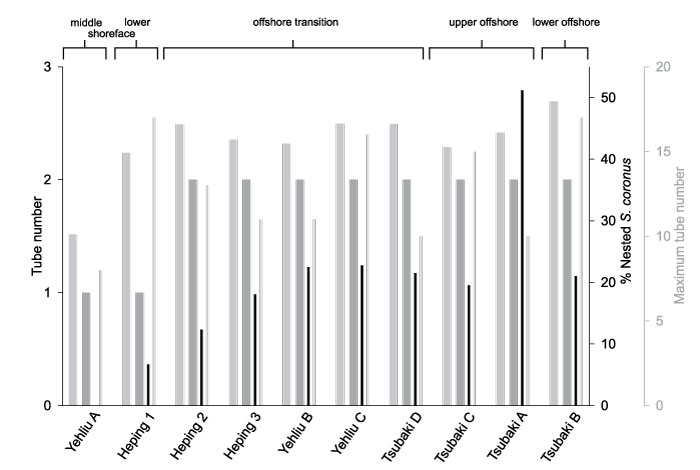
FIGURE 10. Diagram of average tube number (wide light grey), median tube number (wide dark grey), percentage of tube systems containing nested tubes (thin black), and maximum tube number observed (thin light grey) for all study areas. Areas ordered from high-energy (shoreface) towards low-energy environments (lower off shore). While offshore transition and offshore facies display similar values, a clear trend towards fewer tubes per system, lower maximum tube number, and less nested tubes is visible in the shoreface facies, with the lowest values in the most nearshore environment. Maximum number of tubes shows a tendency towards high numbers in the deeper settings but data are inconclusive.