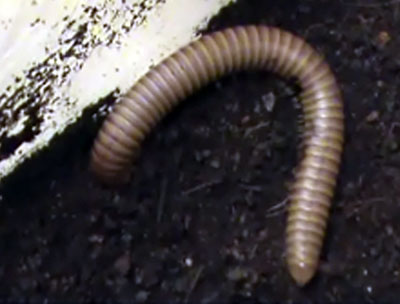
APPENDIX 1. Video of Narceus americanus using a compaction burrowing technique in 50O/50S sediment.
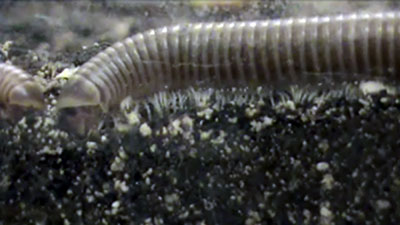
APPENDIX 2. Video of Narceus americanus using an excavation burrowing technique in 50Sa/50S sediment.
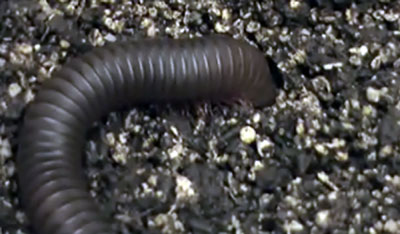
APPENDIX 3. Video of Floridobolus penneri using a compaction burrowing technique in 50Sa/50S sediment.
APPENDIX 4. Video of Floridobolus penneri in the subsurface using an excavation burrowing technique to widen a burrow in 100O sediment.
Appendixes 5-13 are presented in PDF format.
APPENDIX 5. Bray Curtis similarity matrix comparing all burrow casts produced in this study. From top-down and left-right; 29 Narceus americanus burrows (NA), 42 Floridobolus penneri burrows (FP), 13 Orthoporus ornatus burrows (OO prefix), and 8 Archispirostreptus gigas burrows (AG). Color bars along the sides and top indicate primary burrow architectures: Black = subvertical burrow, gray = vertical burrow, tan = J-shaped burrow, brown = helical burrow, magenta = O-shaped burrow, dark green = sinuous burrow, yellow = U-shaped burrow. Colors inside the matrix indicate the level of similarity: green cells indicate identical burrows; blue cells indicate highly similar burrows; orange cells indicate moderately similar burrows; red cells indicate dissimilar burrows. Appendixes 5-13 are presented in PDF format.
APPENDIX 6. Bray Curtis similarity matrices comparing the burrow architectures of Narceus americanus. 1) Comparison matrix of subvertical burrows. 2) Comparison matrix of vertical burrows. 3) Comparison matrix of helical burrows. 4) Comparison matrix of Type 1 and Type 2 O-shaped burrows. Colors inside the matrix indicate the level of similarity: green cells indicate identical burrows; blue cells indicate highly similar burrows; orange cells indicate moderately similar burrows; red cells indicate dissimilar burrows. Appendixes 5-13 are presented in PDF format.
APPENDIX 7. Bray Curtis similarity matrices comparing the burrow architectures of Floridobolus penneri. 1) Comparison matrix of subvertical burrows. 2) Comparison matrix of vertical burrows. 3) Comparison matrix of J-shaped burrows. 4) Comparison matrix of Type 1 and Type 2 O-shaped burrows. 5) Comparison matrix of helical burrows. Colors inside the matrix indicate the level of similarity: green cells indicate identical burrows; blue cells indicate highly similar burrows; orange cells indicate moderately similar burrows; red cells indicate dissimilar burrows. Appendixes 5-13 are presented in PDF format.
APPENDIX 8. Bray Curtis similarity matrices comparing the similar burrow architectures produced by Narceus americanus (NA) and Floridobolus penneri (FP). 1) Comparison matrix of subvertical burrows. 2) Comparison matrix of vertical burrows. 3) Comparison matrix of helical burrows. 4) Comparison matrix of O-shaped burrows. Colors inside the matrix indicate the level of similarity: green cells indicate identical burrows; blue cells indicate highly similar burrows; orange cells indicate moderately similar burrows; red cells indicate dissimilar burrows. Appendixes 5-13 are presented in PDF format.
APPENDIX 9. Bray Curtis similarity matrix comparing burrows produced by Narceus americanus (NA) to burrows produced by Orthoporus ornatus (OO). Cells outlined in thick black lines in the matrix indicate comparison of burrows with the same architecture. OO1, OO7, and OO10 are subvertical burrows. OO2, OO4, OO6, OO8, and OO9 are vertical burrows. OO5 is a sinuous burrow. OO3 is a U-shaped burrow. OO11–13 are J-shaped burrows. Colors inside the matrix indicate the level of similarity: blue cells indicate highly similar burrows; orange cells indicate moderately similar burrows; red cells indicate dissimilar burrows. Appendixes 5-13 are presented in PDF format.
APPENDIX 10. Bray Curtis similarity matrix comparing burrows produced by Floridobolus penneri (FP) to burrows produced by Orthoporus ornatus (OO). Cells outlined in thick black lines in the matrix indicate comparison of burrows with the same architecture. OO1, OO7, and OO10 are subvertical burrows. OO2, OO4, OO6, OO8, and OO9 are vertical burrows. OO5 is a sinuous burrow. OO3 is a U-shaped burrow. OO11–13 are J-shaped burrows. Colors inside the matrix indicate the level of similarity: green cells indicate identical burrows; blue cells indicate highly similar burrows; orange cells indicate moderately similar burrows; red cells indicate dissimilar burrows. Appendixes 5-13 are presented in PDF format.
APPENDIX 11. Bray Curtis similarity matrix comparing burrows produced by Narceus americanus (NA) to burrows produced by Archispirostreptus gigas (AG). Cells outlined in thick black lines in the matrix indicate comparison of burrows of the same architecture. AG2 and AG8 are sinuous burrows. AG1, AG3, AG4, and AG6 are helical burrows. AG7 and AG5 are U-shaped burrows. Colors inside the matrix indicate the level of similarity: blue cells indicate highly similar burrows; orange cells indicate moderately similar burrows; red cells indicate dissimilar burrows. Appendixes 5-13 are presented in PDF format.
APPENDIX 12. Bray Curtis similarity matrix comparing burrows produced by Floridobolus penneri (FP) to burrows produced by Archispirostreptus gigas (AG). Cells outlined in thick black lines in the matrix indicate comparison of burrows of the same architecture. AG2 and AG8 are sinuous burrows. AG1, AG3, AG4, and AG6 are helical burrows. AG7 and AG5 are U-shaped burrows. Colors inside the matrix indicate the level of similarity: blue cells indicate highly similar burrows; orange cells indicate moderately similar burrows; red cells indicate dissimilar burrows. Appendixes 5-13 are presented in PDF format.
APPENDIX 13. Bray Curtis similarity matrix comparing burrows produced by Orthoporus ornatus (OO) to burrows produced by Archispirostreptus gigas (AG). Cells outlined in thick black lines in the matrix indicate comparison of burrows of the same architecture. OO1, OO7, and OO10 are subvertical burrows. OO2, OO4, OO6, OO8, and OO9 are vertical burrows. OO5 is a sinuous burrow. OO3 is a U-shaped burrow. OO11–13 are J-shaped burrows. AG2 and AG8 are sinuous burrows. AG1, AG3, AG4, and AG6 are helical burrows. AG7 and AG5 are U-shaped burrows. Colors inside the matrix indicate the level of similarity: blue cells indicate highly similar burrows; orange cells indicate moderately similar burrows; red cells indicate dissimilar burrows. Appendixes 5-13 are presented in PDF format.
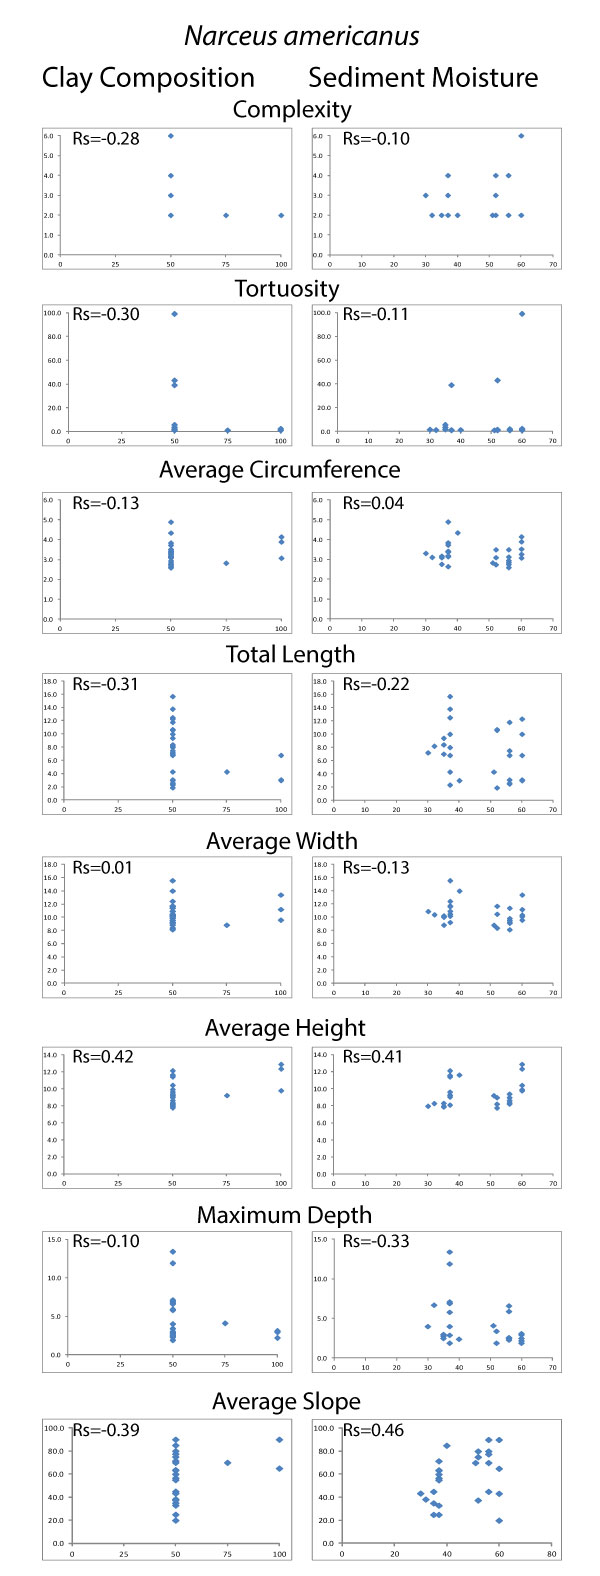
APPENDIX 14. Scatter plots of data used in Spearman's rank correlation tests of Narceus americanus burrows. The x-axis is the relative clay and moisture content in the sediment. The y-axis is the measured value of the burrow property. Rs values indicate no significant relationship between sediment clay and moisture content to any of the eight different quantitative burrow properties tested.
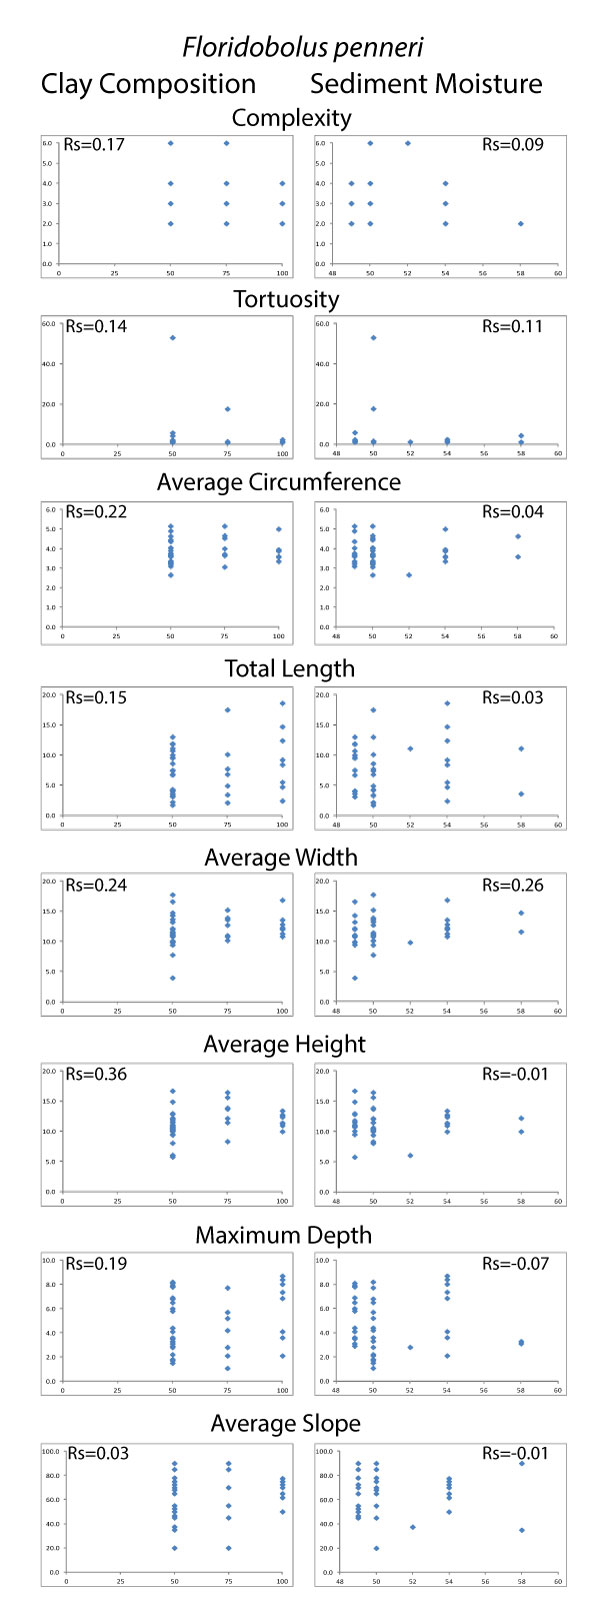
APPENDIX 15. Scatter plots of data used in Spearman's rank correlation tests of Floridobolus penneri burrows. The x-axis is the relative clay and moisture content in the sediment. The y-axis is the measured value of the burrow property. Rs values indicate no significant relationship between sediment clay and moisture content to any of the eight different quantitative burrow properties tested.
