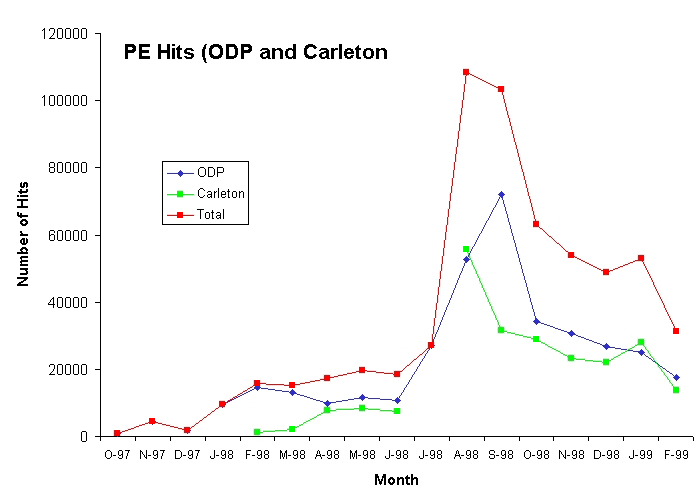
FIGURE 1. Total number of hits per month at our ODP and Carleton sites individually and combined. A single hit represents either an image, a text page, or some other kind of file. The large peak in the late summer of 1998 coincides with the release of our second issue. The data for February 1999 were not complete at the time this graph was produced so the downswing there is an artefact. Readership for Vol. 1, Issue 2 was about 3 times higher than that for Vol. 1, Issue 1.