FIGURE 1. Map of the studied area with beach-bar-tidal flat-back swamp. The actual photograph is taken from the Google Earth (2013).
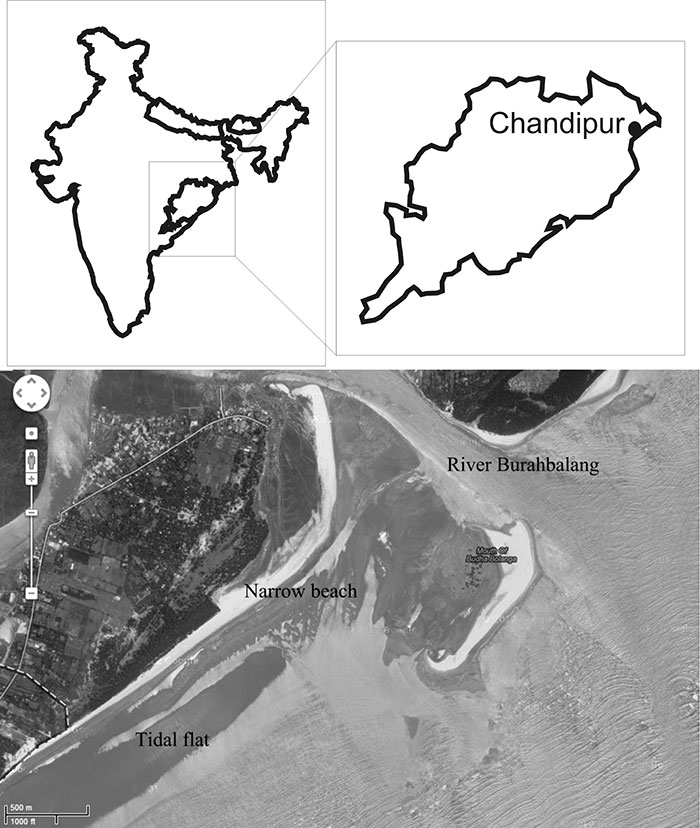
FIGURE 2. Several types of damages on the bivalve shells have been used as an indicator of breaks. 1-3,valves are gaped even when they are closed, 1 and 3, scars are mirror imaged on two valves; 4,internal view of the bivalve shows sign of repair due to severe break (visible at the external side); 5,a severe break (Grade I) has been repaired by carbonate secretion; 6-7, retention of broken fragment near a large break (arrows).
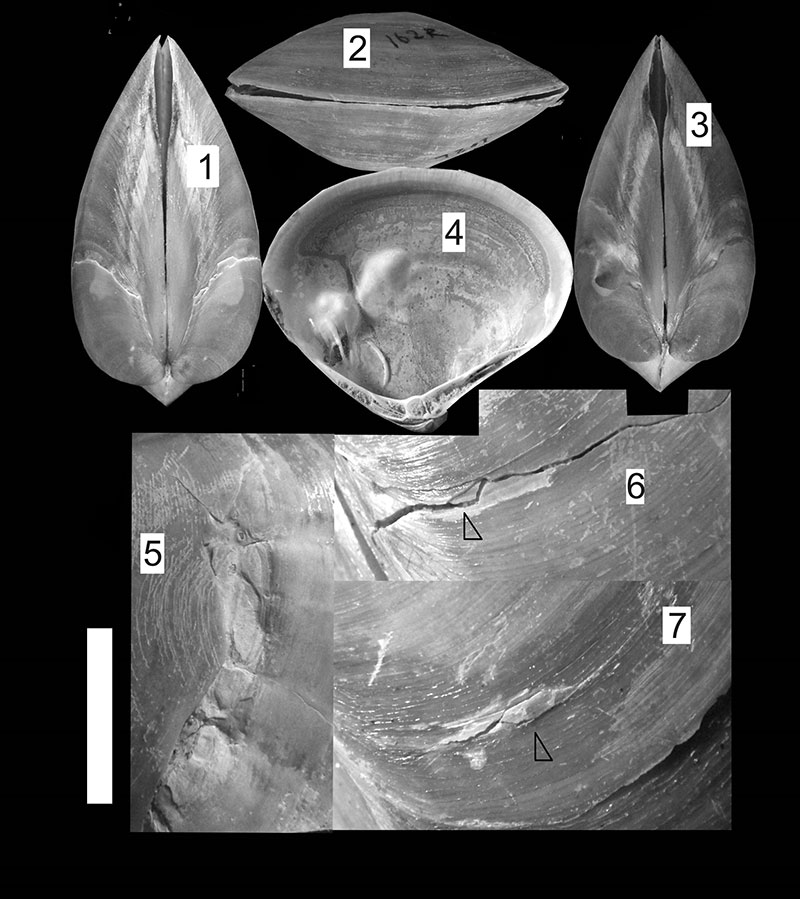
FIGURE 3. Different types of repair scars on Mactra violacea are presented here. See that the valves (7 and 10) have distinct undulation because of a severe break (Grade I).
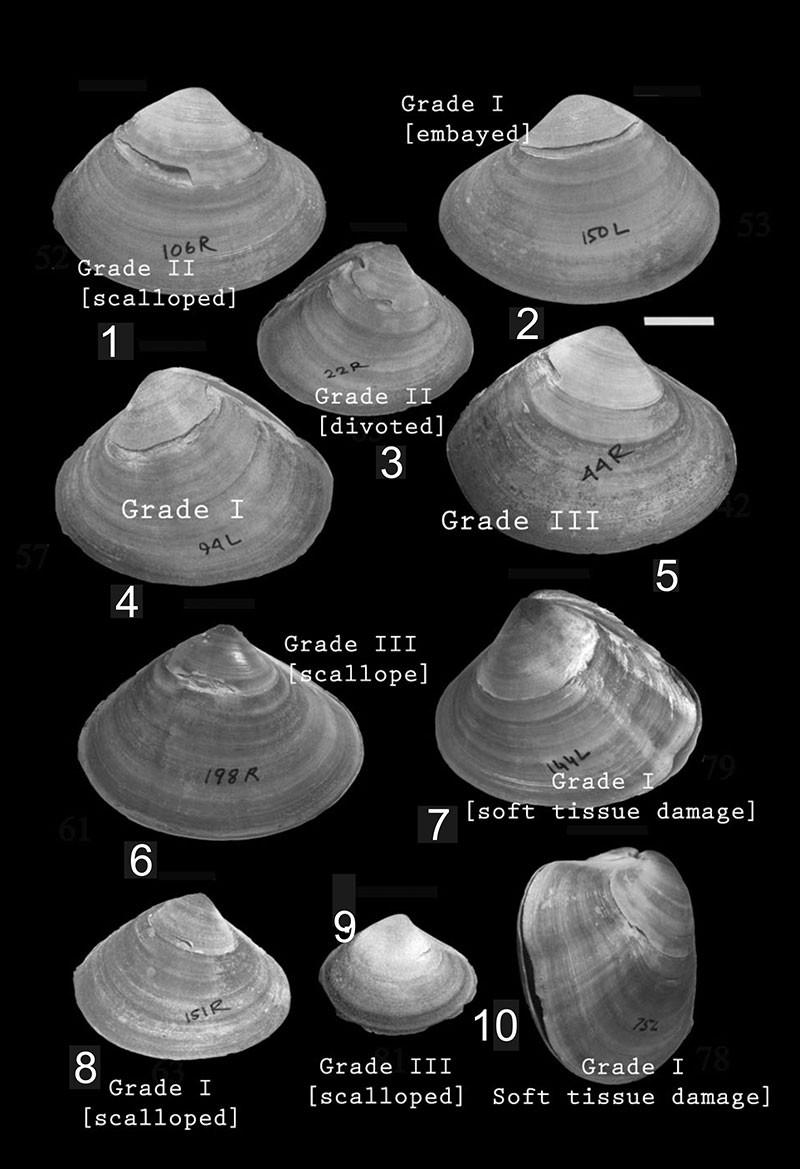
FIGURE 4. Schematic diagram of the studied species, Mactra violacea, shows scar distribution (the pie chart at right) on the valves (i.e., the grids at left). Note that the venter (location 2 and 3 together) has maximum number of scars.
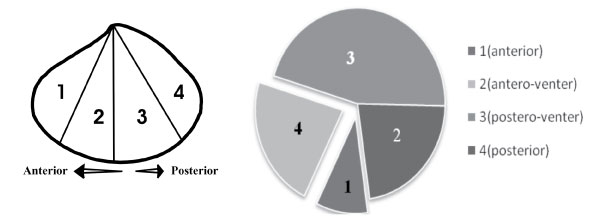
FIGURE 5. The graph shows absolute frequency distribution of ‘length at death’ and ‘length at the incidence of scarring’ on bivalve shells. Note marked differences in absolute frequency distributions of these two lengths. Presence of non-random distribution of ‘length at death’ indicates that the samples are not winnowed from the actual habitat of the living bivalves.
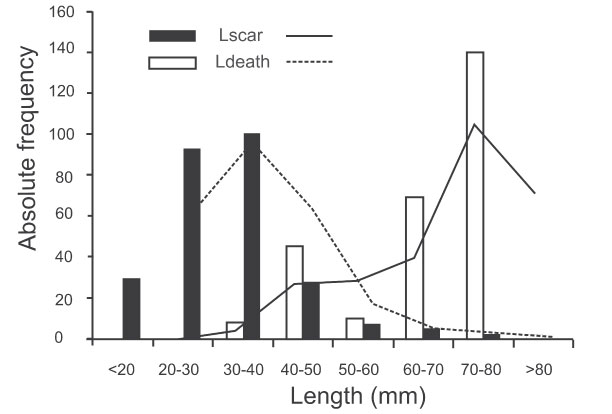
FIGURE 6. Ontogenetic changes in M. violacea. The figures indicate changes in depth of living, shell thickness at venter and ventral angle with ontogeny, supporting lower incidence of shell damages.
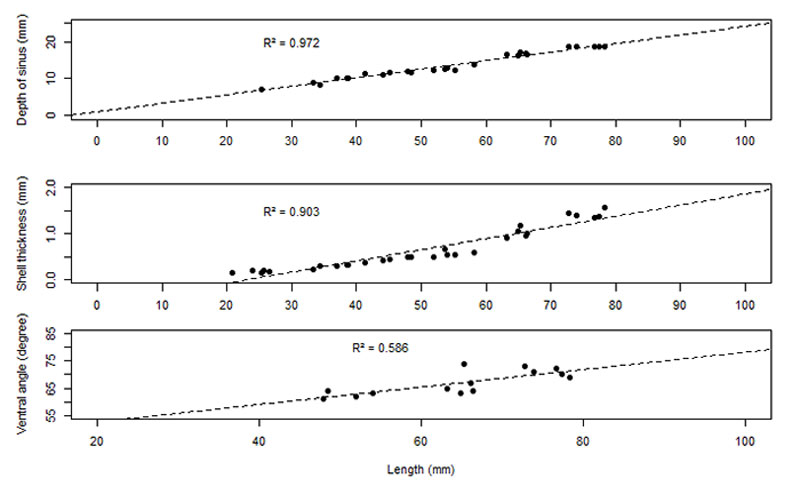
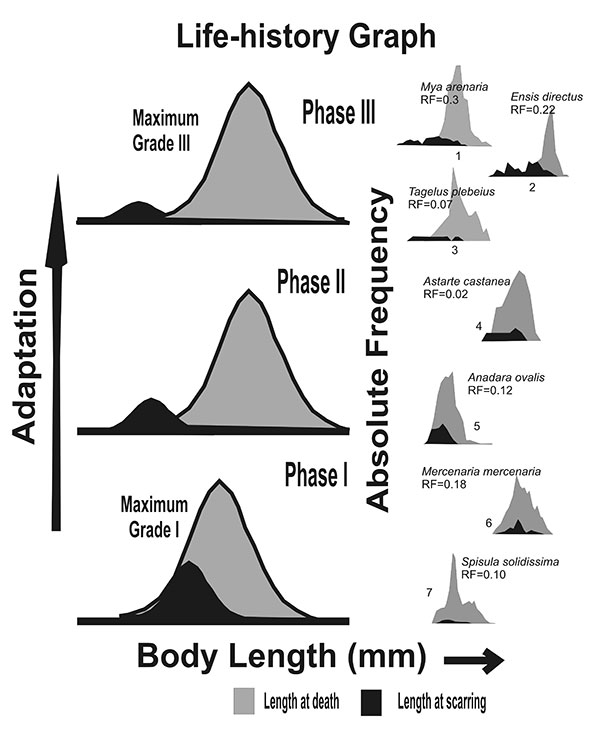
FIGURE 7. The model shows (left column) how species’ adaptation allows it to reduce frequencies of severe damages with time (i.e., from Phase I to Phase III). In addition to it, the model also shows how death due to scarring is minimized by moving away from the frequency distribution of length at scarring (see text). The right column presents many examples of these distributions, redrawn from Alexander and Dietl (2001).