FIGURE 1. Location of the study area; 1) Geographical context of the Guadiana River basin in the Iberian Peninsula (Europe). Adapted from chguadiana.es (2012). Coordinate system: Datum ETRS89 UTM Zone 30N; 2) Study area: Map of the Guadiana Estuary with site locations.
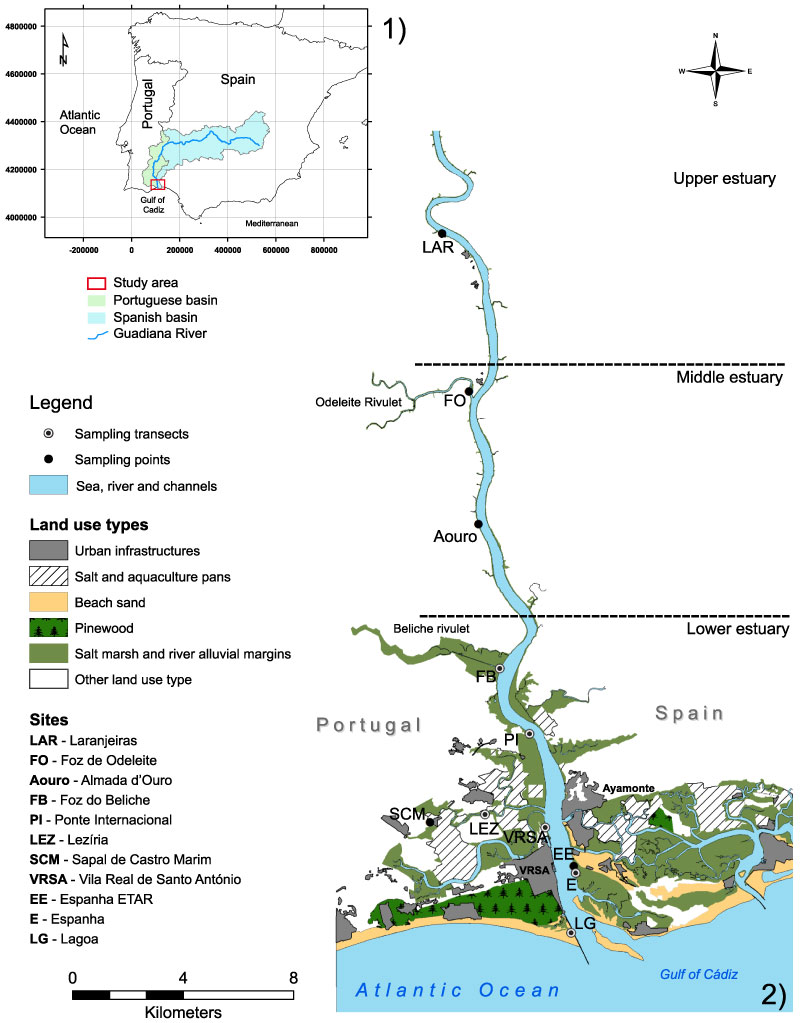
FIGURE 2. Scanning electron micrographs of the foraminifera specimens. Scale bar equals 100 µm. 1-3- Three different specimens of Polysaccammina ipohalina Scott, 1976b, illustrating the differences in size and form. In all specimens it is possible to see attached organic matter; 4-5- Polysaccammina hyperhalina Medioli, Scott, and Petrucci, 1983. 4- complete specimen of P. hyperhalina ; 5- aperture view; 6- specimen with several side branches; 7-10- different sized specimens of Ammovertellina sp.; 11-14- various specimens of Reophax nana Rhumbler, 1913; 15-17- Leptohalysis scottii (Chaster, 1892); 15 and 16- side view of two complete specimens; 17- detail on the agglutination of the last chamber; 18- complete specimen of Ammobaculites exiguus Cushman and Brönnimann, 1948b; 19- Ammobaculites sp. with the uncoiled portion broken; 20-22- Ammotium salsum (Cushman and Brönnimann, 1948a); 20- best specimen; 21- smaller specimen; 22- aperture detail; 23- Ammotium sp.; 24-26- different specimens of Miliammina fusca (Brady, 1870); 27-28- Miliammina obliqua Heron-Allen and Earland, 1930; 27- view of the interio-marginal arch of the aperture; 29-30- Arenoparrella mexicana (Kornfeld, 1931); 29- ventral side with view to main aperture and supplementary apertures; 30- dorsal side with view to supplementary apertures; 31-32- Deuterammina eddystonensis Brönnimann and Whittaker, 1990; 31- dorsal view; 32- ventral view; 33-35- Jadammina macrescens (Brady, 1870); 33- dorsal view; 34- ventral view; 35- dorsal view of a deformed test.
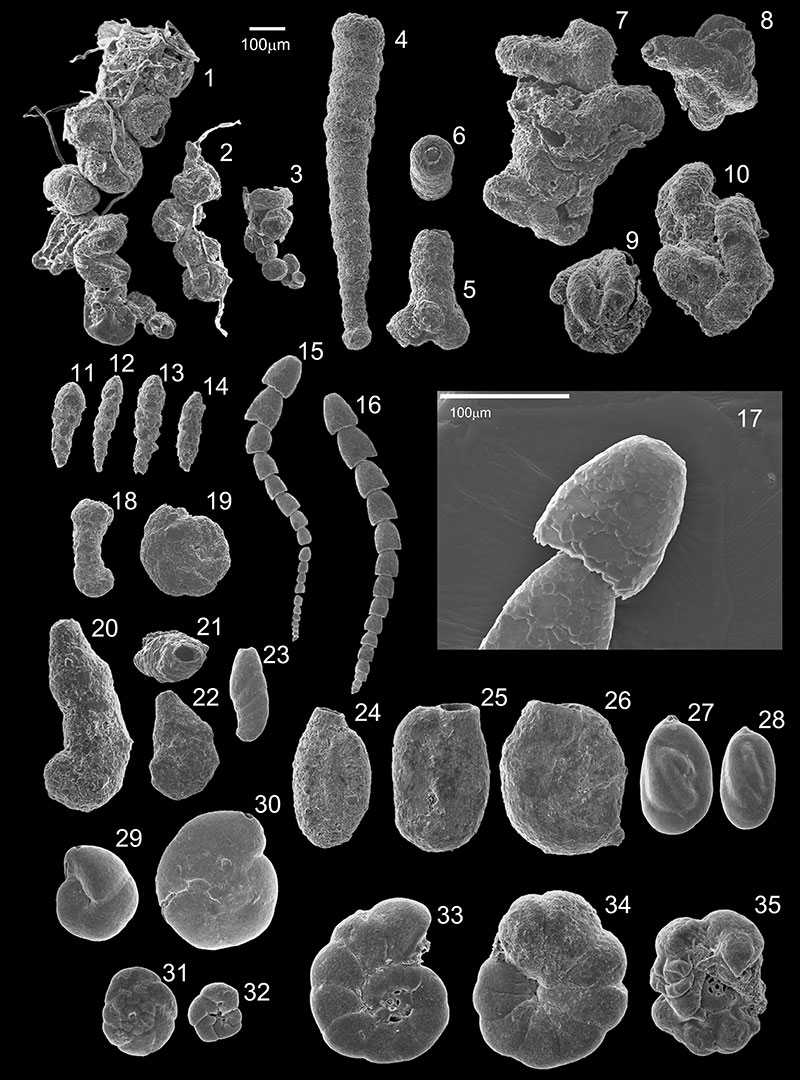
FIGURE 3. Scanning electron and light microscope micrographs of the foraminifera specimens. Scale bar equals 100 µm except where noted otherwhise; 1-2- Jadammina macrescens (Brady, 1870); 1- supplementary apertures view; 2- detail of supplementary apertures (scale bar = 50 µm); 3-4- Lepidodeuterammina plymouthensis Brönnimann and Whittaker, 1990; 3- dorsal view; 4- ventral view; 5-8- Lepidodeuterammina ochracea (Williamson, 1858); 5- dorsal view; 6- ventral view; 7- dorsal view of a smaller specimen; 8- ventral view of a smaller specimen; 9-10- Portatrochammina sp.; 9- dorsal view; 10- ventral view; 11-13- Siphotrochammina sp.; 11- dorsal side with inter-cameral foramen view; 12- dorsal view of a smaller specimen, also with inter-cameral foramen; 13- ventral view of a smaller specimen; 14-16- Tiphotrocha comprimata Saunders, 1957; 14- dorsal view; 15- ventral view; 16- individual strongly attached to a sea-grass leaf; detail of a Pinus pollen grain at the center of the leaf; 17-21- Trochammina inflata (Montagu, 1808); 17- dorsal view; 18- ventral view; 19- ventral view with umbilical tube detail; 20- microspheric form dorsal view; 21- microspheric form ventral view; 22- Eggerelloides scaber (Williamson, 1858); 23-25- Textularia earlandi Parker, 1952; 23- apertural view; 24- lateral view; 25- profile view with aperture in detail; 26-29- Discorinopsis aguayoi (Bermúdez, 1935); 26- scanning electron dorsal view; 27- scanning electron ventral view; 28- light microscope dorsal view; 29- light microscope ventral view.
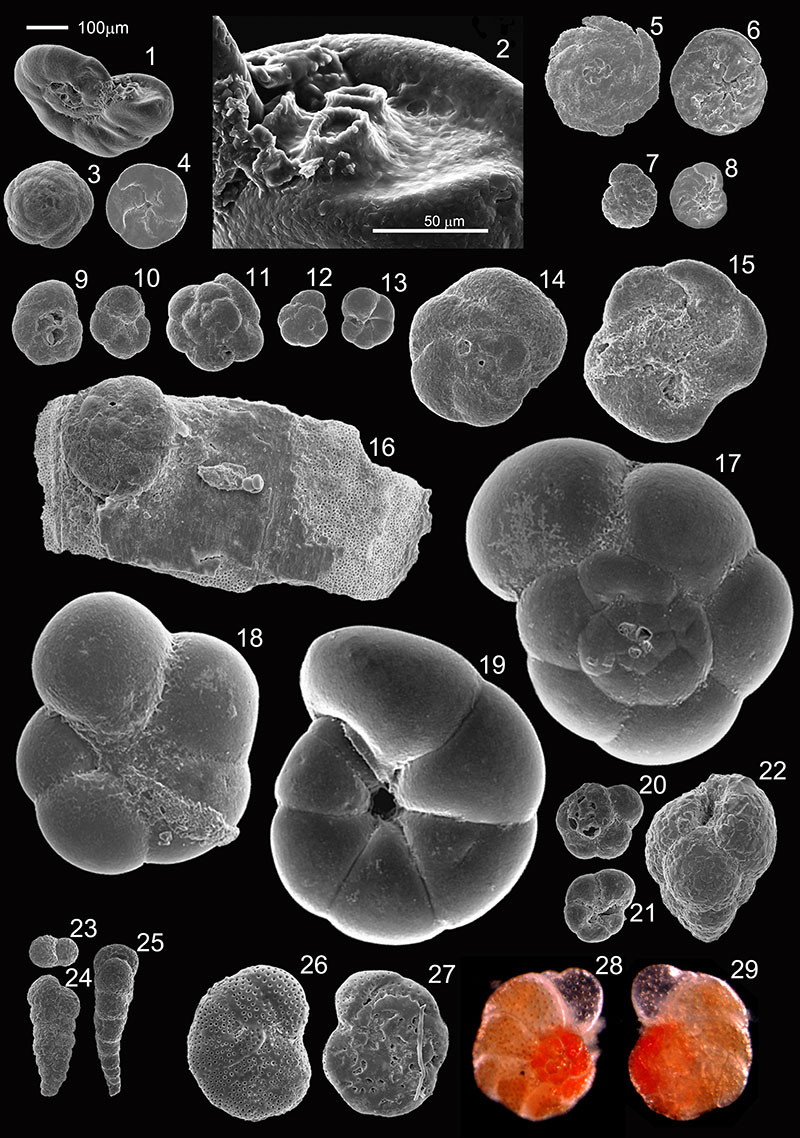
FIGURE 4. Scanning electron micrographs of the foraminifera specimens. Scale bar equals 100 µm. 1-4- different sized specimens of Bolivina ordinaria Phleger and Parker, 1952, new name; 5- Buliminella elegantissima (d’Orbigny, 1839b); 6 - 7- Cornuspira involvens (Reuss 1850); 8-10- Miliolid sp1; 8- apertural view; 9- front view; 10- back view; 11-13- Miliolid sp2; 11- apertural view; 12- front view; 13- back view; 14-16- Miliolid sp3; 14- front view; 15- apertural view; 16- back view; 17-18- Miliolid sp4; 17- apertural view; 18- front view; 19-21- Miliolid sp5; 19- apertural view; 20- front view; 21- back view; 22-23- Miliolid sp6; 22- front and apertural view; 23- back view; 24-26- Miliolid sp7; 24- front view; 25- apertural view; 26- front and apertural view; 27-29- Miliolid sp8; 27- front view; 28- apertural view; 29- front view of a smaller specimen.
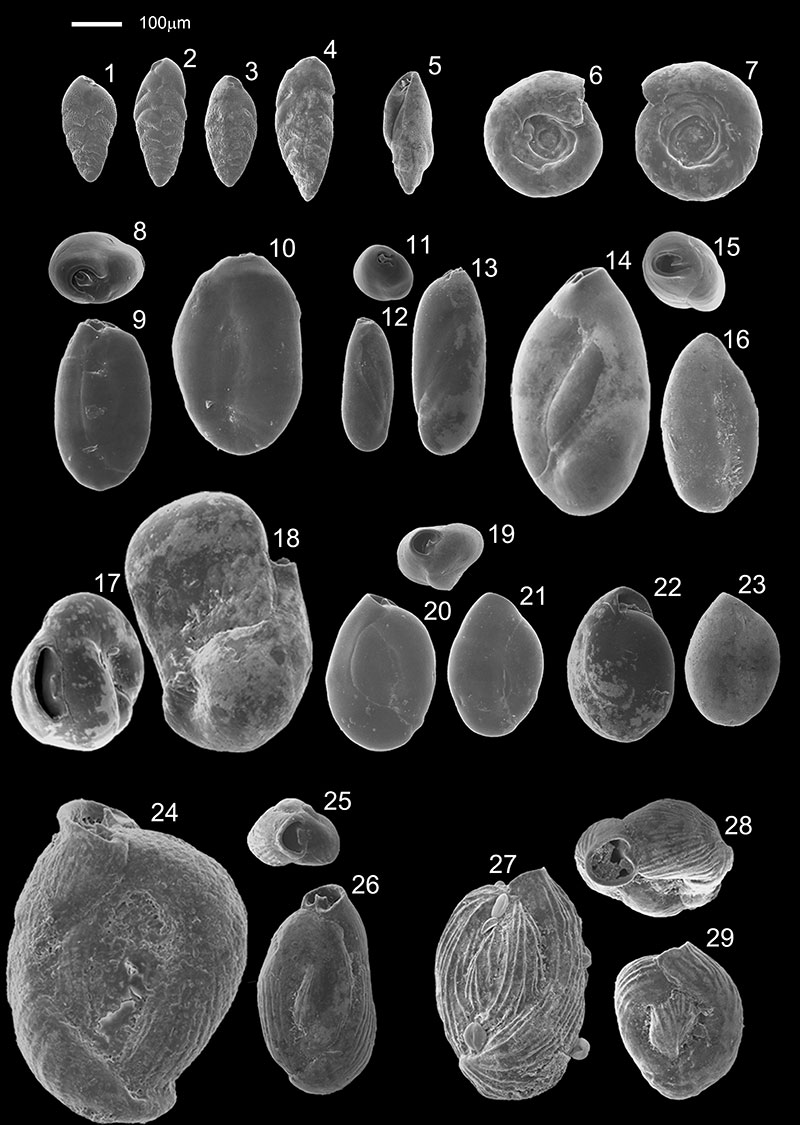
FIGURE 5. Scanning electron and light microscope micrographs of the foraminifera specimens. Scale bar equals 100 µm. 1- Lamarckina haliotidea (Heron-Allen and Earland, 1911) ventral view; 2-3- Asterigerinata mamilla (Williamson, 1858); 2- dorsal view; 3- ventral view; 4-5- Discorbis sp.; 4- dorsal view; 5- ventral view; 6-7- Helenina anderseni (Warren, 1957); 6- dorsal view; 7- ventral view; 8- Haynesina depressula (Walker and Jacob, 1798) side view; 9- Haynesina germanica (Ehrenberg, 1840) side view; 10- Elphidium advenum (Cushman, 1922) side view; 11- Elphidium excavatum (Terquem, 1875) side view; 12-15- Elphidium wiliamsoni Haynes, 1973; 12- side view in light microscope image; 13- side view in scanning electron image; 14- profile view in scanning electron image; 15- side view of a smaller specimen in scanning electron image; 16-18- side view of different size Elphidium gerthi Van Voorthuysen, 1957; 19-21- Elphidium oceanensis (d’Orbigny, 1826); 19- side view in scanning electron image; 20- profile view in scanning electron image; 21- side view in light microscope image; 22- Elphidium poeyanum (d’Orbigny, 1826) side view; 24-27- Ammonia sp1; 24- dorsal view; 25- profile view; 26- ventral view; 27- dorsal view in light microscope image; 28-31- Ammonia sp2 ( Ammonia aberdoveyensis Haynes, 1973); 28- dorsal view; 29- profile view; 30- ventral view; 31- dorsal view in light microscope image; 32-35- Ammonia sp3 ( Ammonia aberdoveyensis Haynes, 1973); 32- dorsal view; 33- profile view; 34- ventral view; 35- dorsal view in light microscope image.
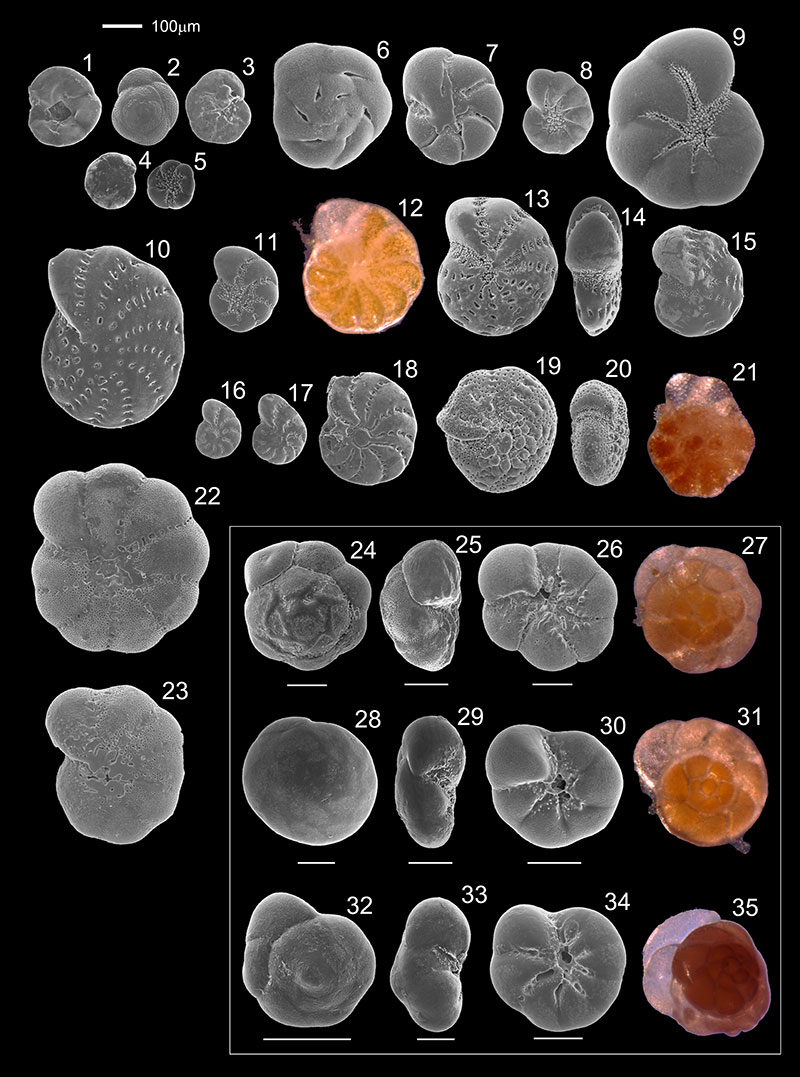
FIGURE 6. RDA attribute plot representing the distribution and abundance of the dominant species in Guadiana Estuary according to elevation and distance-to-sea variables.
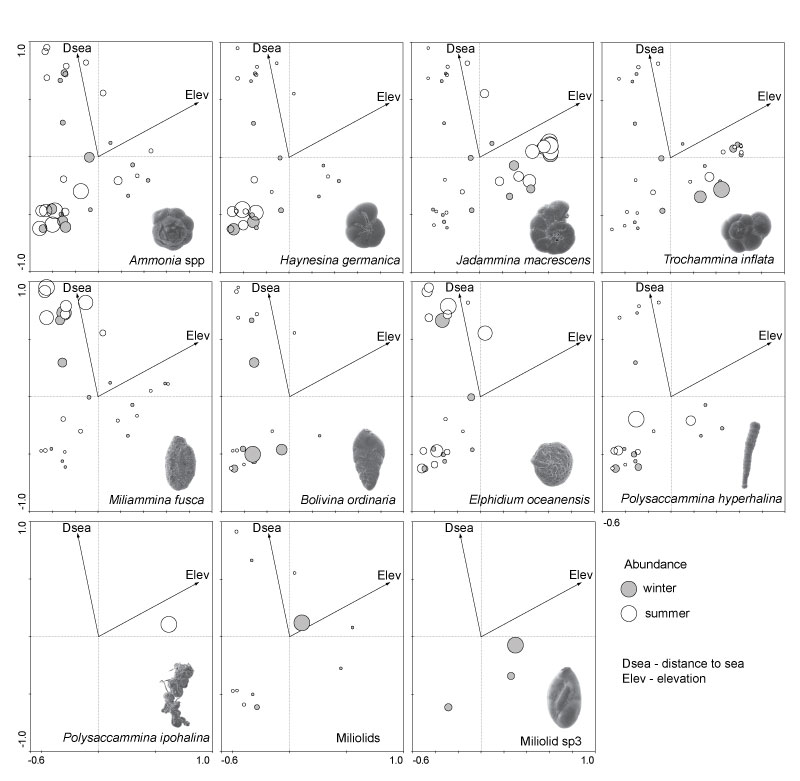
FIGURE 7. Distribution patterns of the common to dominant species in the samples collected in winter along a distance-to-sea and elevation gradients (in relation to MSL).
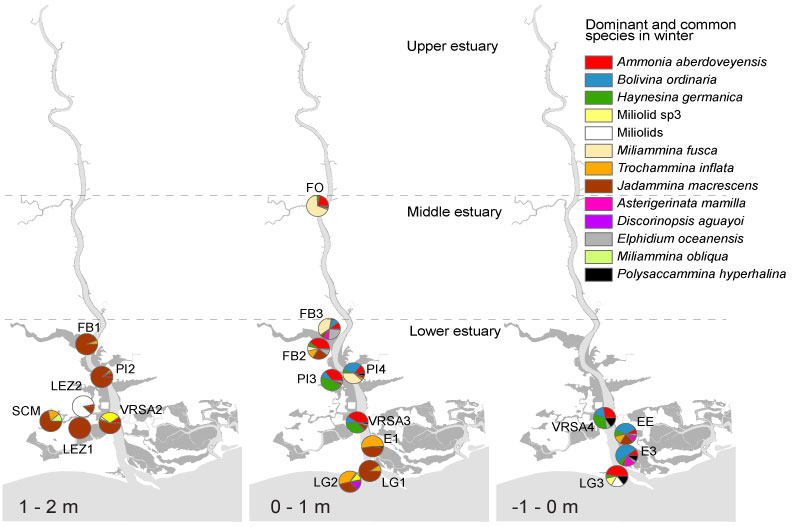
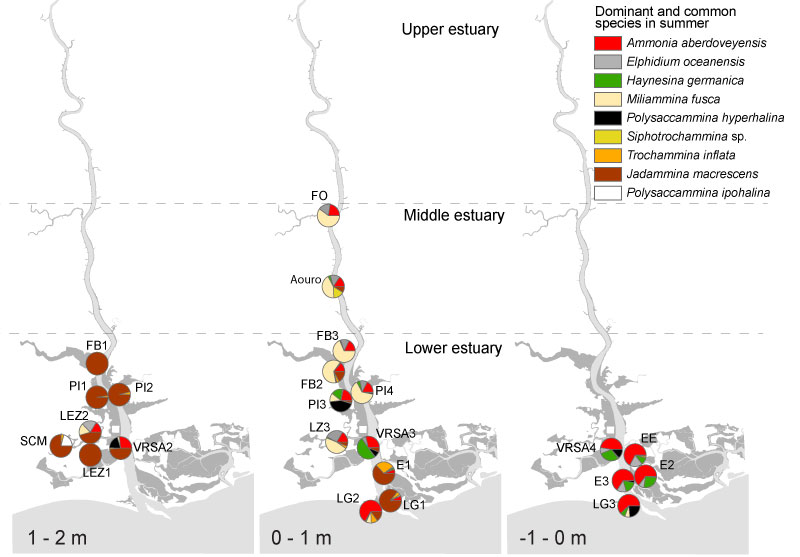
FIGURE 8. Distribution patterns of the common to dominant species in the samples collected in summer along a distance-to-sea and elevation gradients (in relation to MSL).