FIGURE 1. Optical set up specifications for fringe projection profilometry (FPP) used in this study for the recovery of a 3-D image of a hemimandible sample.
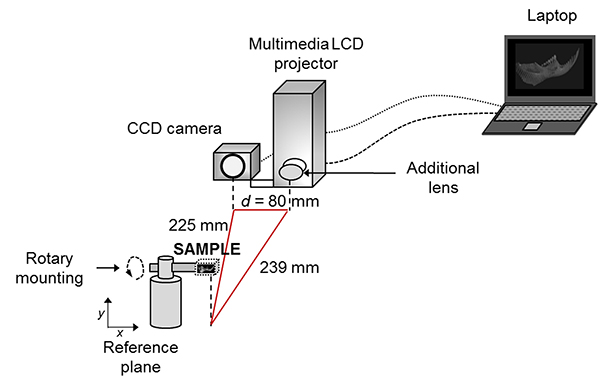
FIGURE 2. Flowchart of the 'OTY' procedure employed in this study, where: α = angle (60º in this case), * = MBE algorithm (Gutiérrez-García et al., 2013), and ** = Goldstein algorithm. OTY: name given to the white light system together with the phase shifting algorithm filter, based on the fact that it was developed for use on Ototylomys samples (see main text).
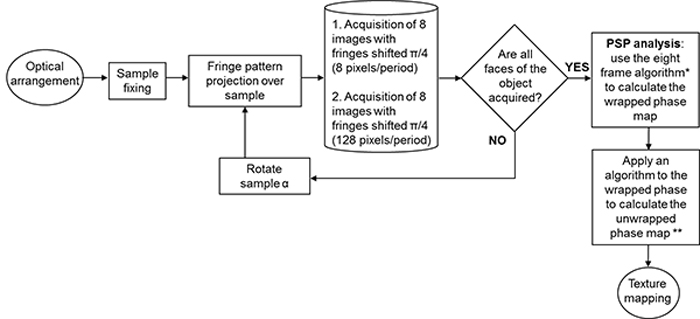
FIGURE 3. Magnitude maps of the sample obtained every 60º for 8 and 128 pixels/period. The images show the resolution and detail levels given the number of fringes projected over the sample. The measurements’ accuracy of surface and depth depends on the number of projected fringes, which include as many as the system can display (8 pixels/period for each fringe in this case). When the acquisition of details is difficult, a wider fringe is required (based on our sample size, we used 128 pixels).
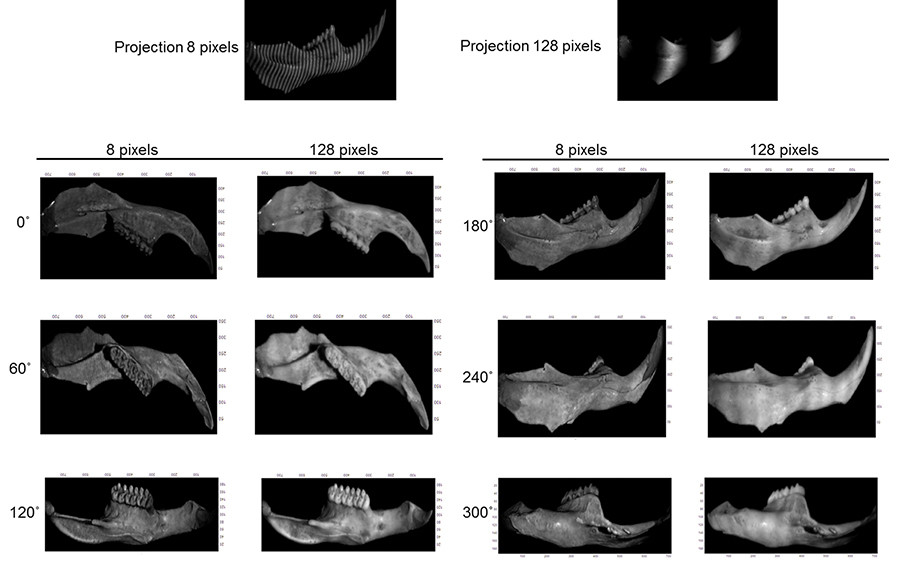
FIGURE 4. Process applied to recover the topography of the fossil sample. Where: 1) image captured by the CCD of the fringe projection on the sample, 2) wrapped phase obtained of the 8 frames after applying the MBE filter, 3) unwrapped phase map, 4) phase carrier compensation, and 5) surface of one of the views of the fossil recovered.
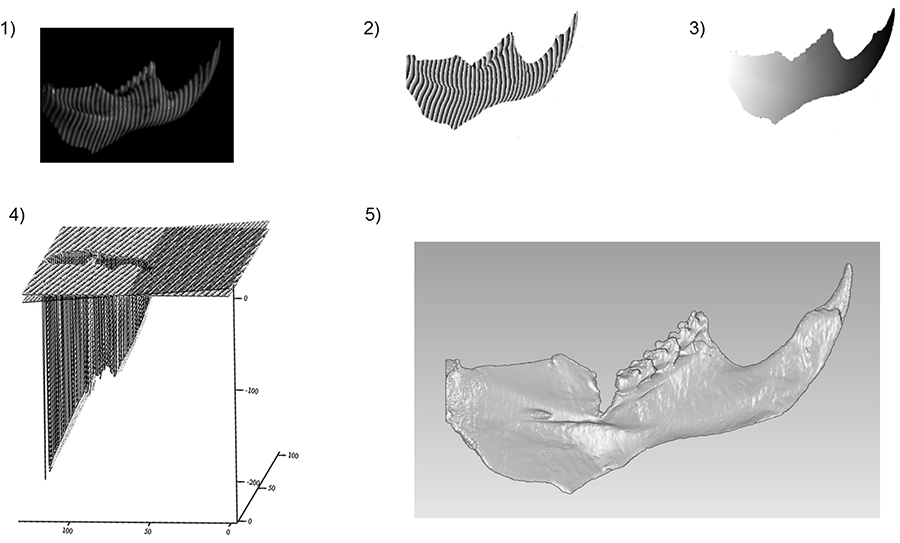
FIGURE 5. Processed views of a fossil sample acquired by the optical FPP system OTY. Each view is re-oriented 60º degrees with respect to the prior. Where: “a” indicates a zone that has no information at 60º in this stage of the process and will be corrected with the information of the next view, as is shown in “b”.
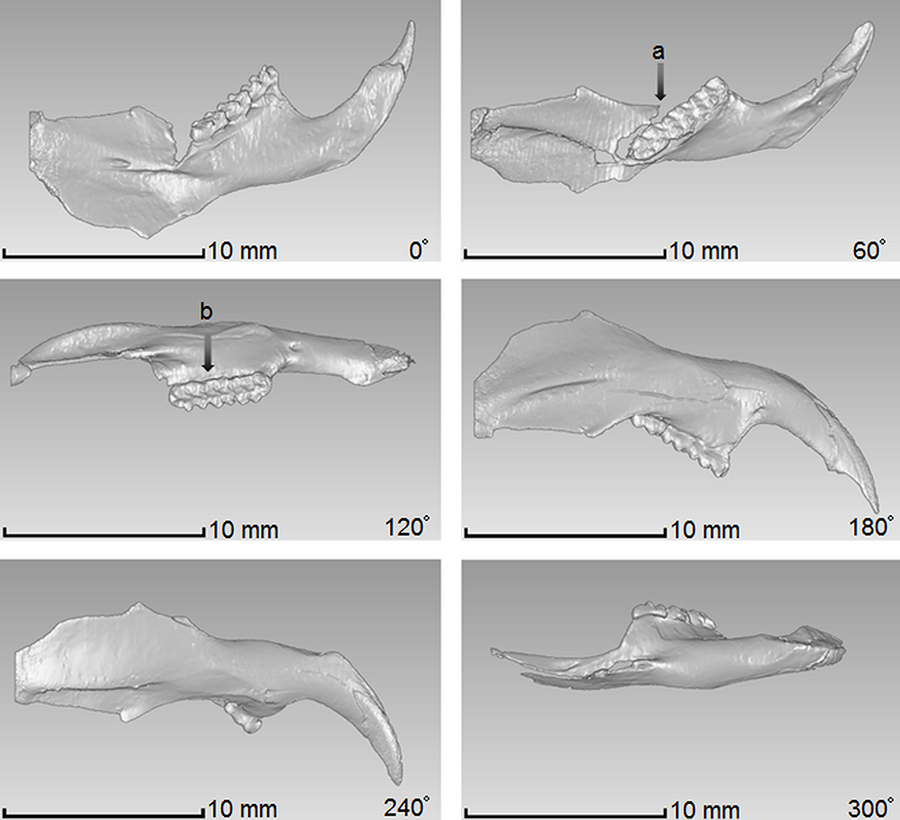
FIGURE 6. Full 3-D image of the reconstructed fossil after merging all the six views. 1) Cloud of points, 2) Final mesh.
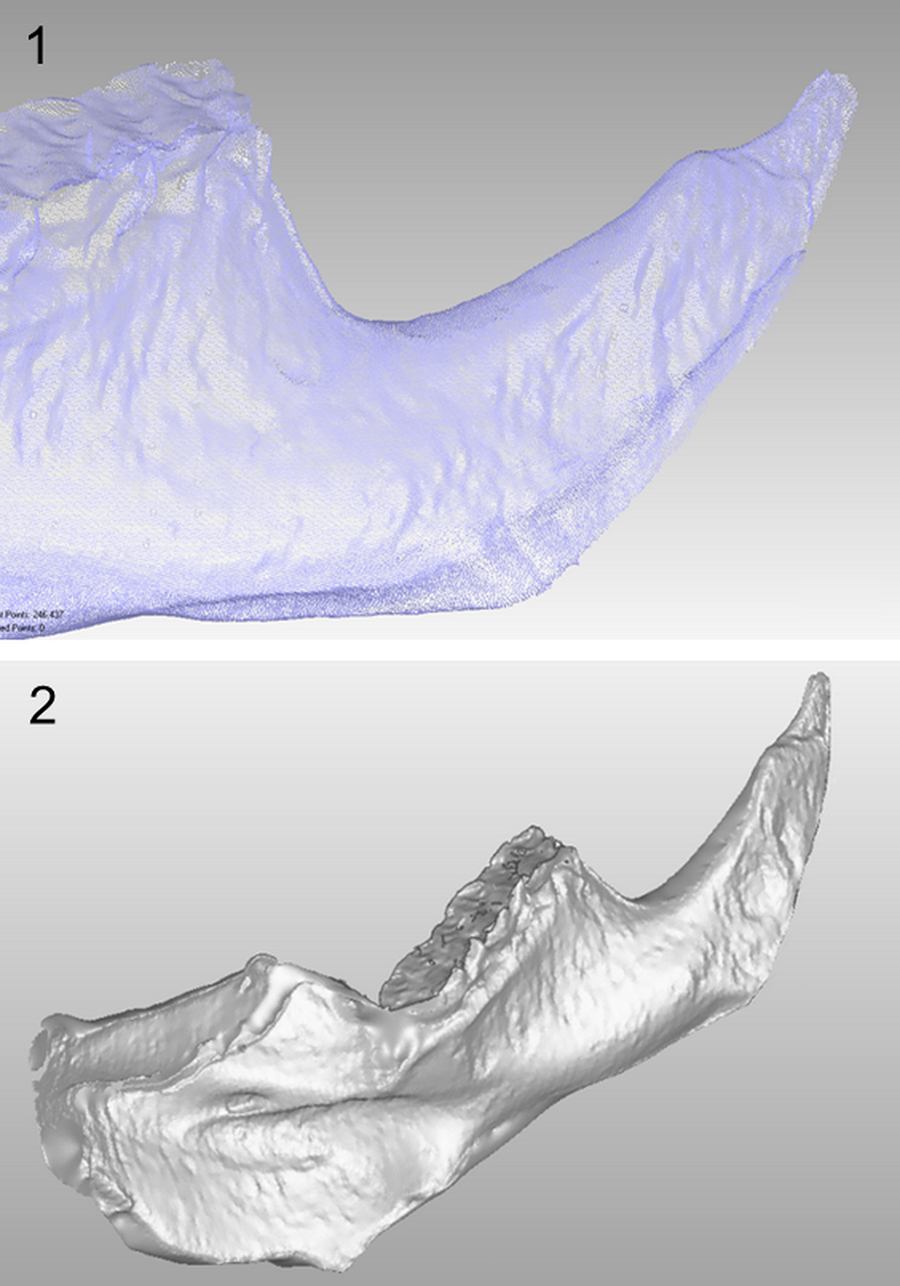
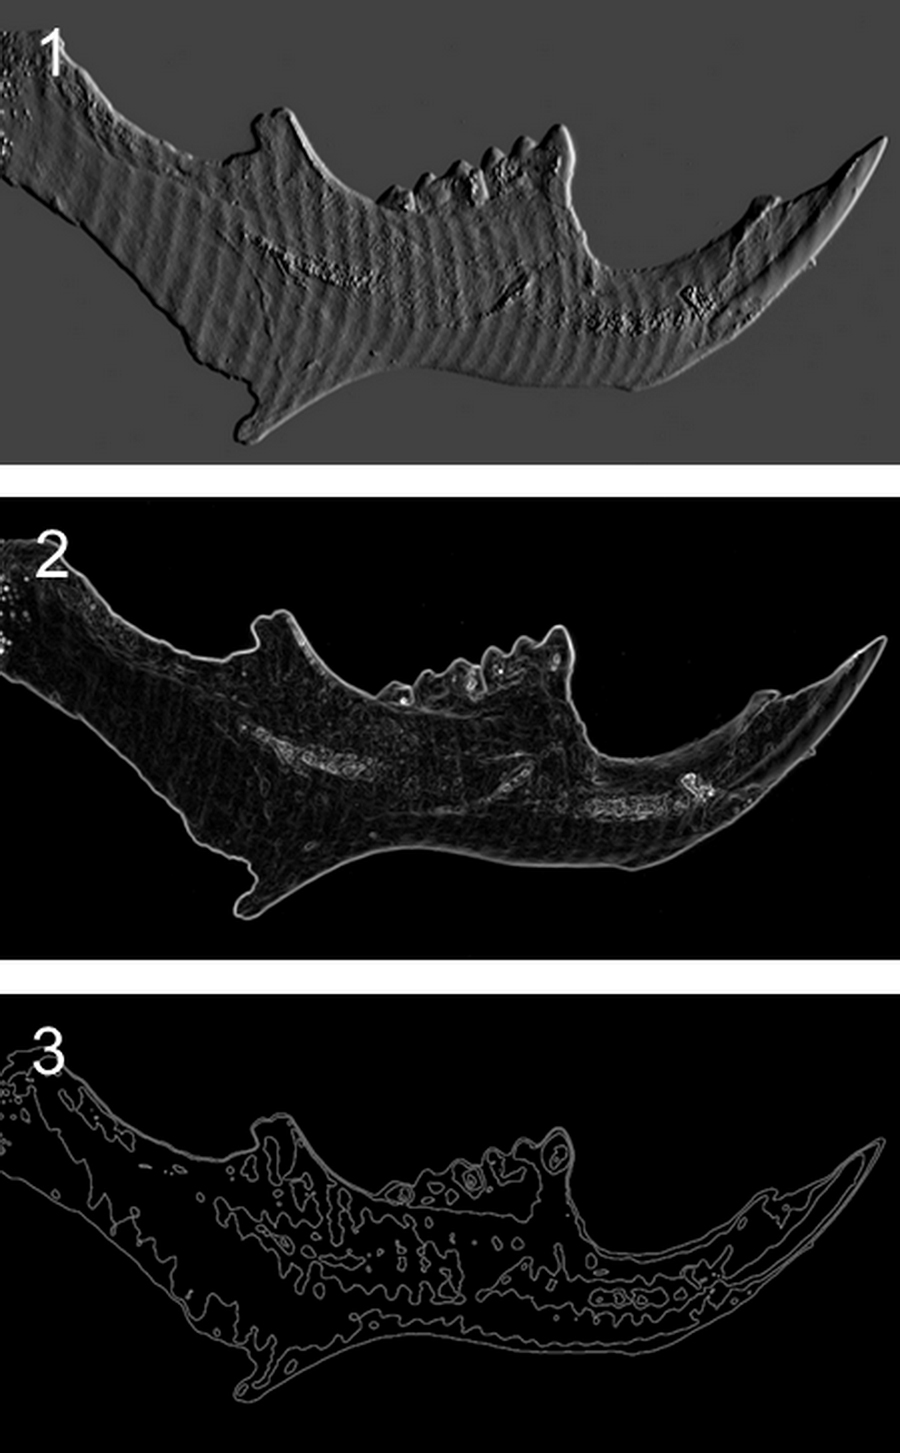
FIGURE 7. Examples of analyses that can be performed with the obtained data from the fossils: 1) denoting the relief (emboss filter), 2) detecting edges and transitions (sobel filter), 3) study of the roughness and waviness of a sample (topography filter).