FIGURE 1. Stratigraphic table of the Holocene with suggested boundaries for the climatic phases, the Ages of Man and the Baltic Stages. The Chronozones, the Ages of Man and the Baltic stages of the Latest Pleistocene are also included. The colour code corresponds to the colours in the supplied kml-file. The dates are expressed in Ma BP. For information about the sources see ´Methods´. Abbreviations used in the chart: S.s. = Sea stage.
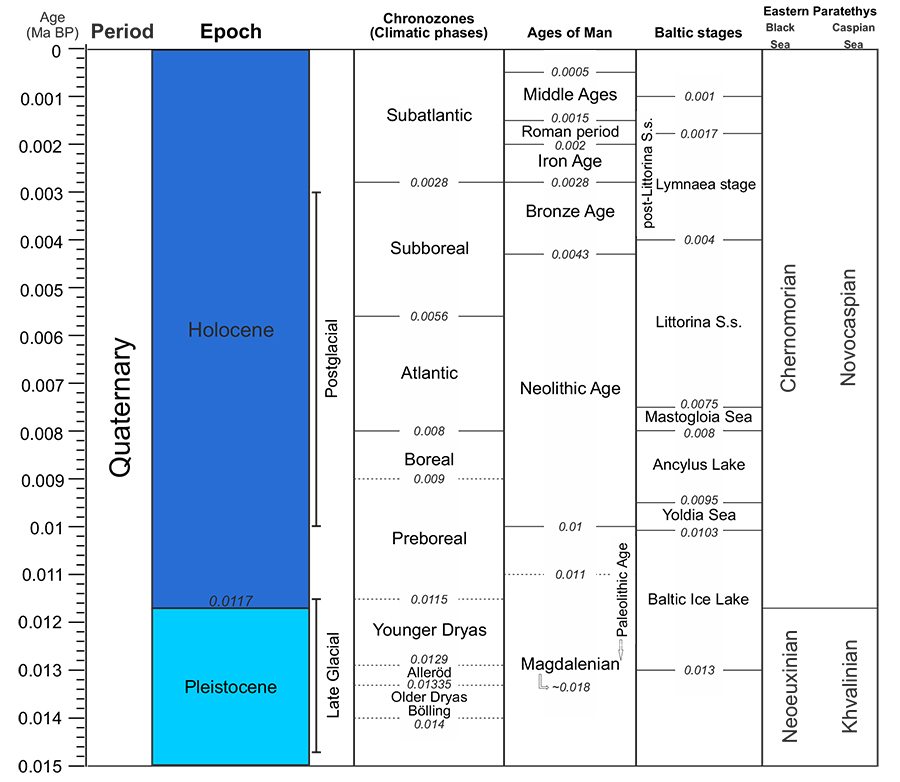
FIGURE 2. Stratigraphic table of the Pleistocene based on the global chronostratigraphic correlation table for the last 2.7 million years (Cohen and Gibbard, 2011). The Marine Isotope Stages (MIS) follow Lisiecki and Raymo (2005). The colour code corresponds to the colours in the supplied kml-file. The dates are expressed in Ma BP. The first 0.1 Ma are not to scale. For information about the sources see ´Methods´. Abbreviations used in the chart: Bram. = Bramertonian, CI = Cromerian Interglacial, LG = Last Glacial, Mid. Pol. Com. = Middle Polish Complex, M/R I. = Mindel/Riss Interglacial, Nor. Pol. Com. = North Polish Complex, Pre-Past./Bav. = Pre-Pastonian/Baventian, R/W I. = Riss/Würm Interglacial.
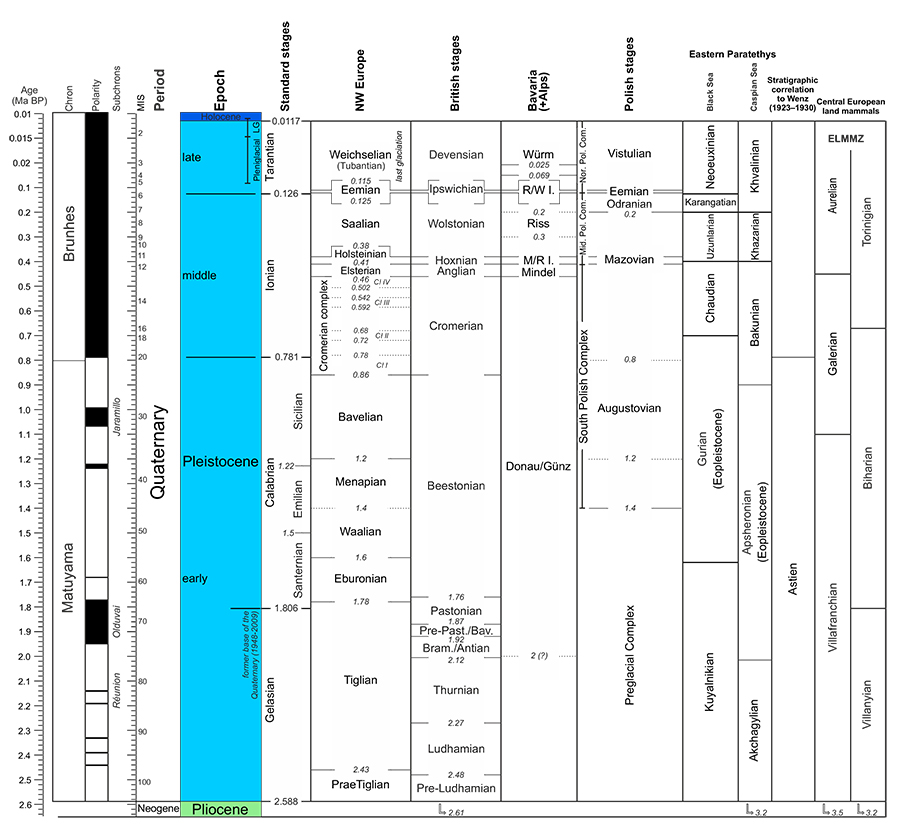
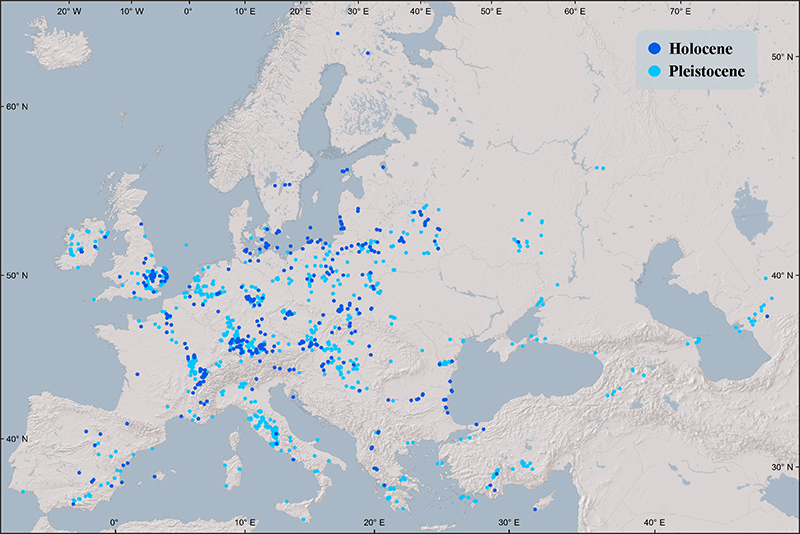
FIGURE 3. European Pleistocene and Holocene localities with fossil and subfossil freshwater gastropods as recorded from the published literature. For complete data see Appendix 1.