FIGURE 1. Ventral, dorsal, posterior, and longitudinal-sectional views of the fossil brachiopods Laqueus rubellus, Terebratula terebratula, Pseudoatrypa sp., and Platystrophia ponderosa . Scale bars equal 1 cm.

FIGURE 2. Example of a shell sample ( Platystrophia ponderosa) sectioning through the plane of symmetry, producing two identical halves. Both halves were analyzed for their spiral deviations.

FIGURE 3. Example of shell ( Laqueus rubellus) digitization and spiral fitting. 1, The brachiopod shell was digitized by clicking the outline in an anterior-ward direction, starting at the umbo. 2, The digitized outline was saved as (x,y) coordinates, which were used to plot a biological outline in R. 3, R code was used to fit a perfect logarithmic spiral to the shell outline. 4, The deviations from a perfect spiral were represented in a spiral deviation graph, with green points representing spiral maxima and red points representing spiral minima.

FIGURE 4. Spiral deviations from the dorsal and ventral valves of specimens one ( 1), two ( 2), and three ( 3) of the species Laqueus rubellus .

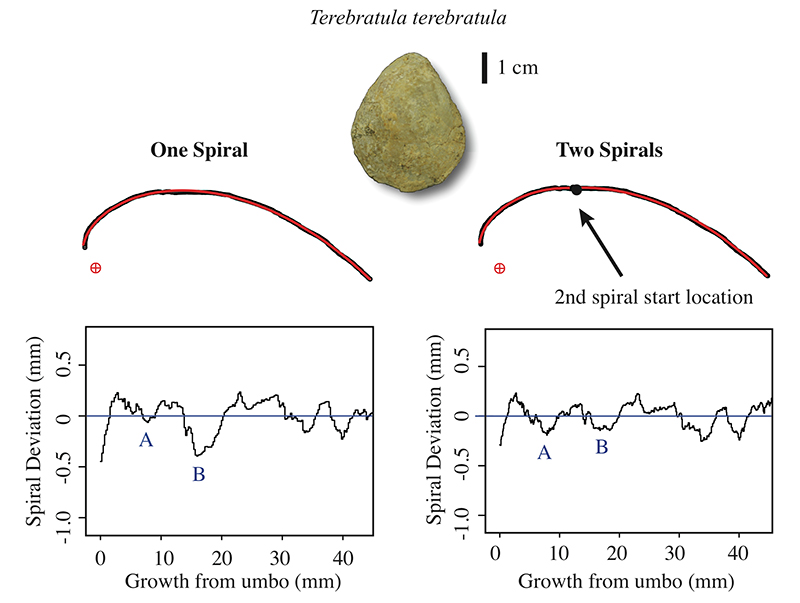
FIGURE 5. Spiral deviations from three specimens of the species Terebratula terebratula.

FIGURE 6. Spiral deviations from three specimens of the species Platystrophia ponderosa.

FIGURE 7. Spiral deviations from three specimens of the species Pseudoatrypa sp.

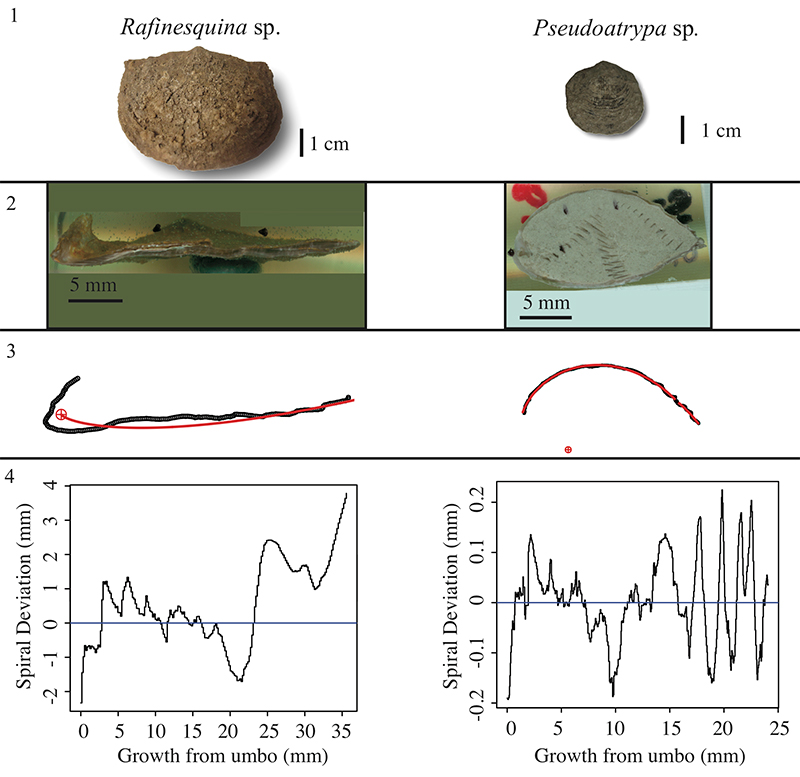
FIGURE 8. Example of two fossil brachiopod species, Rafinesquina sp. (left) and Pseudoatrypa sp. (right), which generated problematic spiral deviation graphs. 1, Ventral view 2, Longitudinal-sectional view 3, Spiral fitting 4, Spiral deviations graphs.

FIGURE 9. Comparison of spiral deviation graphs when the dorsal valve of Terebratula terebratula specimen is fit to one (left) and two (right) spirals. A and B represent locations on the graphs that change drastically when two spirals are fit to the biological outline instead of one. Minimum A becomes more distinct when two spirals are used whereas the opposite occurs for minimum B.


