FIGURE 1. 1. Middle Devonian paleogeographic situation with indication of the study area (courtesy of R. Blakey, NAU Geology), 2. Map of Paleozoic rocks on the Iberian Peninsula and position of Figure 1.3, 3. Location of the studied Devonian outcrops.
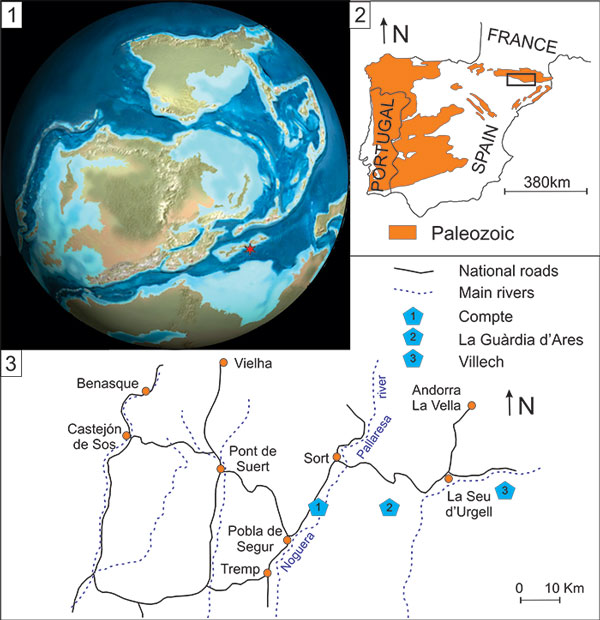
FIGURE 2. 1. Map of Paleozoic rocks on the Iberian Peninsula and position of Figure 2.2 (black square), 2. Structural geological map of the Spanish Pyrenees with indication of the studied area (white square) and 2. Structural geological map of the Spanish Pyrenees with indication of the studied area (red square) and the most important faults and thrust faults, FNP: North Pyrenean Fault, CPP: Petites Pyrénées thrust fault, CFN: Frontal North Pyrenean thrust fault, CFS: Frontal South Pyrenean thrust fault [modified from Barnolas and Pujalte (2004)], 3. Map of the Devonian facies areas and subdivision of the southern facies area in the southern Spanish Pyrenees [modified from Zwart (1979)], studied area in black square, location of the sections indicated by black stars.
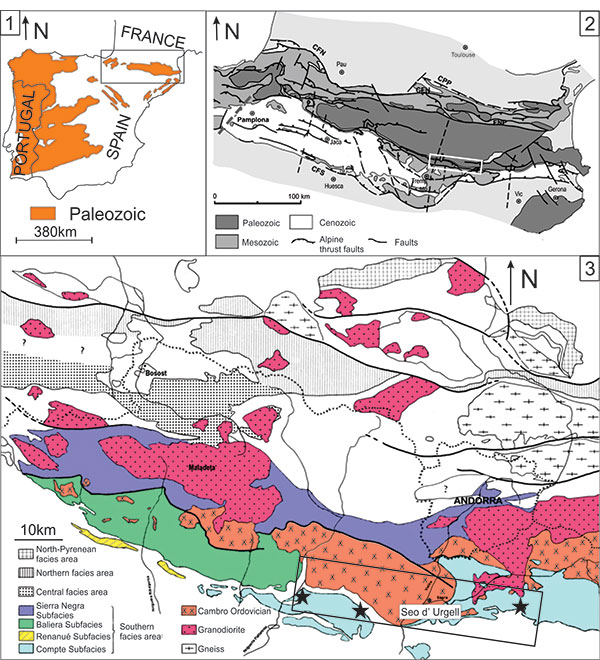
FIGURE 3. Graphic correlation between the Villech section and the composite standard for the Spanish Central Pyrenees (third round). The numbers represent the taxa listed in the range chart (Figure 5 and Figure 6), the error boxes indicate the sampling intervals. (sem./ lat.: semialternans/latifossatus).
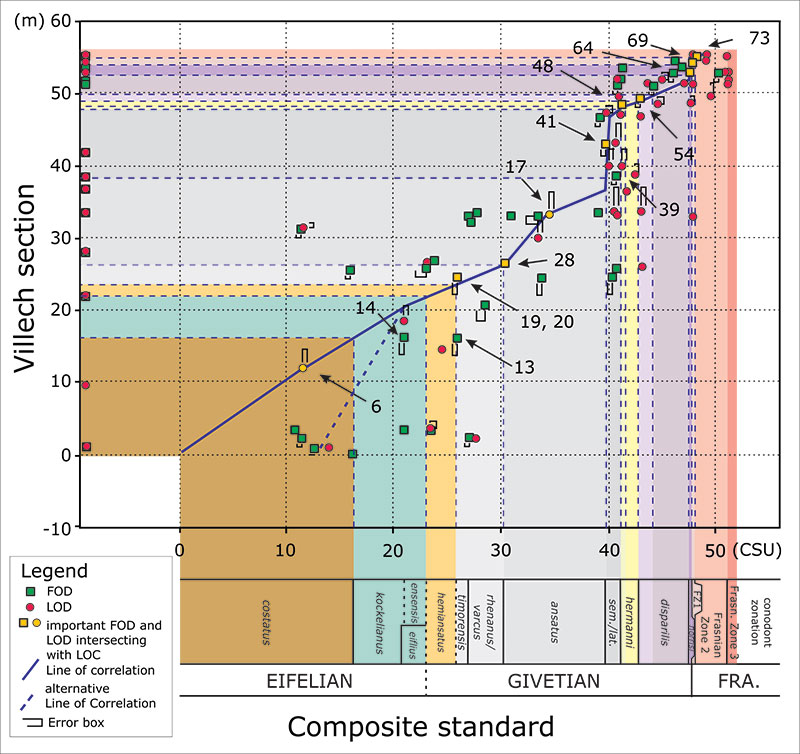
FIGURE 4. Graphic correlation between the La Guàrdia d’Ares section and the composite standard (third round). The numbers represent the taxa listed in the range chart (Figure 5 and Figure 6), error boxes indicate the sampling intervals.
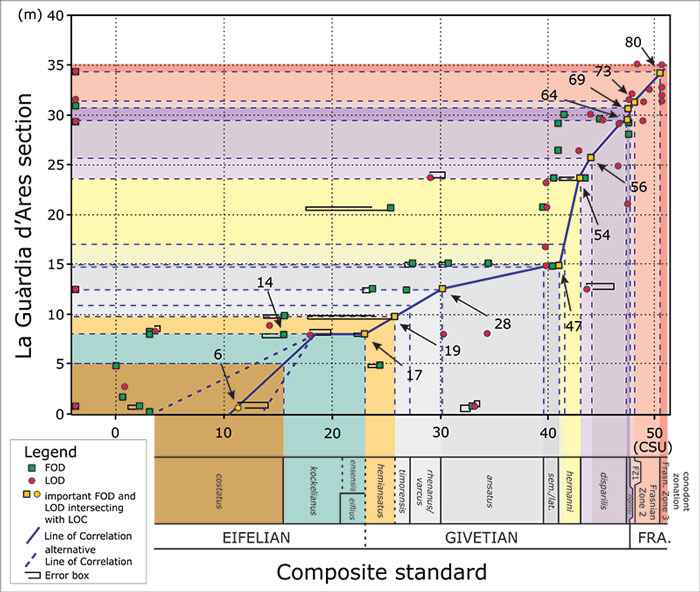
FIGURE 5. Conodont range chart based on the Spanish Central Pyrenean sections. Precise CSU values are given in the Appendix.
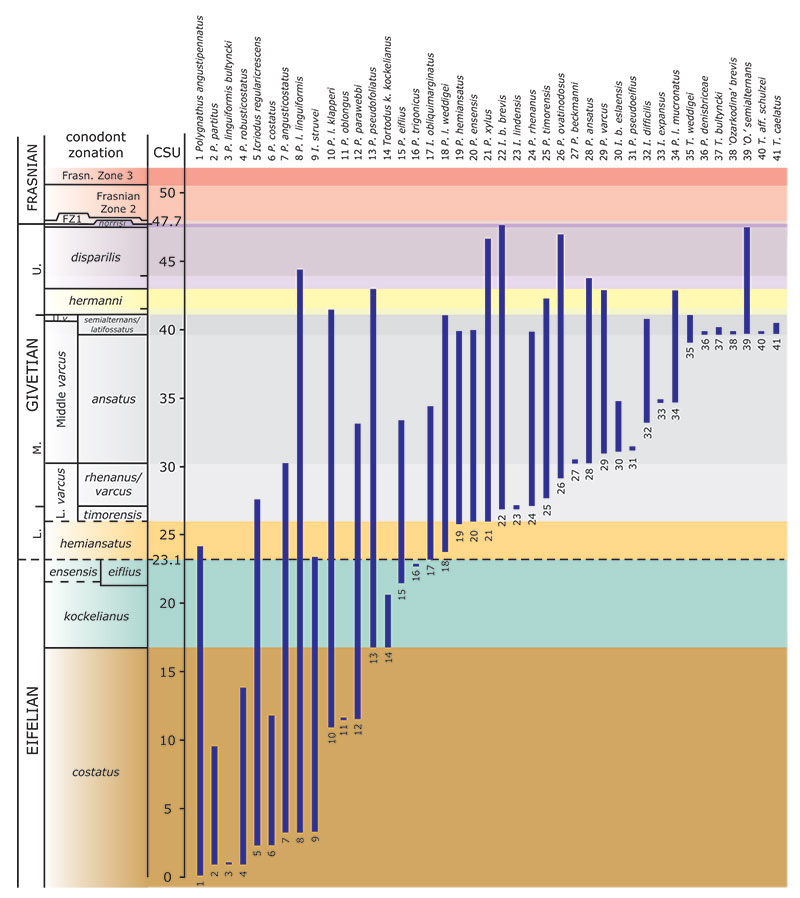
FIGURE 6. Conodont range chart based on the Spanish Central Pyrenean sections (continued). Precise CSU values are given in the Appendix.
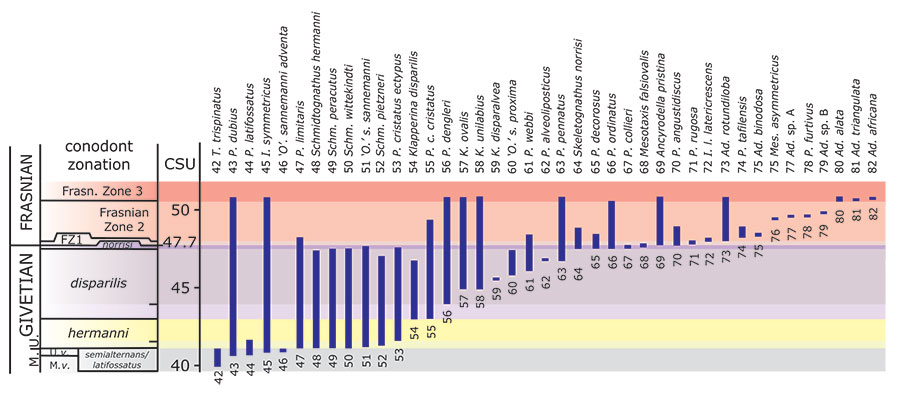
FIGURE 7. Correlation of the three sections based on the results of the graphic correlation method.
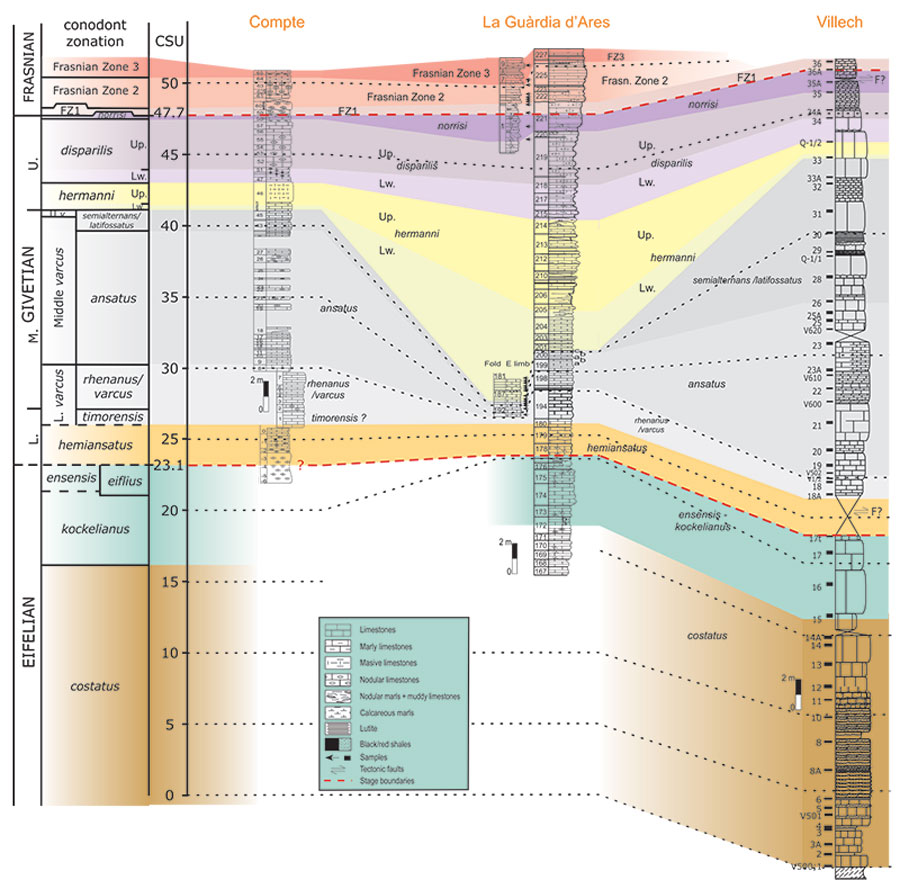
FIGURE 8. Graphic correlation of the three Compte subfacies area sections. The columns show the observed first occurrences of important taxa in the studied sections, indicated by their projected position on the Pyrenean CS. The numbers represent the taxa listed in the range chart (Figure 5 and Figure 6) and in the Appendix. (CSU: Composite Standard Unit).
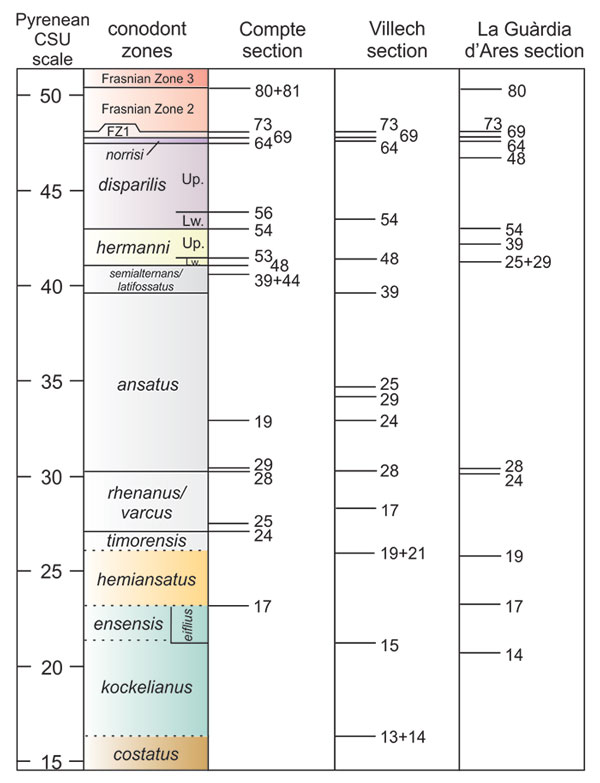
FIGURE 9. Correlation between the Pyrenean composite standard and the Middle Devonian composite standard. The numbers represent the taxa listed in the range chart (Figure 5 and Figure 6) and Appendix. See also legend in Figure 4.
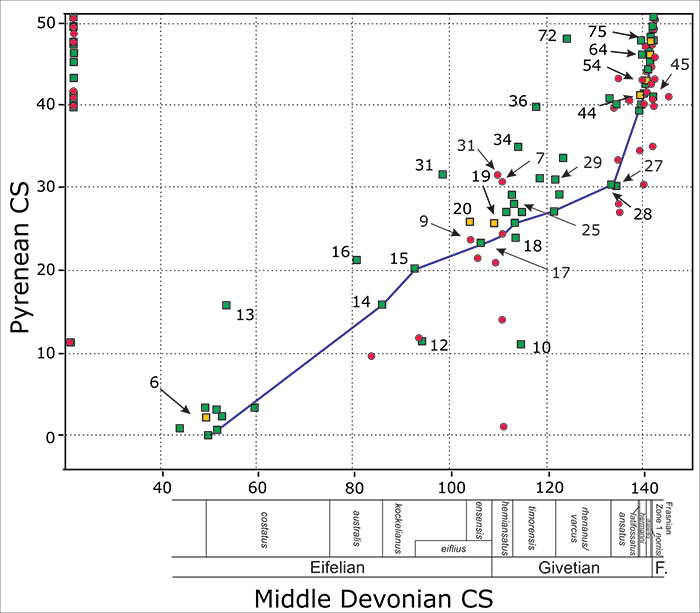
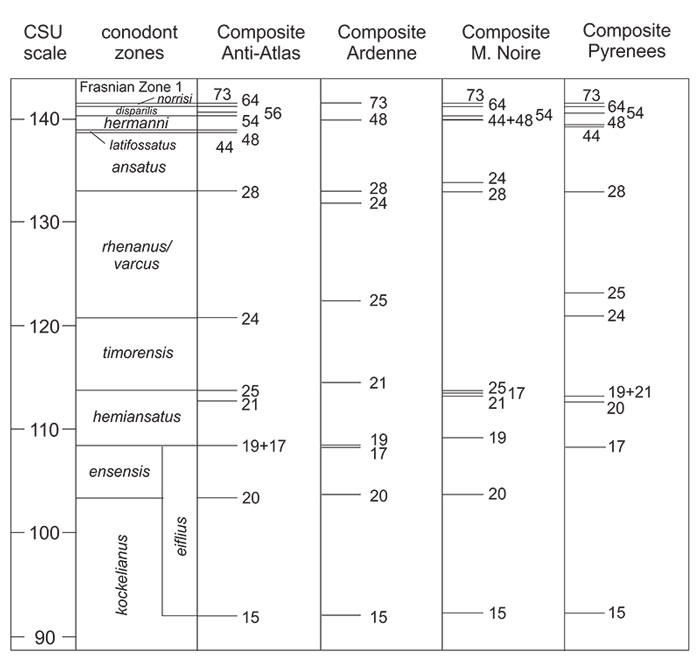
FIGURE 10. Graphic correlation of four composite standard (CS) databases, three from NW-Gondwana (Anti-Atlas, Pyrenees and Montagne Noire) and one from S-Laurussia (Ardenne) (Golonka, 2000). The standard reference section for the Middle Devonian CS and the Anti-Atlas CS is the Jebel Ou Driss section in the Eastern Anti-Atlas (Morocco) (Belka et al ., 1997). The standard reference sections for the Ardenne and Montagne Noire CSs are the Couvin-Givet section and the Pic de Vissou section, respectively. The columns show the observed first occurrences of important taxa in the regional CS’s, indicated by their projected position on the Middle Devonian CS. The numbers represent the taxa listed in the range chart (Figure 5-Figure 6) and in the Appendix.