FIGURE 1. Geological map of Kutch showing the major localities (solid squares) from where fossils of the Sivajiceratinae have been collected (modified after Dutta and Bardhan, 2016).
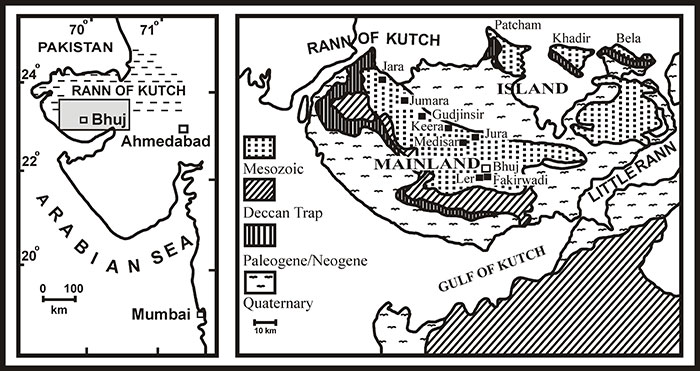
FIGURE 2. The stratigraphic distribution of the studied antidimorphic pairs under the subfamily Sivajiceratinae of Kutch. Biozonation after Jana et al. (2000, 2005); Bardhan et al. (2012).
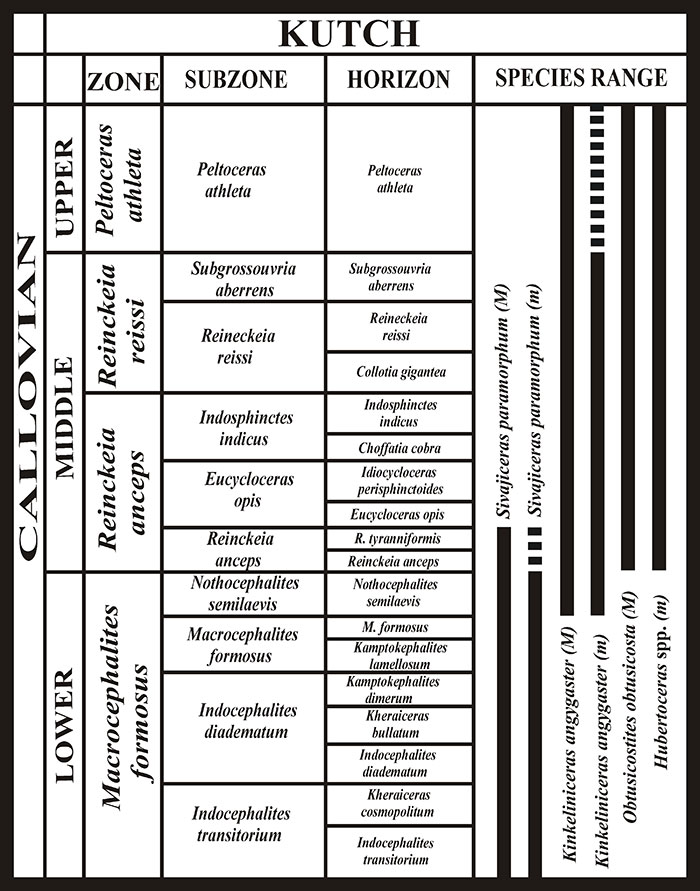
FIGURE 3. Representatives of Hubertoceras described by Spath (1931) from the Callovian of Kutch. 1-2. Holotype of Hubertoceras omphalodes (Waagen), GSI no. 2030, lateral and ventral views; ‘Perisphinctes anceps beds’ of Vanda (=middle Callovian anceps beds). 3-4. Holotype of H. dhosaence (Waagen), GSI no. 2035, lateral and apertural views; ‘Perisphinctes anceps bed’ of Keera (=beds nos. 5-7 of middle Callovian). 5. Holotype of H. hubertus Spath; NHMUK no. C7686, lateral view. 6-7. H. hubertus var. densicostata, GSI no. 16098, lateral and apertural views; ?anceps beds of unknown locality. 8. H? sp. nov.; GSI no. 16099, lateral view; athleta beds of Fakirwadi (=athleta beds of upper Callovian). 9. Holotype of H. arcicosta, GSI no. 2099, lateral view; ‘Golden Oolite’ of Keera (=bed no. 2 of lower Callovian). 10. Holotype of H. mutans; GSI no. 2037, lateral view; ‘Katrol group’ of North Gudjinsir. Beds are following Jana et al. (2000, 2005). Commencement of body chamber and presence of lappets are indicated by ‘x’ and arrows respectively. GSI=Geological Survey of India, NHMUK=Natural History Museum, U.K. Scale bar equals 20 mm.
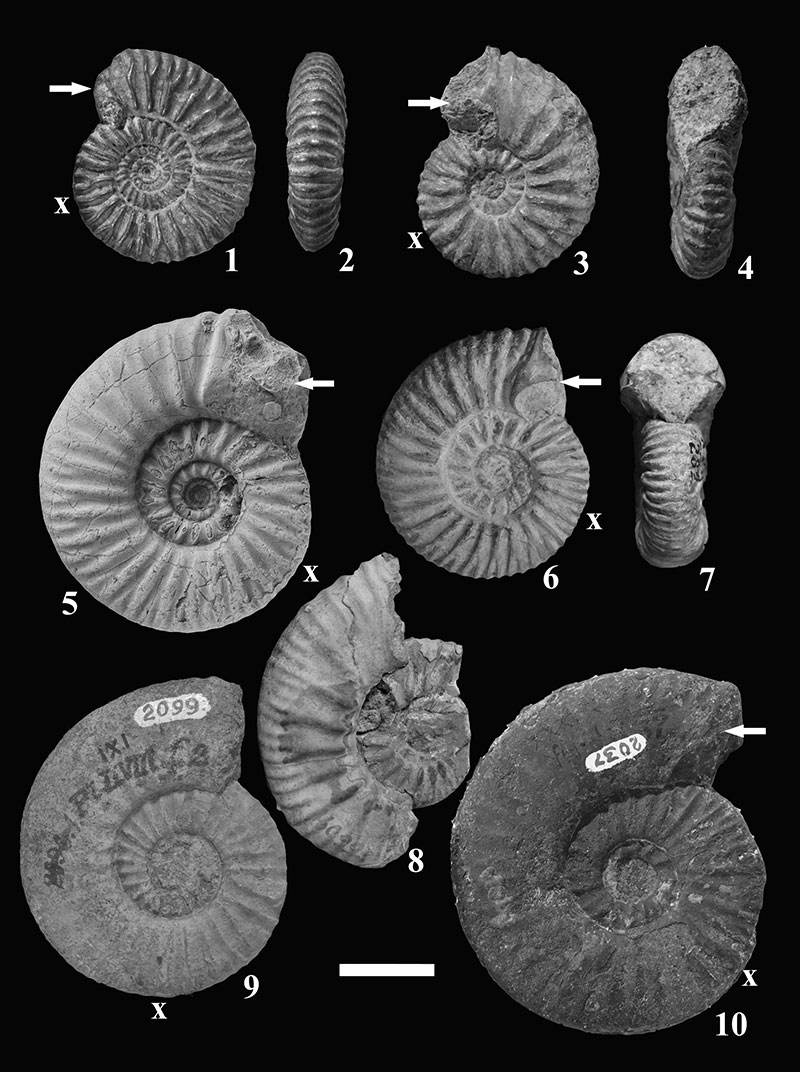
FIGURE 4. Different sexual dimorphic ammonites (non-Sivajiceratinae) contemporary to Hubertoceras during the middle Callovian in Kutch. Sexual Dimorphism among these species is well established and the pairs have been shown to be connected by large arrows. 1-2. Reineckia anceps (M, JUM/R/90, bed 6, middle Callovian of Keera and m, JUM/R/44, bed 9, middle Callovian of Jumara, respectively). 3-4.Choffatia cobra (M, JUM 33, bed 7, lower Callovian of Jumara and m, JUM 38, bed 7, lower Callovian of Jumara respectively). 5-6.Idiocycloceras perisphinctoides (M, JUM 450, bed 8, middle Callovian of Jura and m, JUM 270, bed 6, middle Callovian of Keera respectively). 7. J Indosphinctes sp. (M, JUM/IS/01, bed 11, middle Callovian of Jumara). Beds are following Jana et al. (2000, 2005). Note that microconch of Indosphinctes is still unknown. ‘x’ indicates the end of phragmocone. Small arrow indicates presence of lappets. Scale bar equals 20 mm. The sources are: Jana et al., 2005; Kayal, 2009; Bardhan et al., 2012, Dutta and Bardhan, 2016.
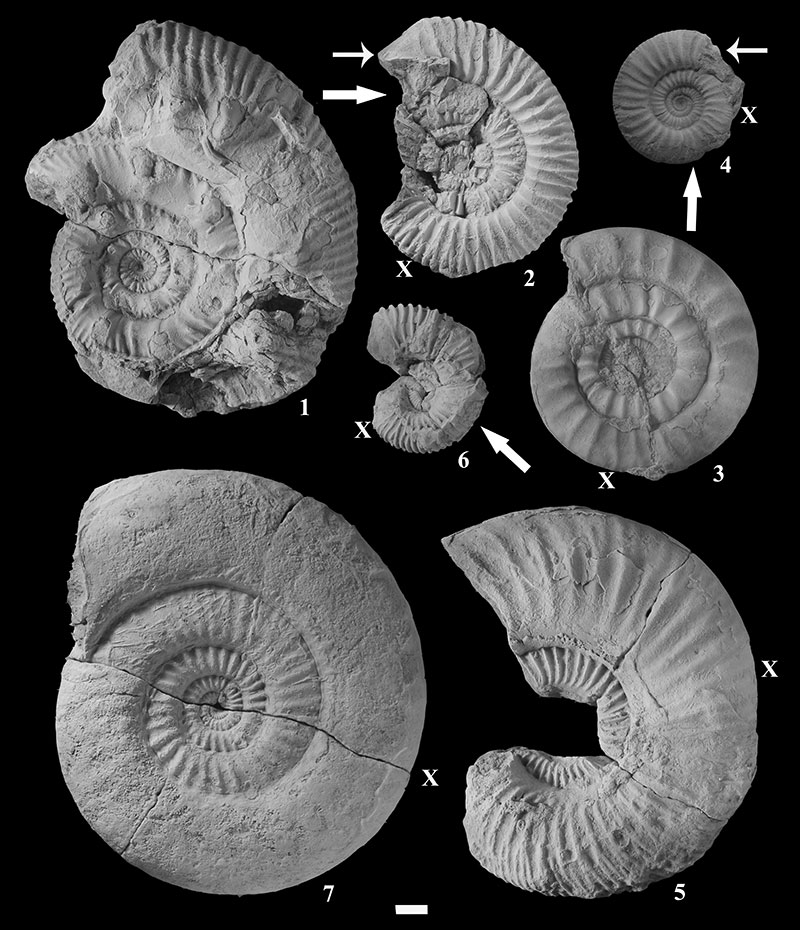
FIGURE 5. Supposed antidimorphic pairs within the subfamily Sivajiceratinae. 1-2. Sivajiceras paramorphum (M, JUM /SP/2, bed 7, lower Callovian of Jumara and m, JUM/SP/22, bed 2, lower Callovian of Keera). 3-4. Kinkeliniceras angygaster (M. JUM/KA/1, locality/stratigraphy unknown; m. JUM/KA/5, Medisar, Jura). 5-6. Obtusicostites obtusicosta (M, JUM/OO/1, bed 11, middle Callovian of Jumara and m, JUM/OO/14, locality/stratigraphy unknown). 'x' indicates the end of phragmocone. Small arrow indicates the presence of lappets. Scale bars=20 mm. The sources are: Jana et al. (2000, 2005) for stratigraphic information and Dutta and Bardhan (2016) for taxonomy.
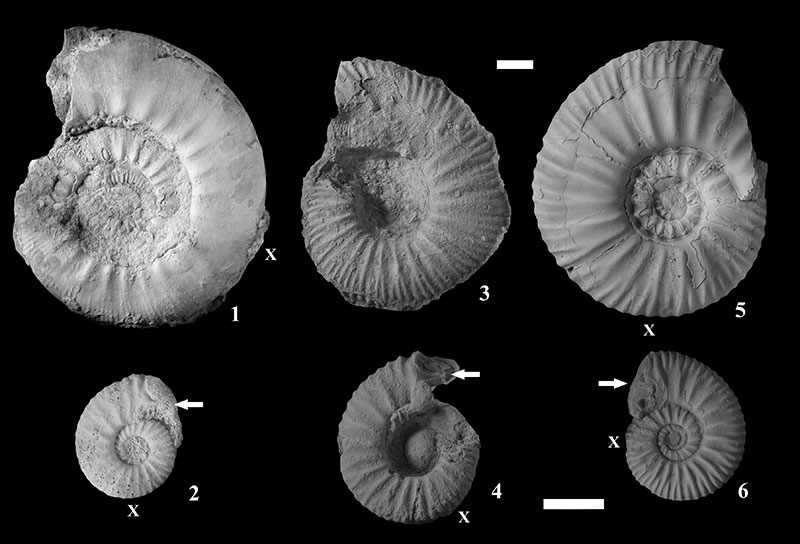
FIGURE 6. Bivariate growth graphs between Hubertocerasomphalodes and macroconchs of all contemporary (middle Callovian) species of different genera i.e., Reineckia anceps, Choffatia cobra, Idiocycloceras perisphinctoides and Indosphinctes sp. Cluster of morphological characters of Hubertoceras are separated from those of other genera. D=Diameter of the shell, U=Umbilical diameter, W=Width of the whorl and H=Height of the whorl. Measurements are taken at different ontogenetic stages of the specimens to accommodate intraspecific range of variability of each species. Photos are not to scale.
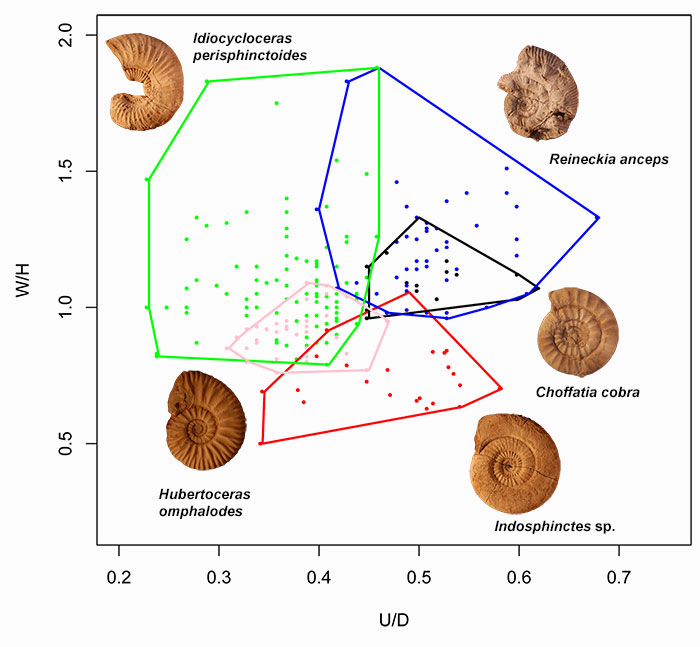
FIGURE 7. Bivariate growth graphs between Hubertocerasomphalodes and macroconchs of the subfamily Sivajiceratinae. Maximum homogeneity of points is shown between Obtusicostites obtusicosta and Hubertoceras omphalodes. D=Diameter of the shell, U=Umbilical diameter, W=Width of the whorl and H=Height of the whorl. Measurements are taken at different ontogenetic stages of the specimens to accommodate intraspecific range of variability of each species. Photos are not to scale.
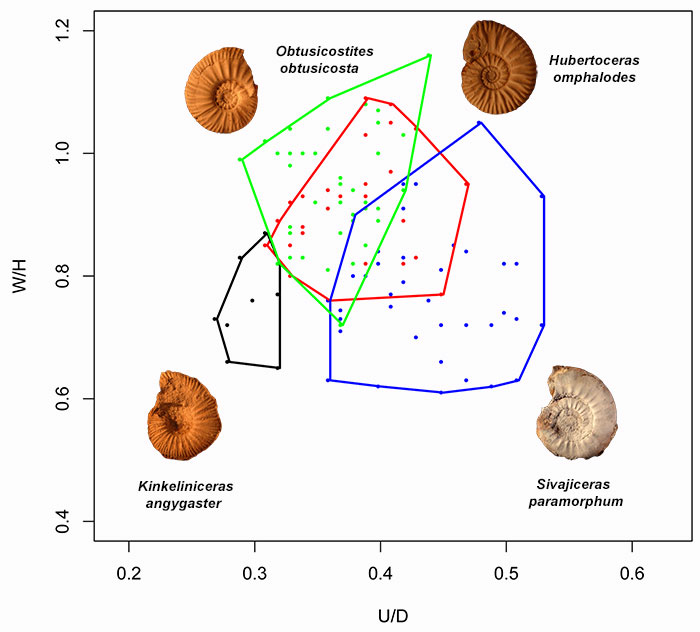
FIGURE 8. Transverse sections (body chamber hatched) of adult shells. 1.Obtusicostites obtusicosta (M). 2.Hubertoceras omphalodes (m). Note, for 1 and 2, overall similarity of whorl sections and depressed inner whorls with rounded umbilical edge. Septal sutural patterns. 3. Obtusicostites obtusicosta (M) at diameter 150 mm, redrawn from Waagen (1875, plate 38, figure 2). 4.Hubertoceras omphalodes (m) at diameter 48 mm, redrawn from Waagen (1875, plate 38, figure 4c). Scale bar equals 20 mm.
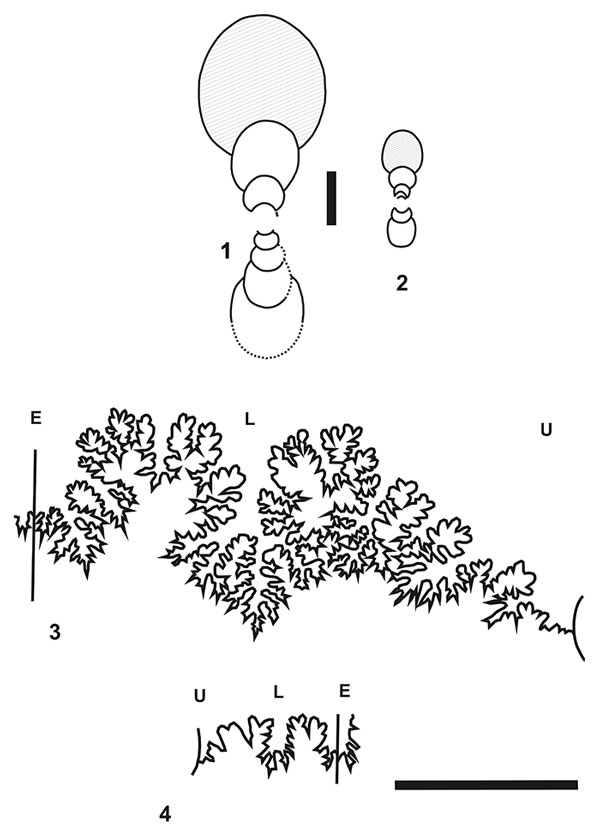
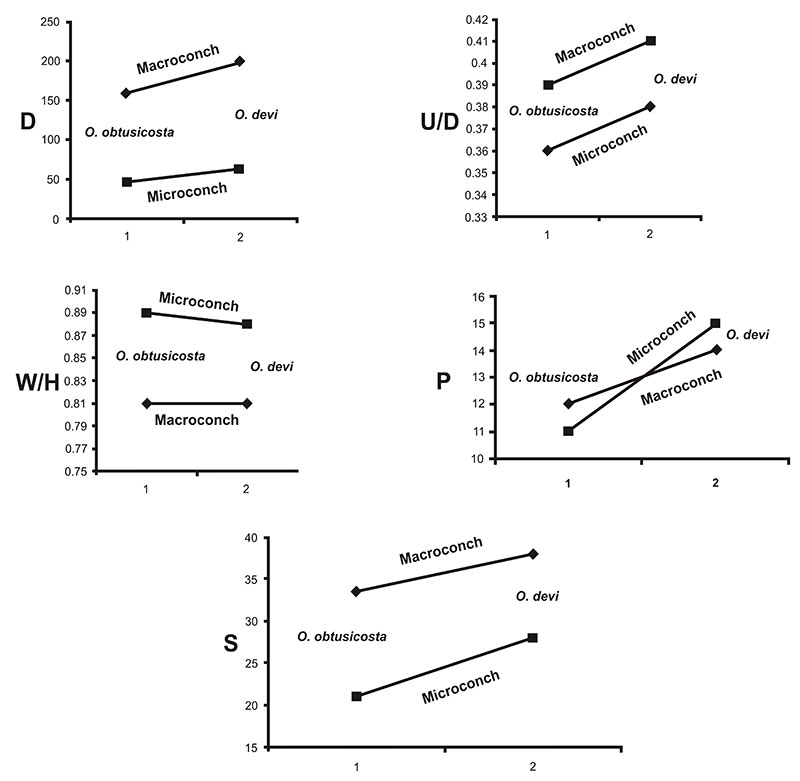
FIGURE 9. Parallel evolution of median values of different morphological characters for three successive genera (including M and m) within Sivajiceratinae is plotted. Note that both M and m within the lineage show parallel evolutionary trends. D, U, W, and H are the same as in Figure 4. P= Primary rib (per half whorl) and S= Secondary rib (per half whorl). The dark horizontal line in the middle of the each box represents the median values, top frame of the box represents 75th percentile, bottom frame of the box represents 25th percentile and the bars at the end of vertical lines represent the minimum and the maximum data values without outliers (open circles). Sources are: Waagen, 1875; Spath, 1931; Collignon, 1958; Dutta and Bardhan, 2016.
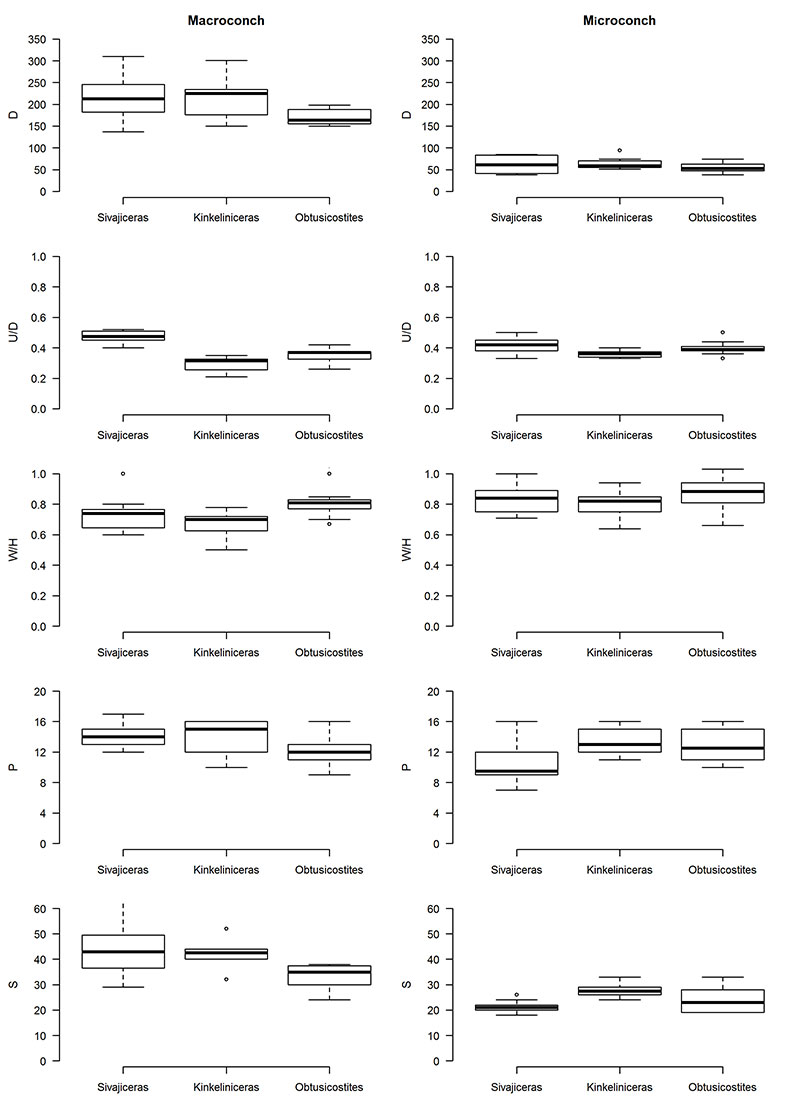
FIGURE 10. Parallel evolution of the species level for the genus Sivajiceras is plotted. Note that both M and m within the lineage show parallel evolutionary trends. Sources are: Waagen, 1875; Spath, 1931; Collignon, 1958; Callomon, 1993; Dutta and Bardhan, 2016.
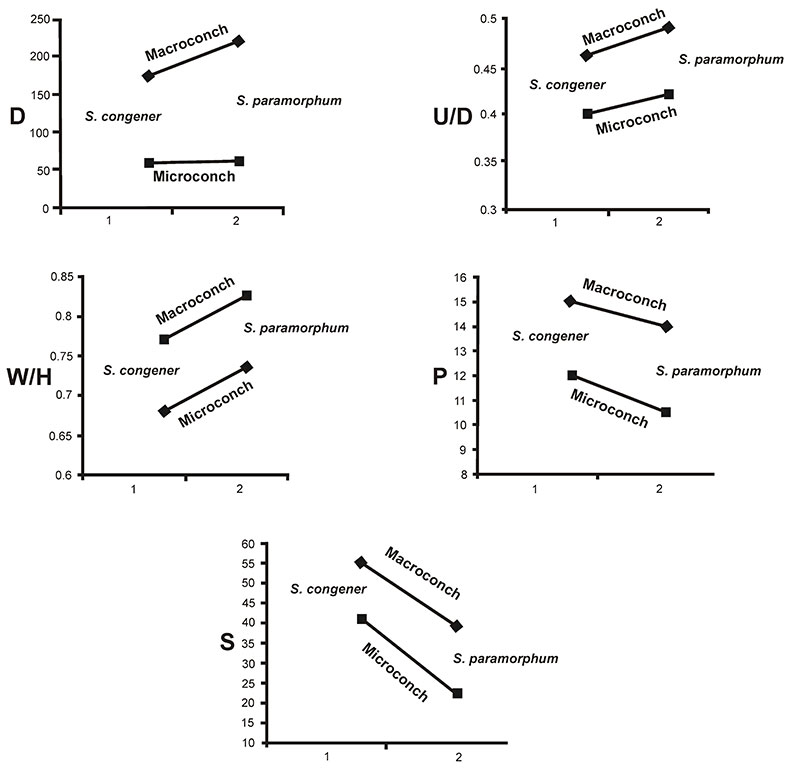
FIGURE 11. Parallel evolution of the species level for the genus Obtusicostites is plotted. Note that both M and m within the lineage show parallel evolutionary trends. Sources are: same as in Figure 10.