FIGURE 1. How to calculate pEPI and EPI from a phylogenetic tree. Numbers above the branches are estimated change scores. Clades A and B are sisters; their performance scores depend on each other. Contrasted change (Cc) is calculated as the mean change score for a clade divided by its sister’s. Contrasted success (Sc) is calculated as the number of species in a clade divided by its sister’s. Time (T) is the amount of time in MY since the clade first appeared. EPI and pEPI are then calculated using equations 1 and 2.
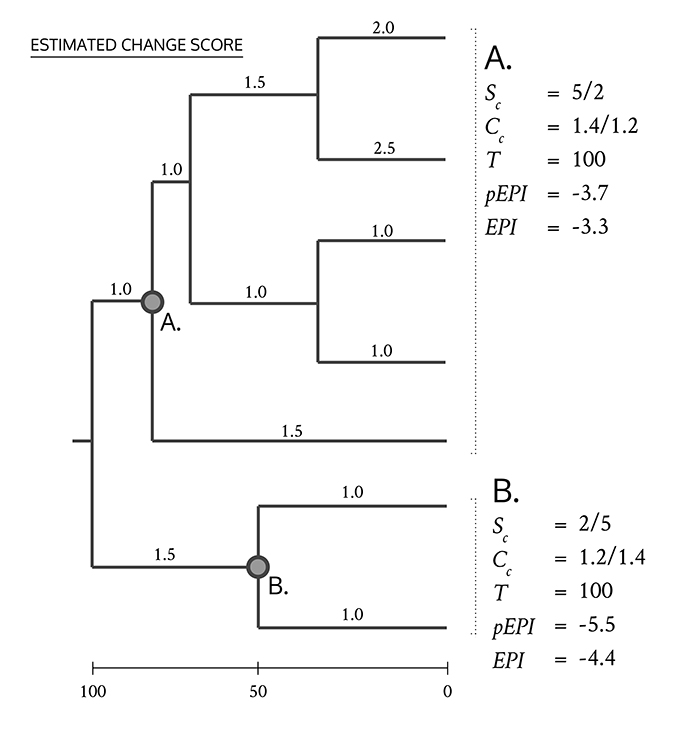
FIGURE 2. (1) pEPI and EPI show a strong correlation. Evolutionary distinctness (ED) when logged shows strong correlations with both EPI (2) and pEPI (3).
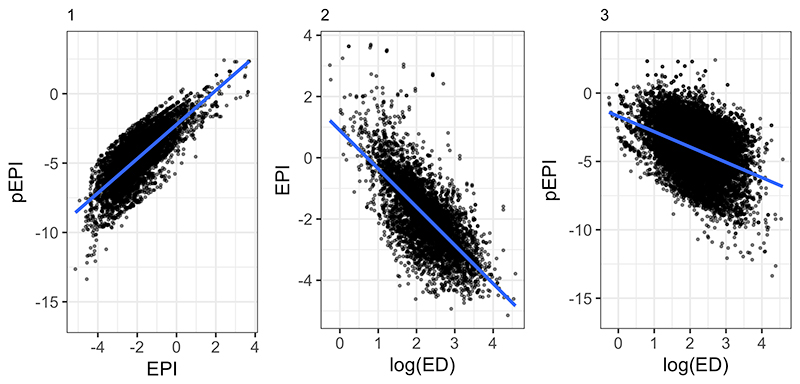
FIGURE 3. Dispersion increases as a clade’s time since splitting increases for both success (1) and change (2). Living fossil clades are found towards the bottom-right, clades that have likely experienced an adaptive radiation aggregate in the top-right.
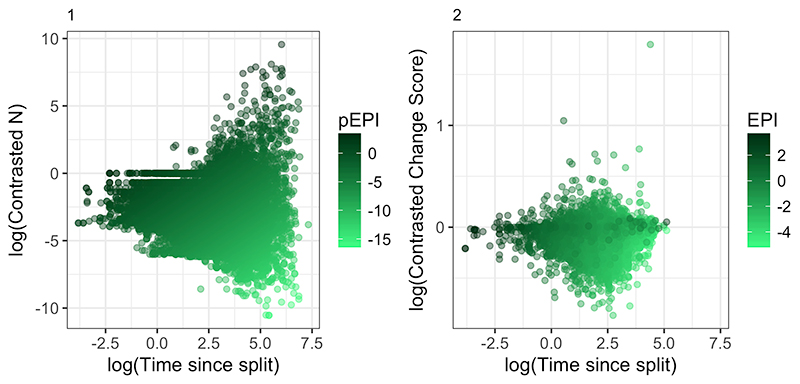
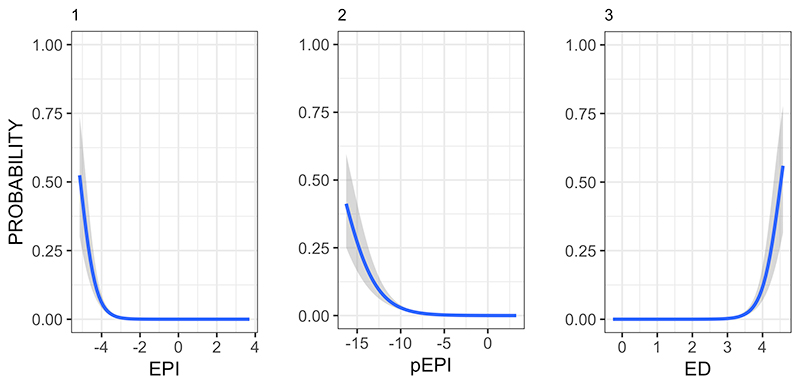
FIGURE 4. Probability of the Wikipedia article for a clade containing the phrase “living fossil(s)” against different scores for EPI (1), pEPI (2) and ED (3).