FIGURE 1. Maps and photograph of the study site (MS.18.001). 2, Index maps showing the outline of the state of Mississippi and the location of the site (MS. 18.001). 3, Field photograph looking north downstream showing the Bouie River cutting through the Hattiesburg Formation.
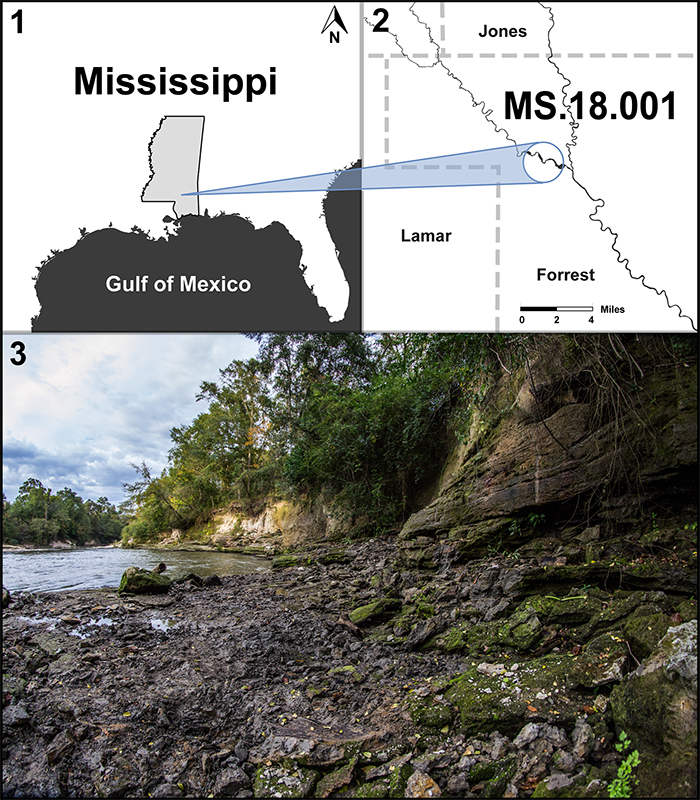
FIGURE 2. Structural cross section and stratigraphic position. 1, Structural cross section data showing the uppermost Oligocene at the top of the Heterostegina Limestone. The section above that unit is attributed to the Miocene. 2, Corresponding map of A to A´ well sites close to the study site (MS. 18.001).
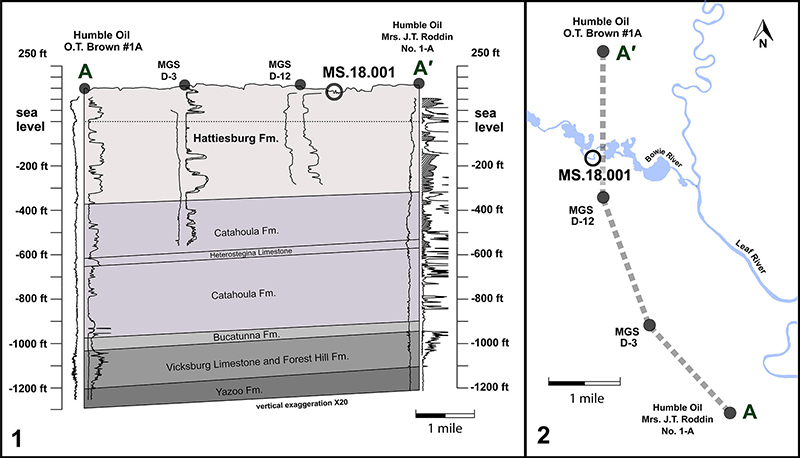
FIGURE 3. Select portion (uppermost Eocene through Holocene) of the stratigraphic units of Mississippi adapted from Dockery (1996). The Hattiesburg Formation is indicated in boldface. Data presented in this paper suggests a slightly older age (middle Miocene) for the upper part of the Hattiesburg Formation (see text for details).
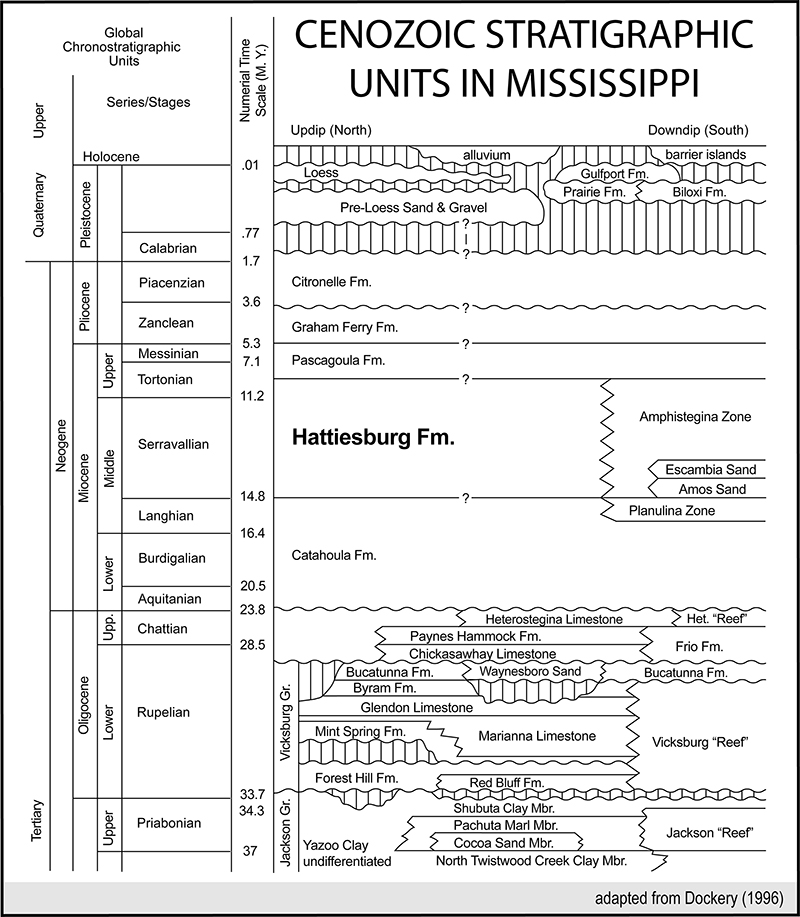
FIGURE 4. Representative ferns from families Osmundaceae, Blechnaceae, and Salviniaceae. 1, Osmunda sp. indet. cf. spectabilis (MMNS PB-82) with arrow indicating partial petiolule, scale bar equals 1 cm. 2, Close-up of rectangle indicated in Figure 4.1 showing fairly parallel secondary veins that branch occasionally, scale bar equals 1 mm. 3, Woodwardia sp. indet. cf. virginica frond (MMNS PB-83), scale bar equals 5 mm. 4, Reconstruction of fossil Woodwardia venation (from MMNS PB-83), scale bar equals 5 mm. 5, Salvinia sp. leaf showing venation (MMNS PB-84), scale bar equals 1 mm. 6, Salvinia sp. SEM of partial sporocarp contents showing microsporangia (left arrow) and megasporangia (right arrow) (MMNS PB-85), scale bar equals 0.5 mm. 7, Salvinia sp. (MMNS PB-86), entire plant with attached sporocarp (with typical yellow-orange coloration), scale bar equals 1 mm.
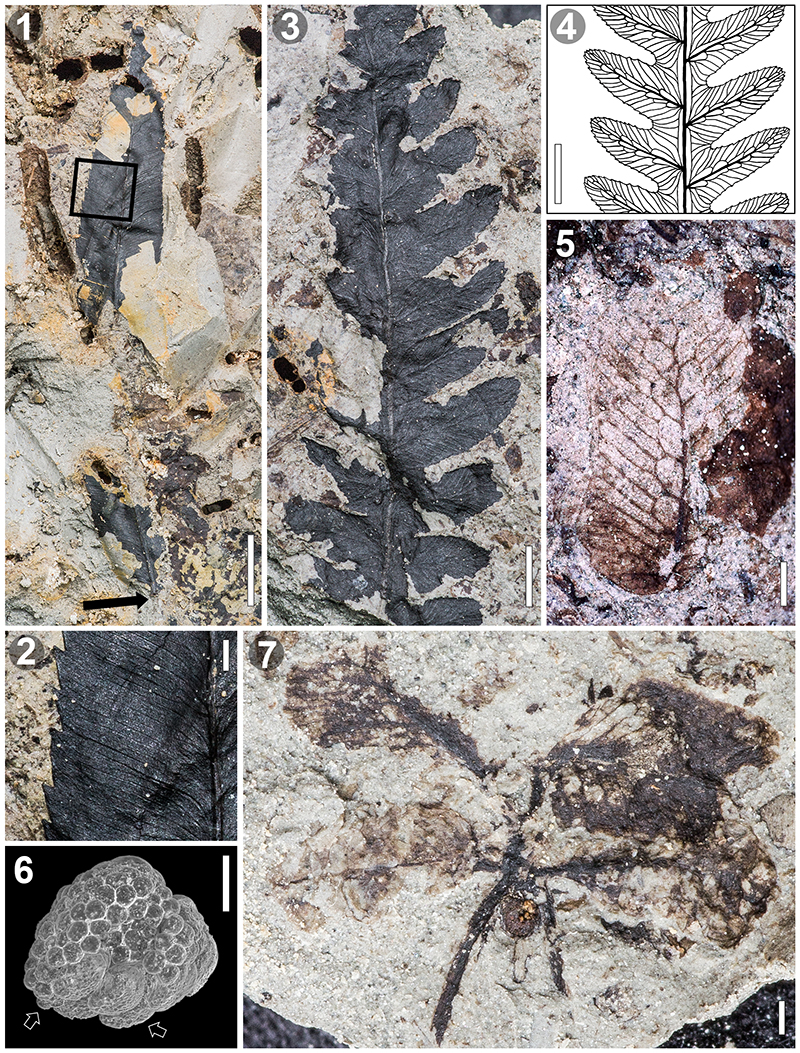
FIGURE 5. Representatives of gymnosperm family Cupressaceae and angiosperm families Lauraceae, Adoxaceae, and Fabaceae. 1, Taxodium sp. branchlet (MMNS PB-87.1), scale bar equals 5 mm. 2, Taxodium sp. lower cuticle showing stomata (MMNS PB-87.2), scale bar equals 0.05 mm. 3, Lauraceae gen. et sp. indet. cf. Persea sp. nearly complete leaf (MMNS PB-88.1), scale bar equals 1 cm. 4, Partial lamina extracted and cleared (MMNS PB-88.2) from the same fossil in Figure 5.3 with extraction area indicated by rectangle, scale bar equals 2 mm. 5, Cuticle from the same fossil as in Figure 5.3 showing paracytic stomatal complexes indicated by arrows (MMNS PB-88.3), scale bar equals 0.05 mm. 6, Reconstruction of venation features of the fossil in Figure 5.3. 7, Oil bodies from the same fossil as in Figure 5.3 (MMNS PB-88.4), scale bar equals 2 mm. 8, Sambucus sp. nearly complete leaflet (MMNS PB-89), scale bar 1 cm. 9, Sambucus sp. partial lamina, venation close-up (MMNS PB-90), scale bar equals 5 mm. 10, Sambucus sp. partial lamina, close-up of marginal teeth (MMNS PB-91), scale bar equals 1 mm. 11, Cercis sp. partial leafwith pulvinus indicated with an arrow (MMNS PB-92), scale bar equals 5 mm. 12, Close-up rectangle in Figure 5.11 showing impressions of higher order venation, scale bar equals 1 mm.
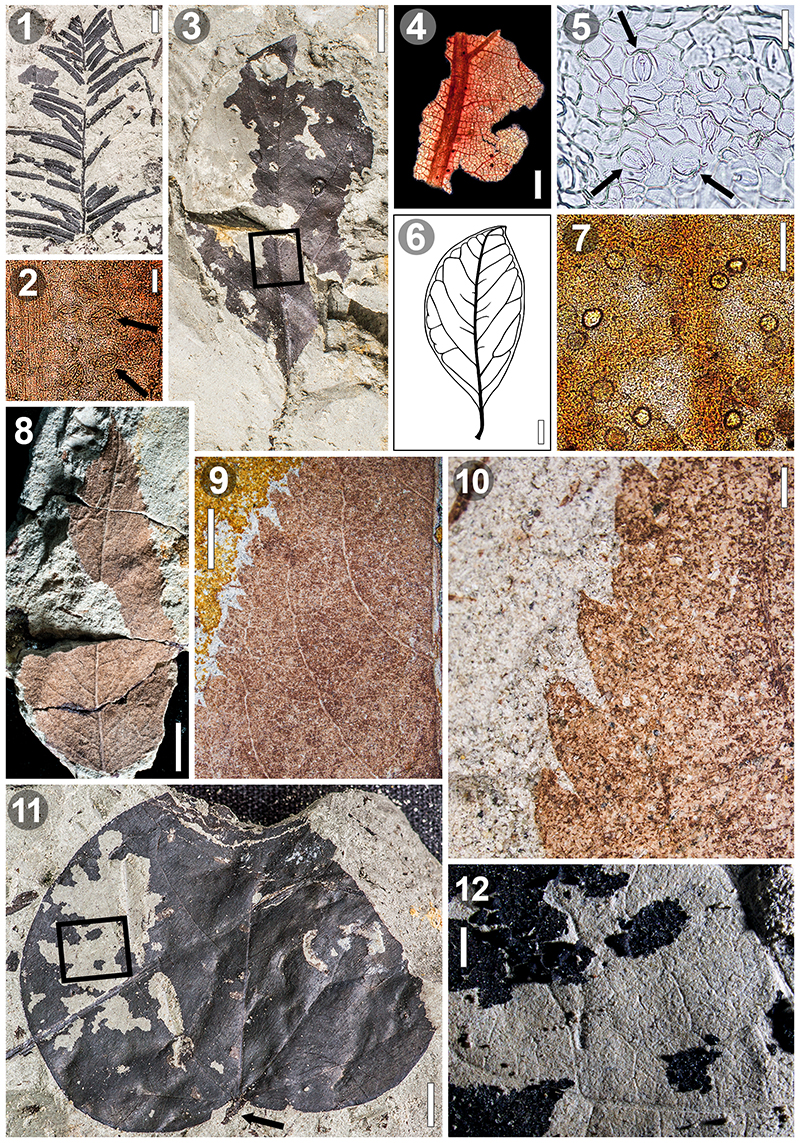
FIGURE 6. Representatives of angiosperm families Fagaceae, Juglandaceae, Lardizabalaceae, and Moraceae. 1, Quercus section Lobatae leaf (MMNS PB-93), scale bar equals 5 mm. 2, Quercus section Quercus leaf (MMNS PB-94), scale bar equals 5 mm. 3, Two Quercus section Quercus leaves attached to stem (MMNS PB-95), scale bar equals 5 mm. 4, Juglans sp. complete nut with preserved kernel visible inside (MMNS PB-96), scale bar equals 5 mm. 5, Carya sp. 1 complete nut (MMNS PB-98), scale bar equals 5 mm. 6, Carya sp. 2 complete nut (MMNS PB-97), scale bar equals 5 mm. 7, Sargentodoxa sp. complete seed from two angles (MMNS PB-99), scale bar equals 5 mm. 8, Morus sp. nearly complete leaf (MMNS PB-100), scale bar equals 5 mm.
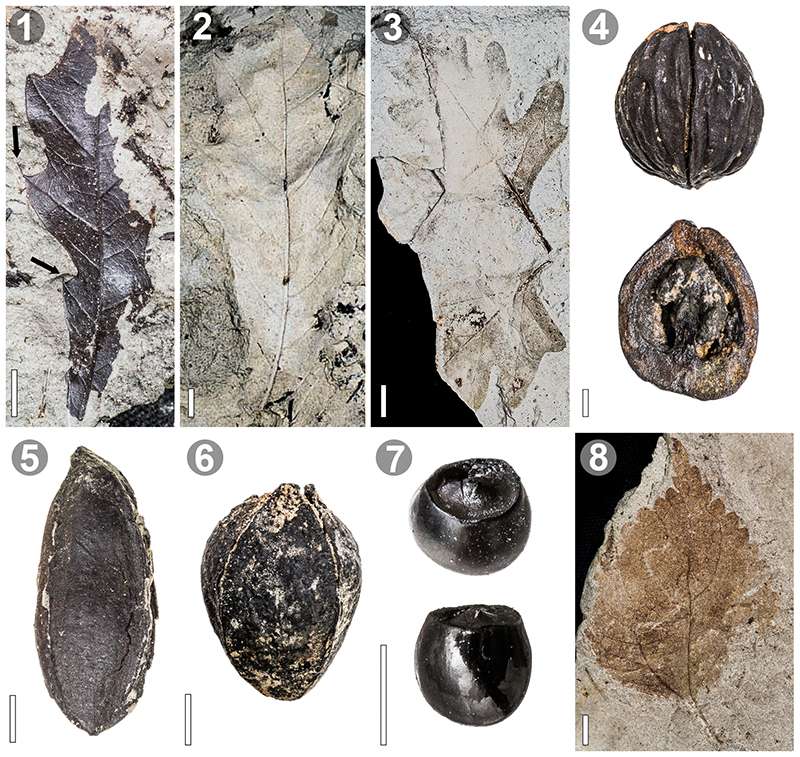
FIGURE 7. Representatives of angiosperm families Platanaceae and Salicaceae. 1, Platanus sp. nearly complete leaf (MMNS PB-101), scale bar equals 1 cm. 2, Platanus sp. stipule (MMNS PB-102), scale bar equals 5 mm. 3, Platanus sp. fruit section (MMNS PB-103), scale bar equals 1 mm. 4, Populus sp. indet. cf. deltoides partial leaf (MMNS PB-104), scale bar equals 5 mm. 5, Close-up of rectangle in Figure 7.4 showing teeth, scale bar equals 1 mm. 6, Salix sp. partial lamina (MMNS PB-105.1), scale bar equals 1 cm. 7, Lower cuticle fragment of the same fossil (MMNS PB-105.2), scale bar equals 0.02 mm. 8, Close-up of Figure 7.6 (smaller) rectangle showing teeth, scale bar equals 1 mm. 9, Close-up of Figure 7.6 (larger) rectangle showing venation, scale bar equals 1 mm.
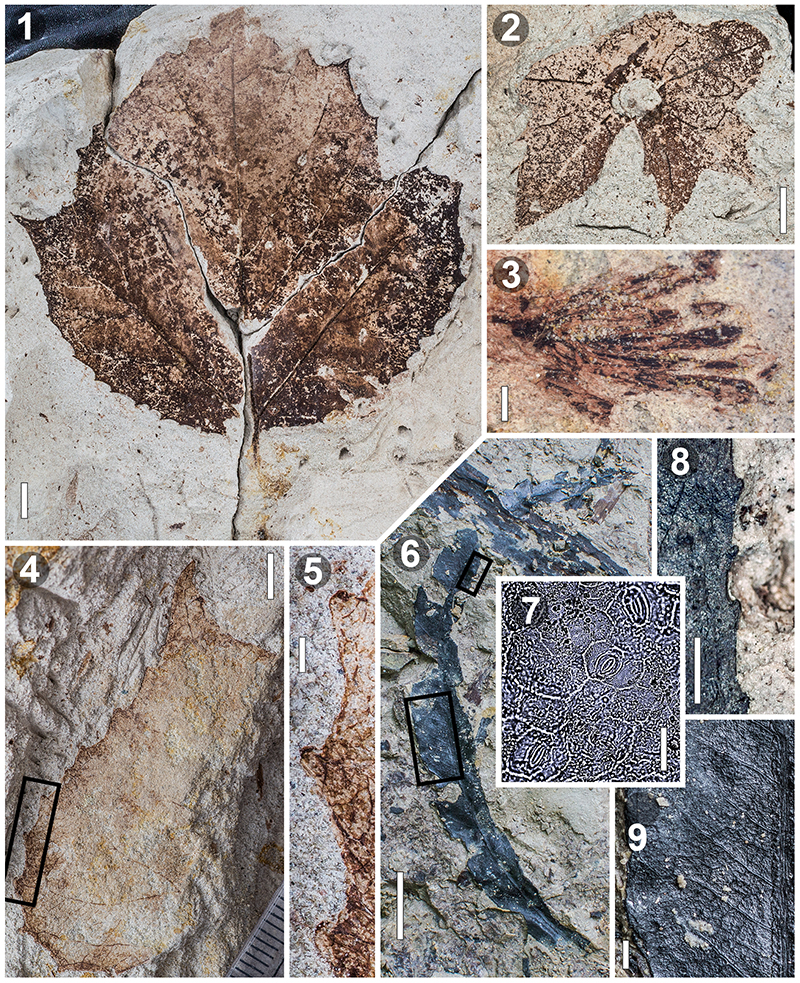
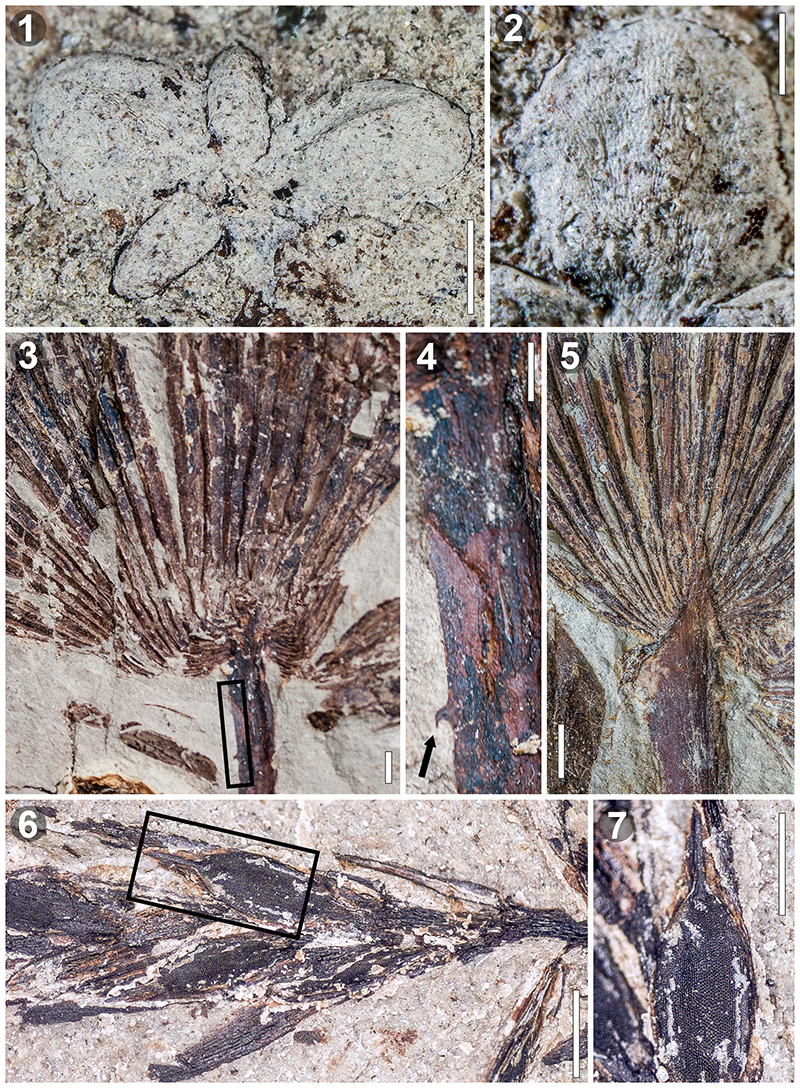
FIGURE 8. Representative monocot families Lemnaceae, Arecaceae, and Cyperaceae. 1, Lemna sp. multiple fronds (MMNS PB-106), scale bar equals 1 mm. 2, Close-up of Figure 8.1 showing detail of single frond. 3, Palmacites sp. showing partial leaf with palmate venation (MMNS PB-107), scale bar equals 1 cm. 4, Close up Figure 8.3 showing tooth on petiole, scale bar equals 5 mm. 5, Sabalities sp. showing partial leaf with costapalmate venation (MMNS PB-108), scale bar equals 1 cm. 6, Cyperus sp. with multiple achenes (MMNS PB-109), scale bar equals 1.0 mm. 7, Close-up of Figure 6.1 showing detail of the achene, scale bar equals 0.5 mm.