FIGURE 1. Geographic location of the different sampling sites where N. pseudocolumellata has been found in Morocco. 1, General location of the studied areas in the Atlas Mountains (orange zone); 2, Guigou plateau; 3, Amellagou municipality; 4, Dades Valley.
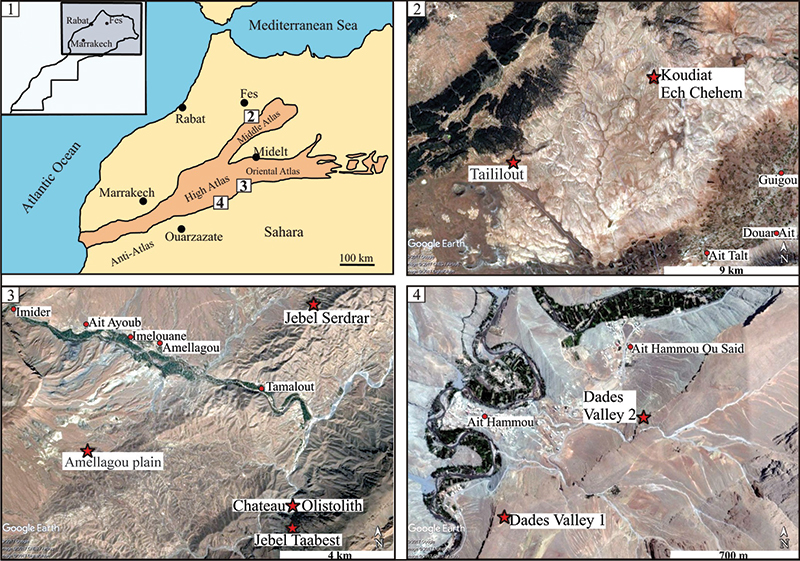
FIGURE 2. Examples of CT scan images provided by nanotom S phoenix 180 kV analysis on sample A57331-1. The slices through the coral presented in 1 and 3 are perpendicular to each other and parallel to their corresponding plan materialized by white dotted lines in 2. The annotated graduations in 2 are centimeters.
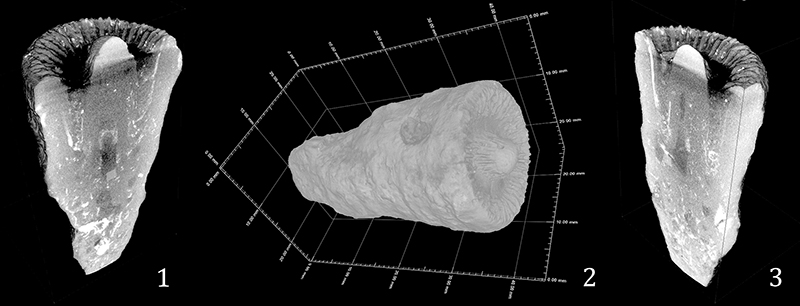
FIGURE 3. Photographs of Neorylstonia pseudocolumellata. 1, Transverse section of the sample AM16164-2 showing a type 2 pseudocolumella with visible pseudocolumellar septa. 2, Transverse section of sample AM175 showing a type 1 pseudocolumella. 3, Transverse section in sample DA2905E1.1 showing the true epitheca surrounding the septal apparatus and the stereome deposits on septa. 4, Detail of the ghosts of septal structure in transverse section (sample 2110A2) and the stereome deposits in “ogives” or “glove fingers”. 5, Longitudinal section of sample A57331-2 showing the endothecal organization in tabular dissepiments and the axial porosity of the pseudocolumella. 6, Detail of the parathecal wall in continuity with the tabular dissepiments (longitudinal section of sample 2110A2).
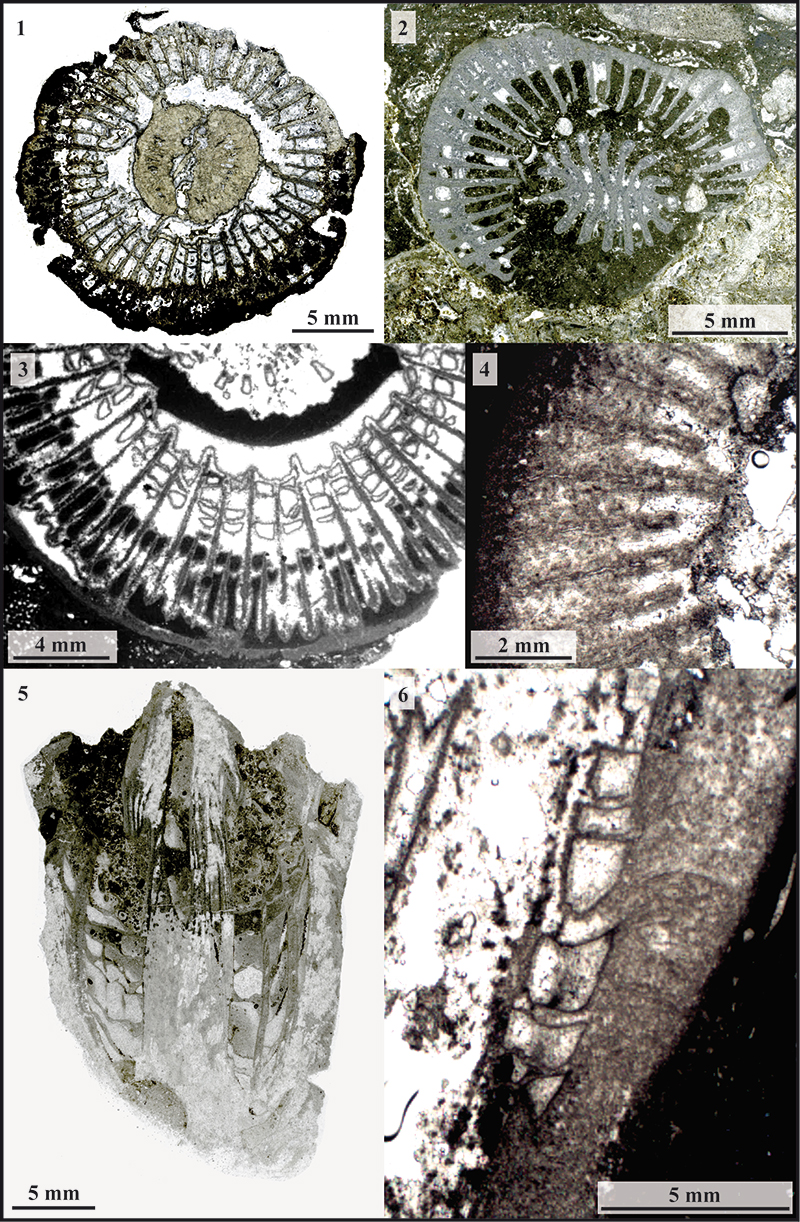
FIGURE 4. Model of septal insertion based on the sample A57331-1. 1, Septal organization of the sample A57331-1. 2, Geometrical interpretation of the septal apparatus of the sample. 3, Detail of one of the six systems of the corallite including the five supposed ontogenetic cycles. In most samples these ontogenetic cycles are inferred from morphology by the three distinct size orders: size order 1 includes cycles 1, 2 and 3; order 2 includes cycle 4 and order 3 includes cycle 5. In very few samples only, ontogenetic cycles 1, 2 and 3 can be differentiated.
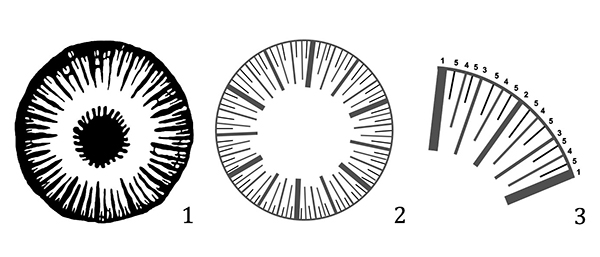
FIGURE 5. Schematic representations of the different shapes of pseudocolumella observed among the samples (1-12) or in one single sample, from the base to the top (13-18). Shapes 1, 2, 3, 4, 5, 17 and 18 correspond to type 1 morphology and shapes 6, 7, 8, 9, 10, 11, 12, 13, 14, 15 and 16 correspond to the type 2 morphology.
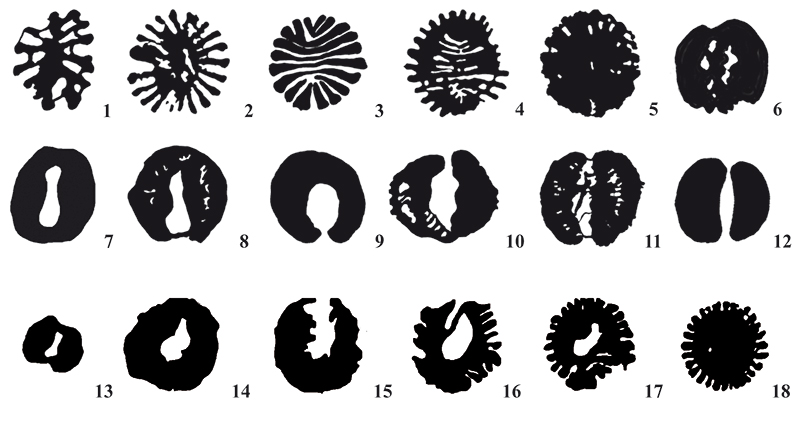
FIGURE 6. Plate of photographs of Neorylstonia pseudocolumellata focusing on the pseudocolumella structure. 1, Transverse section of the sample AM16164-1, showing a type 2 pseudocolumella with visible pseudocolumellar septa. 2, Longitudinal section of the type 2 pseudocolumella AM16164-1. Note the regular tabulae in the axial porosity and the way it sustains new lamellae (arrow). 3, Transverse section of the sample 2303A7, showing a type 1 pseudocolumella with curved lamellae connected following a bilateral plan of symmetry. An incomplete stereome deposit can be observed around the pseudocolumella (arrow). 4, Transverse section of the sample AM175, showing a type 1 pseudocolumella with curved lamellae connected following a bilateral plan of symmetry. A complete stereome deposit separate the pseudocolumella lamellae from the lumen (arrow). 5, Transverse polished section of the sample AM16160 with a type 2 pseudocolumella with crescents connected by endothecal structures. Note the radiant structure into the crescents made of lamellae (arrow) attenuated at their periphery by the stereome deposits. 6, Transverse polished section of the sample A57331-5 with a type 1 pseudocolumella showing stereome deposits in the bilateral symmetry plan imitating an axial lamellae. 7 and 8, transverse polished section of the sample 2303A7-1 sectioned at the top (7) and at the basis (8). The early stages of development at the basis present a rudimentary type 2 pseudocolumella (modified by bioerosion) while the later stage of development shows a type 1 pseudocolumella. 9-11, Photographs in lateral views of 3 specimens of N. pseudocolumellata with a type 1 pseudocolumella surpassing the distal peripheral edges of the calix (respectively, A30500, a paratype from the collections of the Muséum d’Histoire Naturelle de Paris, A57331-8, and A57331-2).
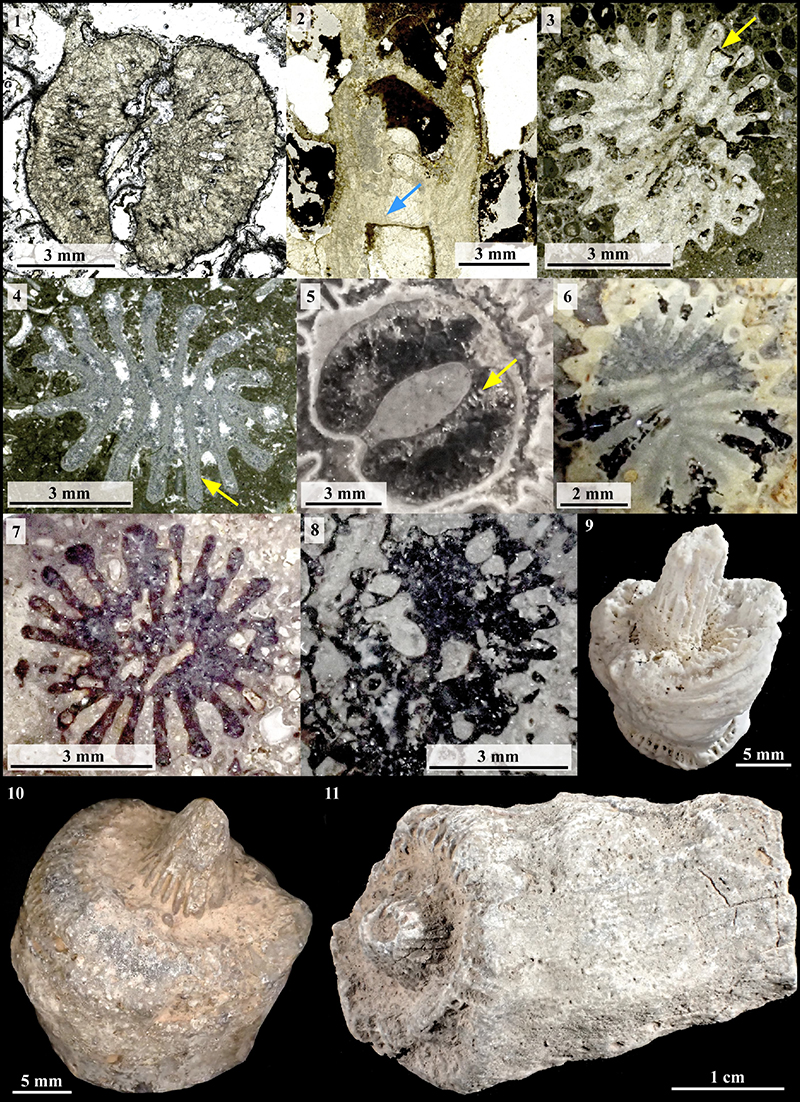
FIGURE 7. Step-by-step model of growth for Neorylstonia pseudocolumellata based on the assumption of an upward migration of polyp soft tissues by muscular contraction in accordance with structural observations of Brahmi et al. (2012) on dissepiments. Alternative modes of growth for soft tissues exist in the literature but do not impact the skeletal growth in the model (see Chevalier, 1987). 1, Coral skeleton without soft tissues. 2, Between two cycles of growth, soft tissues (in red) sit on the tabular dissepiments. 3, Initiating a new cycle of growth, soft tissues raise above the pseudocolumella and cristallize a new set of septal lamellae (in blue). In this case, relaxed soft tissues above the pseudocolumella produce an axial fold resulting in a type 2 pseudocolumella. 4, Soft tissues lift up, and simultaneously raise the septal and epithecal edges and raise the parathecal wall at the periphery of the corallite. At this stage, soft tissue is suspected to lift up by (i) septal traction of the growing septa or by (ii) standing on the pseudocolumella and successive stereome deposits forming the parathecal wall or even by (iii) floating on a gas of fluid blister separating the basal rim of the polyp and the tabular dissepiment (see Wells, 1969). 5, At the end of the growing cycle, new tabular dissepiments are synthetized in contact with the basal epiderm of the polyp. The model is the same for a type 1 pseudocolumella but septal lamellae are connected in the axis. The step-by-step growing phases presented here are a simplified proposition to help the understanding of the reader, the exact details of the coral’s growth process 183 million years ago may have been different. Abbreviations: C, costa; E, epitheca; Pw, parathecal wall; S, septa; Sl, septal lamellae; St, soft tissues; Td, tabular dissepiment.
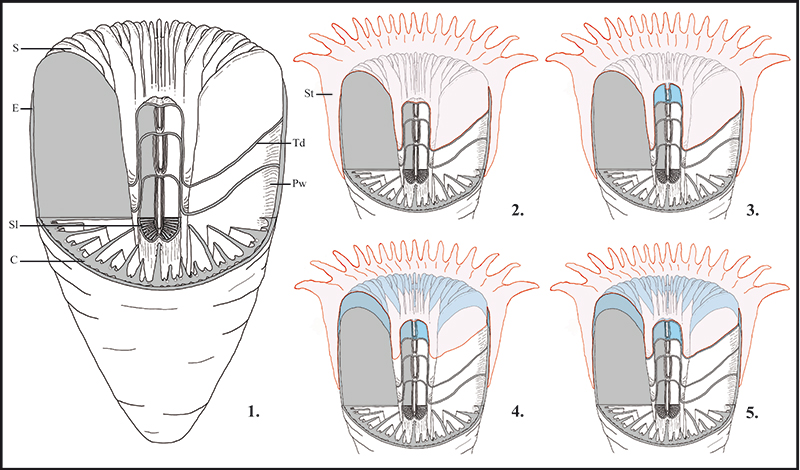
FIGURE 8. Univariate analysis based on the data in Table 2. 1, Small diameter (Sd) as a function of great diameter (Gd). 2, Great diameter (Gd) as a function of the extrapolated number of septa (exns). 3, Great diameter (Gd) as a function of the number of septa (Ns). 4, Great diameter (Gd) as a function of homogeneous septal density.
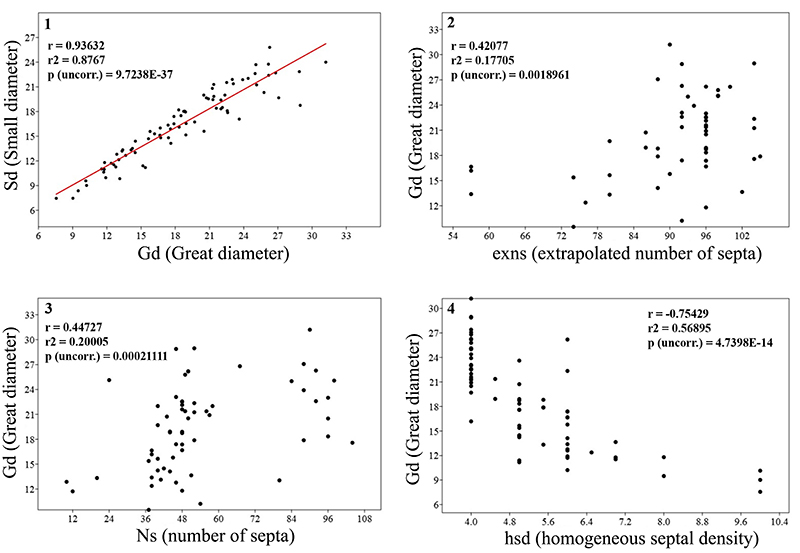
FIGURE 9. Univariate analysis based on the data in Table 2. 1, Frequencies of the values of extrapolated number of septa (exns). 2, Frequencies of the values of homogeneous septal density (hsd). 3, Frequencies of the values of number of pseudocolumellar septa (nps). 4, Middle of variation range value of S1 length as a function of the middle of variation range value of S2 length. 5, Middle of variation range value of S2 length as a function of the middle of variation range value of S3 length. 6, Middle of variation range value of S3 length as a function of the middle of variation range value of S1 length. The r value corresponds to the linear correlation coefficient and P (uncorr.) value represents the probability of having no correlation between the two compared sets of data.
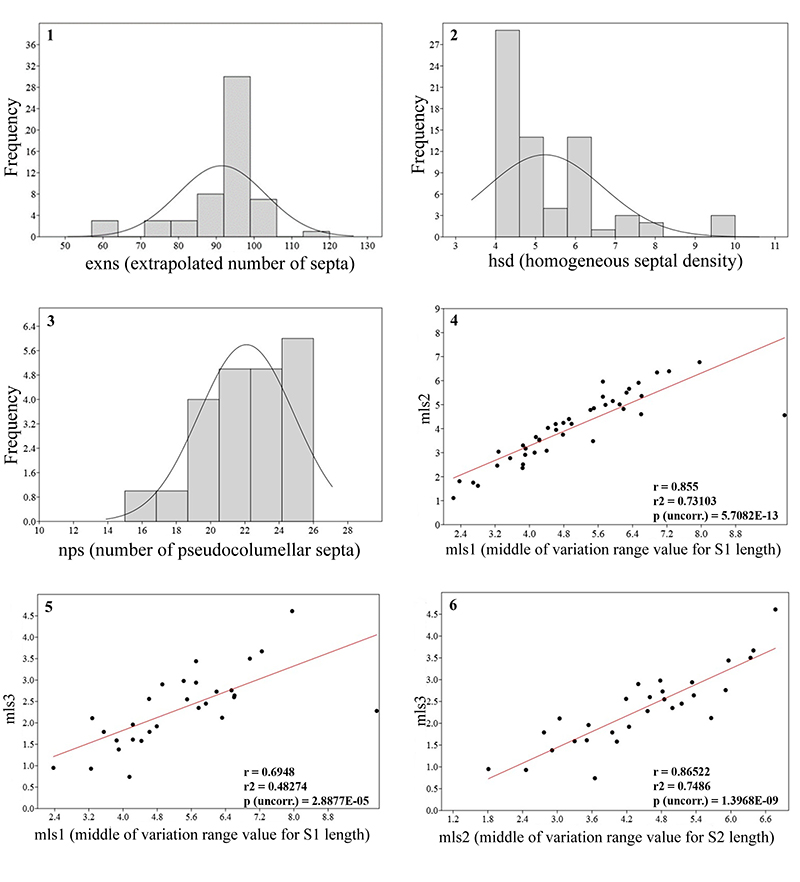
FIGURE 10. Set 3 PCA considering components 1 and 2, which sum gives more than 93% of variance percentage. Samples with type 1 pseudocolumella are symbolized with a dot on the graph and samples with type 2 pseudocolumella are symbolized with an “x”. The influence of each character is quantified and polarized with segments. Images of coral cross sections are from the data point closest to them.
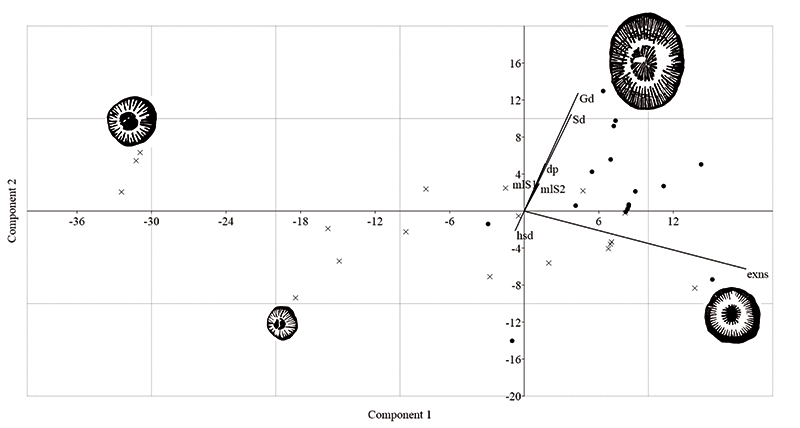
FIGURE 11. Set 2 discriminant analysis. Different colors correspond to different area of sampling. Pink: Amellagou olistoliths; Yellow: MNHN collections; Grey: Dades Valley; Green: Jebel Taabest; Black: Jebel Serdrar; Blue: Koudiat Ech Chehem; Orange: Taililout. Character influences are quantified and polarized with blue segments. Samples with type 1 pseudocolumella are symbolized with a dot on the graph and samples with type 2 pseudocolumella are symbolized with an “x”. Images of coral cross sections are from the data point closest to them.
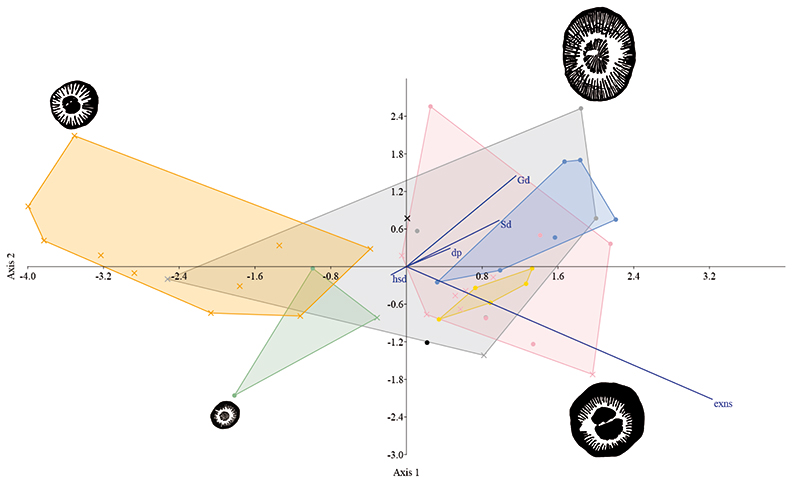
FIGURE 12. Distribution of the two extreme shapes of pseudocolumella (type 1 and type 2) in each sampling sites in High and Middle Atlas in Morocco; bar height indicates the number of type 1 and type 2 specimens. Facies map for the Pliensbachian modified from Ait Addi et al. (2005).
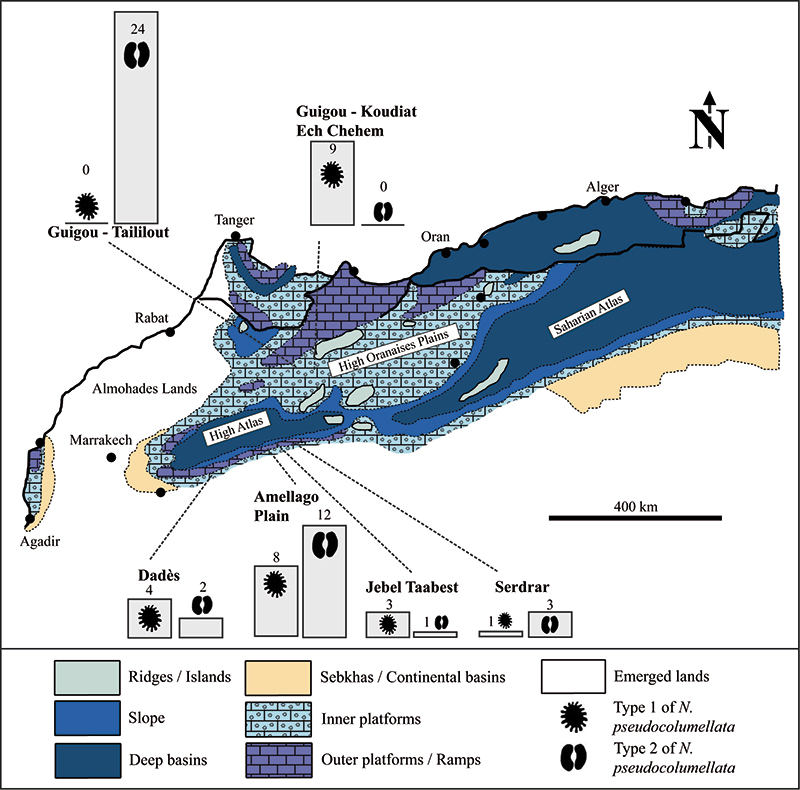
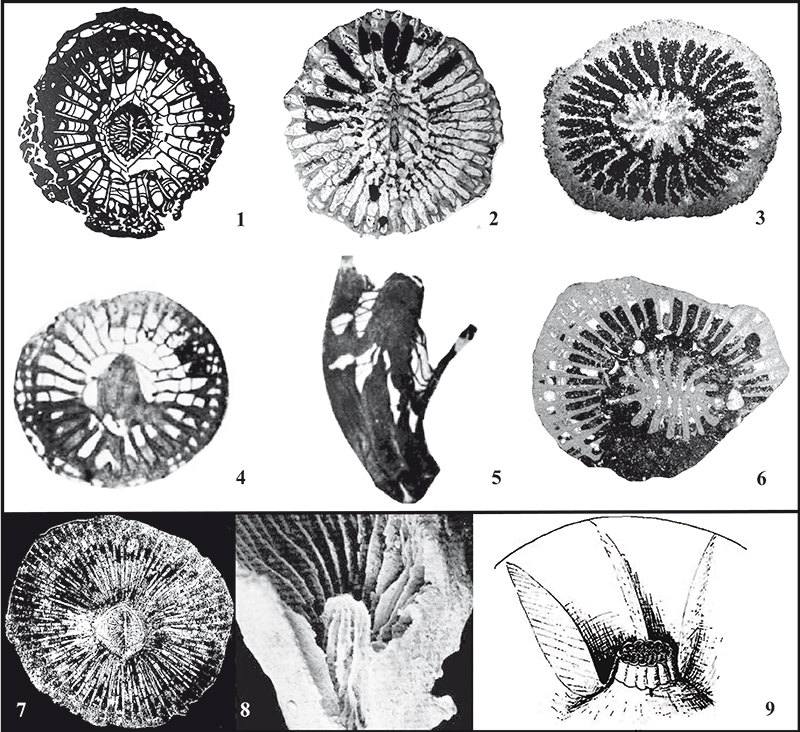
FIGURE 13. Comparison of Neorylstonia pseudocolumellata with examples of Paleozoic corals with a similar pseudocolumella axial structure. 1, Transverse section of Carruthersella sp. Garwood, 1913, modified from figure 197.5a of Moore, 1956. 2, Transverse section of Hamaraxonia sp. Berkowski, 2012, modified from figure 2.A of Berkowski and Weier (2012). 3, Transverse section of Sloveniaxon sp. Kossovaya, 2012, modified from figure 3.B3 of Kossovaya et al. (2012). 4, Transverse section of Rylstonia benecompacta, Hudson and Platt, 1927, modified from figure 234.2c of Hill (1981). 5, Longitudinal section of Rylstonia benecompacta, Hudson and Platt, 1927, modified from figure 234.2d of Hill (1981). 6, Transverse section in Neorylstonia pseudocolumellata (for comparison), sample AM175. 7, Transverse section of Amygdalophyllum sudeticum modified from figure 3.5 of Żołyński (2000). 8, Lateral view of the columella in a broken coral from the genus Lophophyllidium Grabau, 1928 modified from plate 60, figure 7 of Fedorowski (1974). 9, Reconstruction of the axial structure in the family Amygdalophyllidae: pseudocolumella with a multilamellar structure with primary lamella marked in the axial part, septal lamellae are an integral part of columella, tabella reaching the pseudocolumella in the same manner as septum, modified from figure 4.B of Fedorowski (1970).