FIGURE 1. Egypt, Sinai - Location map of the studied sections. H: Gebel Homayir; A: Gebel Arousiah; E: Gebel Engabashi; M: Gebel Mowerib.
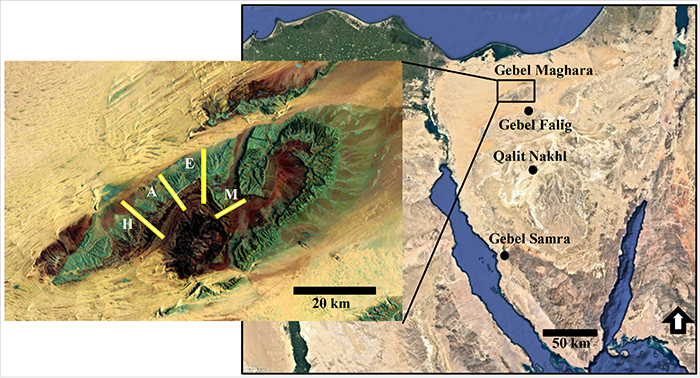
FIGURE 2. Cumulative average species duration curve illustrates the effect of sample size on the estimated species duration; duration of species plotted versus number of individuals.
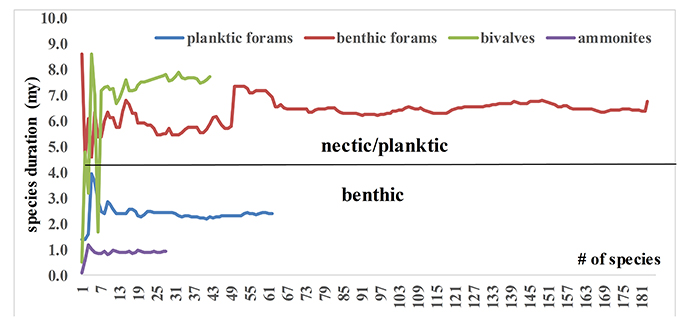
FIGURE 3. Violin plot of the species duration in the measured sections; data for the individual sections are merged.
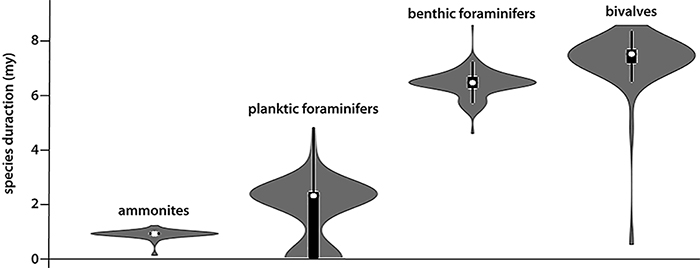
FIGURE 4. Violin plot of the species duration in both epifaunal and infaunal bivalves and benthic foraminifers; data for individual sections are merged. White dots are the mean value.
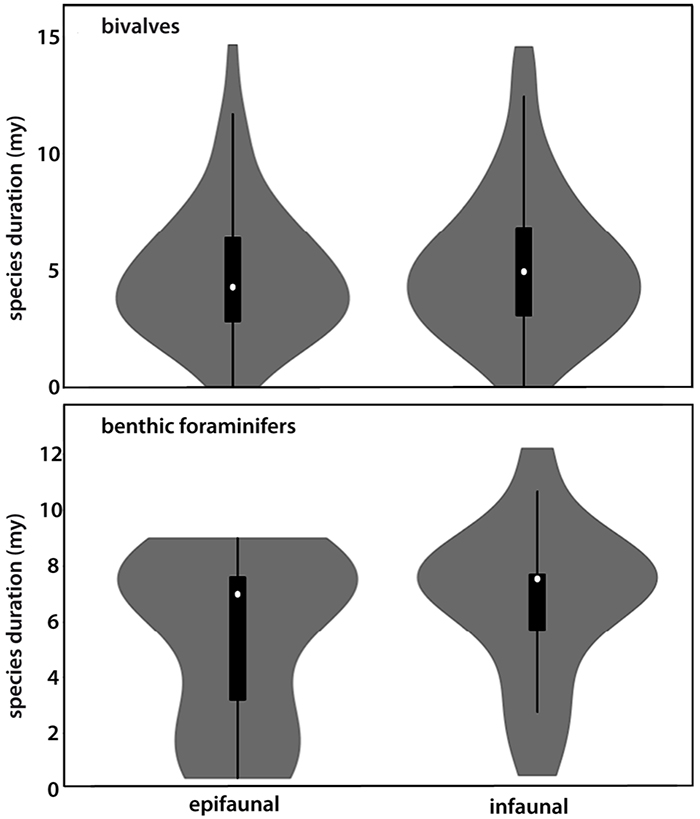
FIGURE 5. Box plot of the Shannon diversity. Note the difference between the planktic and benthic foraminifers. (Foraminifers = forams); circles are extreme outliers in the data.
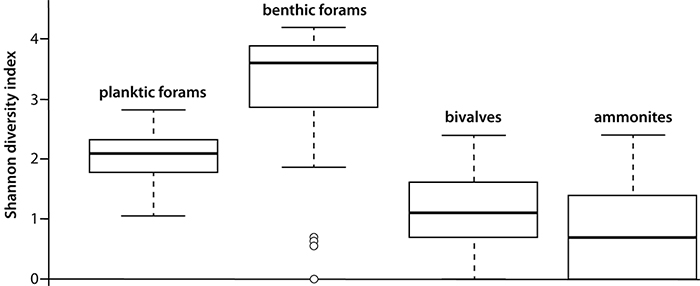
FIGURE 6. Violin plot that shows the geographic distribution of the analyzed fossil groups; 6.1) Number of latitudinal degrees occupied by the fossil groups based on the PBDB data, 6.2) Index of reproducibility (R) for the different UAs of the fossil groups. White dots are the mean value.
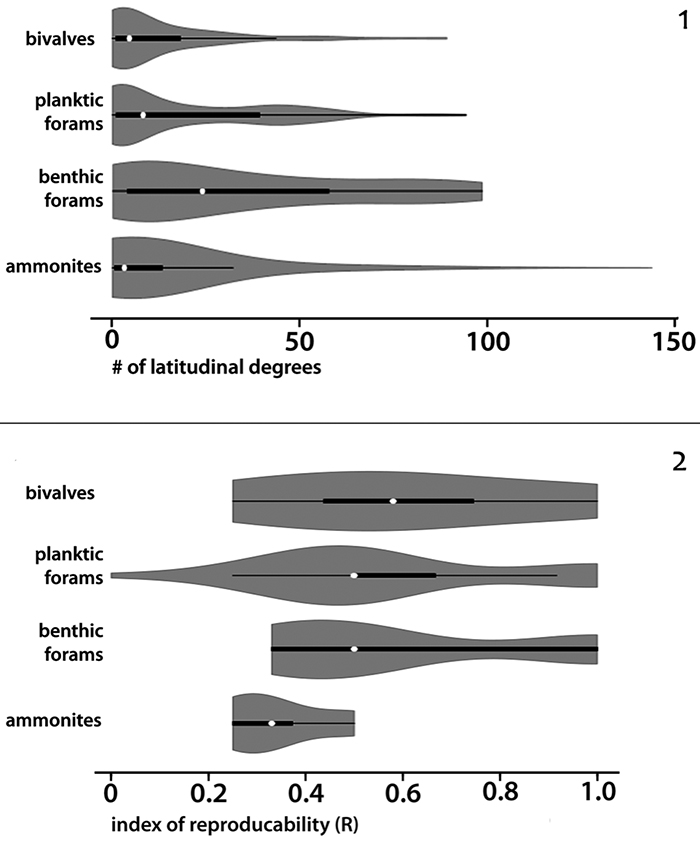
FIGURE 7. Stratigraphic chart of the Paleogene succession in Sinai showing the reproducibility matrix of the foraminifers. Black boxes indicate coexistence, while grey boxes document virtual coexistence. UA: Unitary Associations, 1: Gebel Falig, 2: Qalit Nakhl, and 3: Gebel Samra.
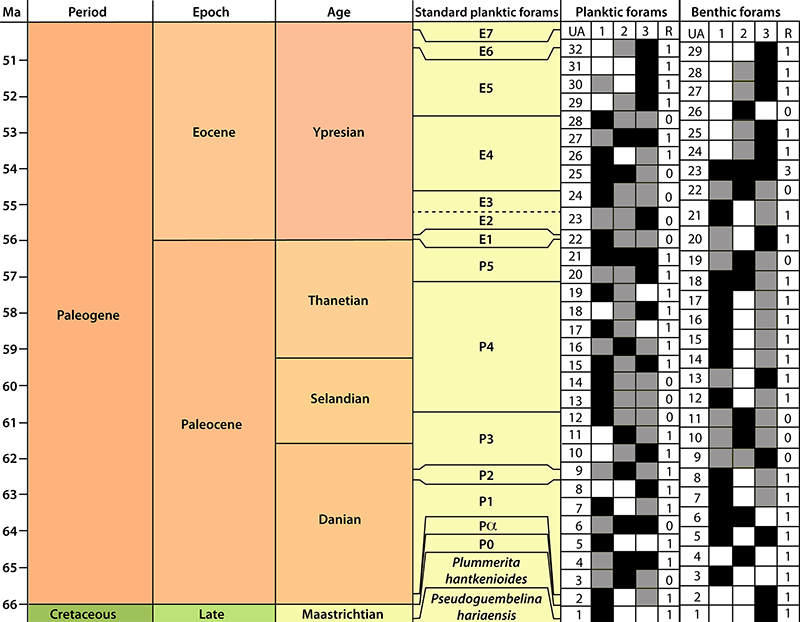
FIGURE 8. Stratigraphic chart of the Jurassic succession in Gebel Magharas showing the reproducibility matrix of the ammonites and bivalves. Black boxes indicate coexistence, while grey boxes document virtual coexistence. Numbers from UA: Unitary Associations. 1: Gebel Homayir, 2: Gebel Arousiah, 3: Gebel Engabashi, and 4: Gebel Mowerib.
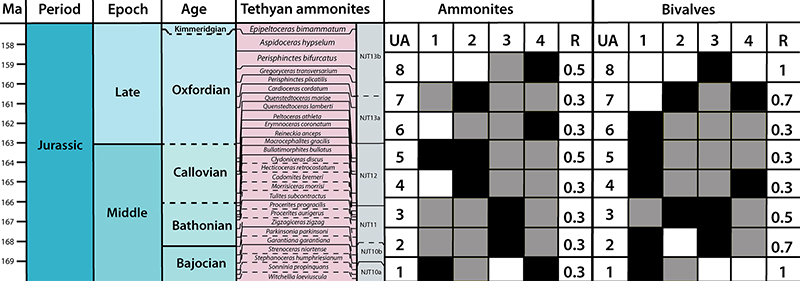
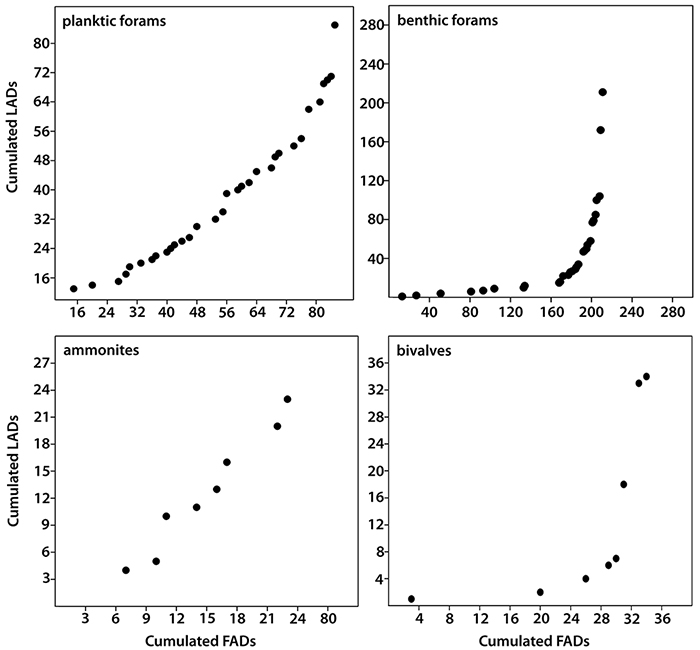
FIGURE 9. Cumulated FADs/LADs plot of the analyzed fossil groups. Taxa with higher extinction rates have shorter species duration. Note the higher extinction rates in planktic/nektic fauna compared to benthic ones.