FIGURE 1. Map showing the geographic position of the study area. 1, The position of Thermopigi on the Greek map (indicated by the star). 2, Topographic map of northern Greece showing the position of the study area (indicated by the star). The yellow-highlighted area signifies the Serbomacedonian Massif. The green-highlighted area encloses the Rhodope Massif. The red line represents the border between the two Massifs (Strymonlinie). The dashed lines represent national borders. Scale equals 50 km.
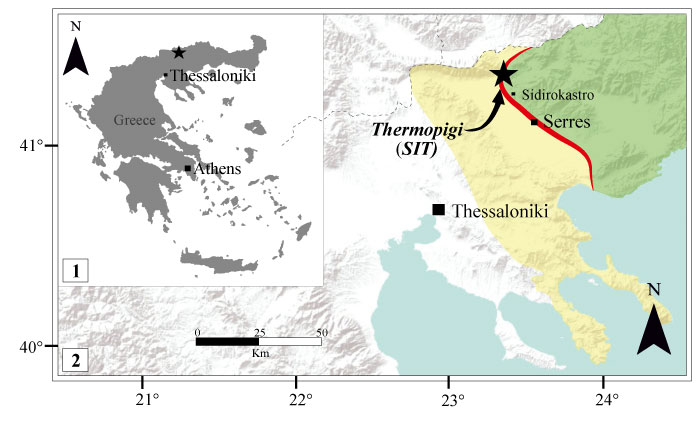
FIGURE 2. Stratigraphic log of Thermopigi. The fossiliferous layer is indicated by the red number (Bed number 5). For identification see the symbol legend.
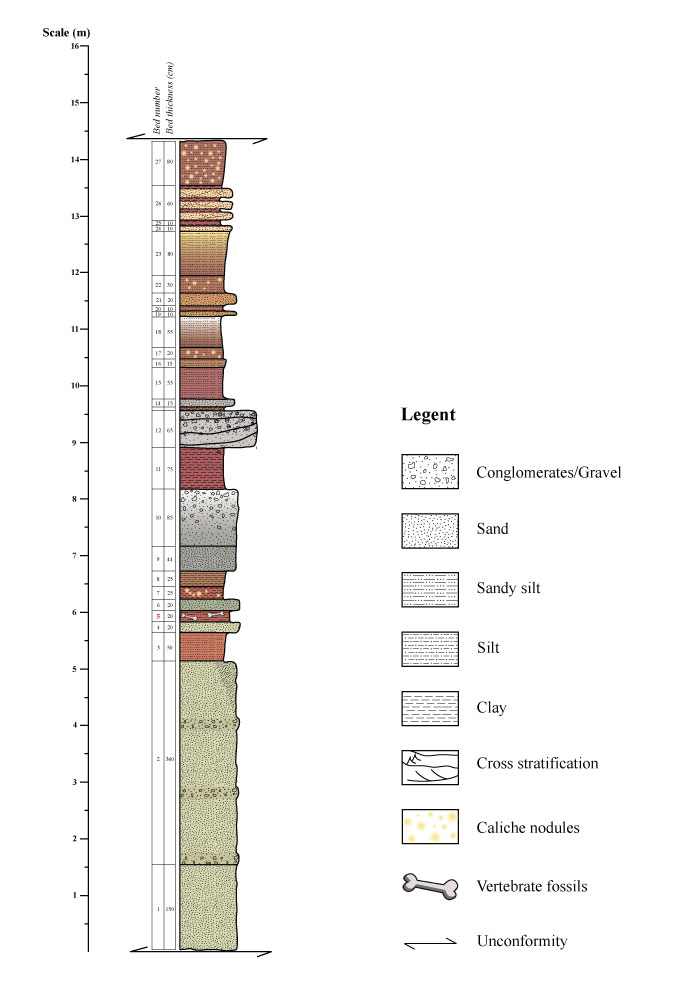
FIGURE 3. Fossil dental material of Helladotherium duvernoyi from Thermopigi: 1, SIT 1425, Isolated left dP2; 2, SIT 1260, part of isolated right dP3; 3, SIT 671, isolated left dP4; 4, SIT 1254, part of right maxilla with P2-M2; 5, SIT 1001, isolated left P2; 6, SIT 1251, isolated left P3; 7, SIT 651, isolated left P4. Scale equals 5 cm.
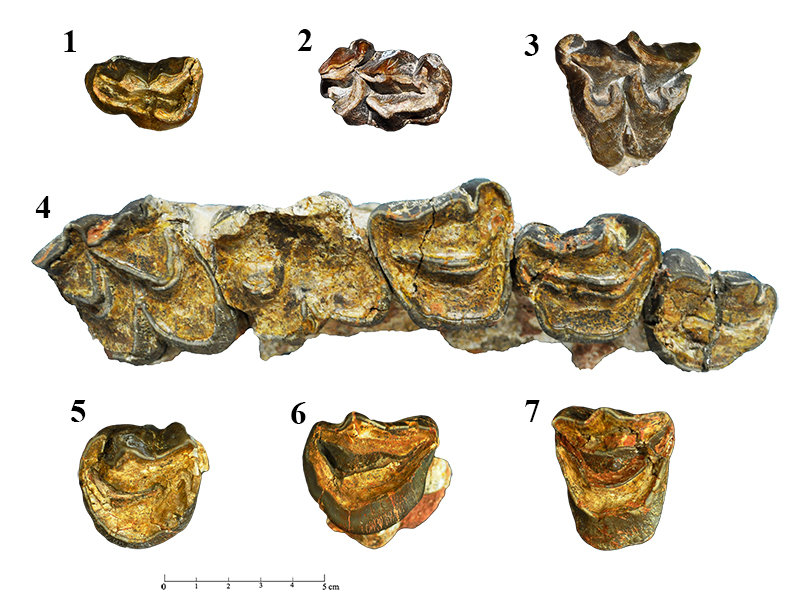
FIGURE 4. Fossil post-cranial material of Helladotherium duvernoyi from Thermopigi: 1, SIT 1034, right scapula, (i) lateral view and (ii) cranioventral view; 2, SIT 318, distal part of right humerus, (i) caudal view and (ii) distal view; 3, SIT 306, distal part of right humerus; 4, SIT 524, right magnum-capitatum; 5, SIT 937, left radius with parts of the ulna; 6, SIT 319, proximal part of left radius, (i) caudal view and (ii) distal view; 7, SIT 317, proximal part of left tibia; 8, SIT 1255, distal part of right tibia, (i) cranial view and (ii) distal view; 9, SIT 300, left metacarpal (Mc III+IV); 10, SIT 1235, left metacarpal (Mc III+IV); 11, SIT 920, right metacarpal (Mc III+IV); 12, SIT 938, proximal part of left metatarsal (Mt III+IV); 13, SIT 315, left calcaneus; 14, SIT 1004-1005, complex with left calcaneus and astragalus; 15, SIT 1059, left cubonavicular; 16, SIT 922, right tarsus complex in block with: distal part of tibia, lateral malleolus, astragalus, calcaneus, cubonavicular and cuneiform (medial view); 17, SIT 1002, left lateral malleolus, (i) lateral view and (ii) distal view; 18, SIT 310, right first phalanx, (i) dorsal view and (ii) proximal view; 19, SIT 541, right third phalanx. Scale equals 20 cm.
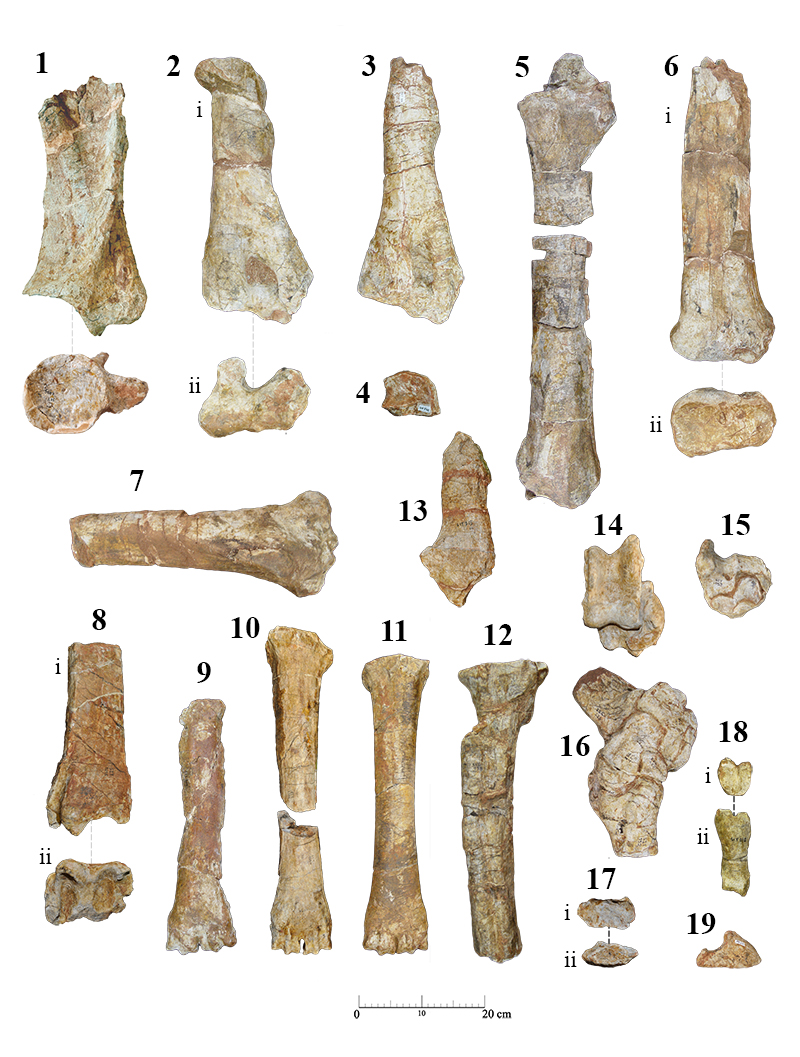
FIGURE 5. Dispersion plots showing length versus width of the second (up) and fourth (down) deciduous premolars of Helladotherium duvernoyi, compared with findings from other Greek localities. All measurements given in mm (data from Kostopoulos and Koufos, 2006; Kostopoulos, 2009; this study).
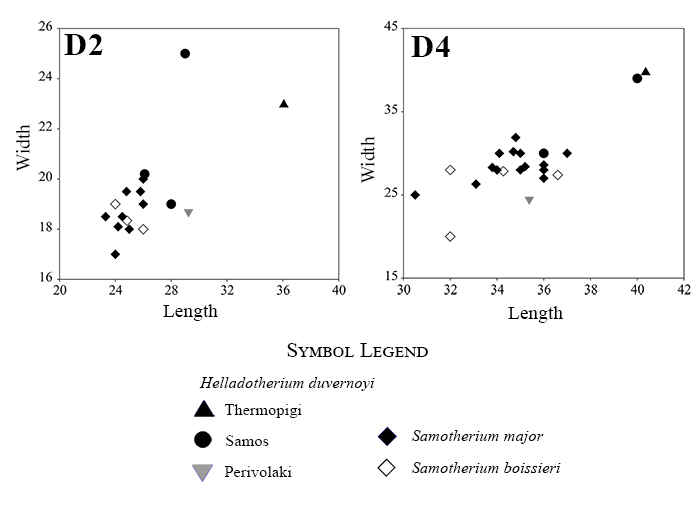
FIGURE 6. Barchart showing the range of upper premolar length in Helladotherium duvernoyi from Thermopigi, compared with other localities (data from Bohlin, 1926; Iliopoulos, 2003; Geraads et al., 2005; this study).
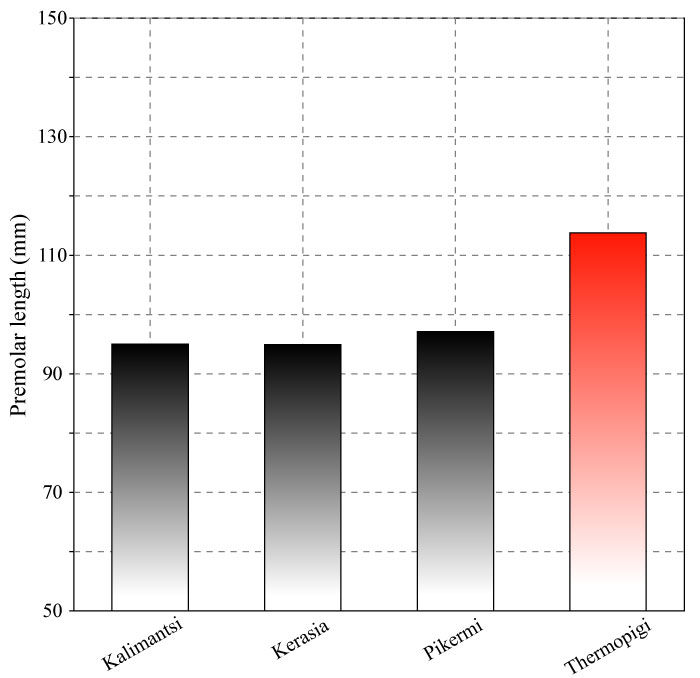
FIGURE 7. Scatter plots comparing dental measurements in Helladotherium duvernoyi from various localities. All measurements given in mm (data from Bohlin, 1926; Bakalov et al., 1962; Iliopoulos, 2003; Geraads et al., 2005; Kostopoulos and Koufos, 2006; this study).
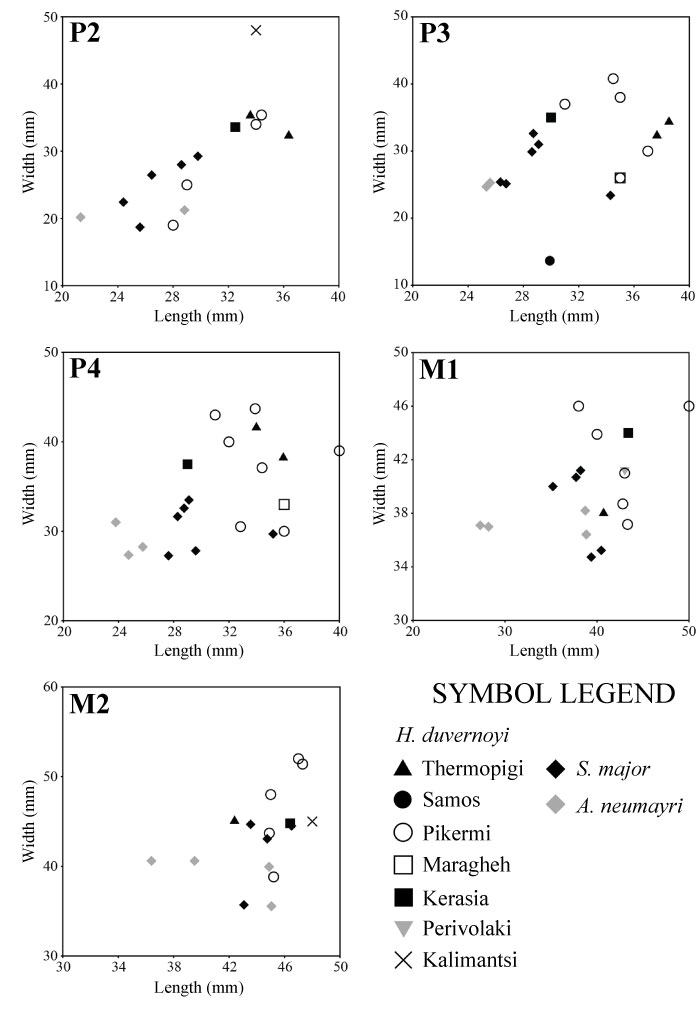
FIGURE 8. Scatter diagrams comparing limb proportions of Helladotherium duvernoyi from different Greek localities. TD: transverse diameter; APD: antero-posterior diameter; prox: proximal; dis: distal. All measurements given in mm (data from Iliopoulos, 2003; Kostopoulos and Saraç, 2005; Kostopoulos, 2009; this study).
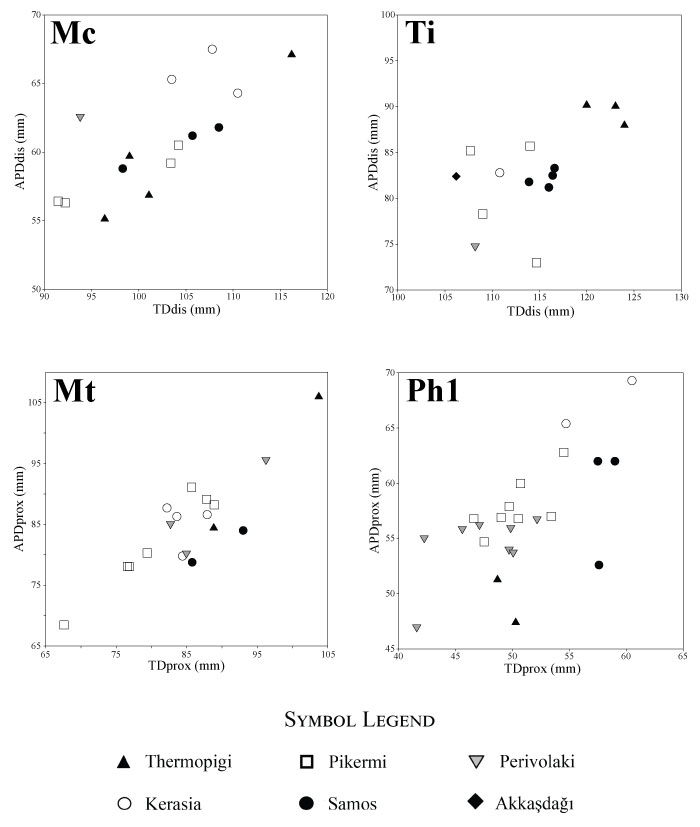
FIGURE 9. Post-cranial fossil material of Samotherium major from Thermopigi: 1, SIT 922, left scapula, (i) lateral view and (ii) cranioventral view; 2, SIT 313, distal part of left humerus, (i) caudal view and (ii) cranial view; 3, SIT 312, complete left radius-ulna, (i) lateral view, (ii) cranial view and (iii) medial view; 4, SIT 1020, complete left radius-ulna; 5, SIT 314, right metacarpal (Mc III+IV). Scale equals 20 cm.
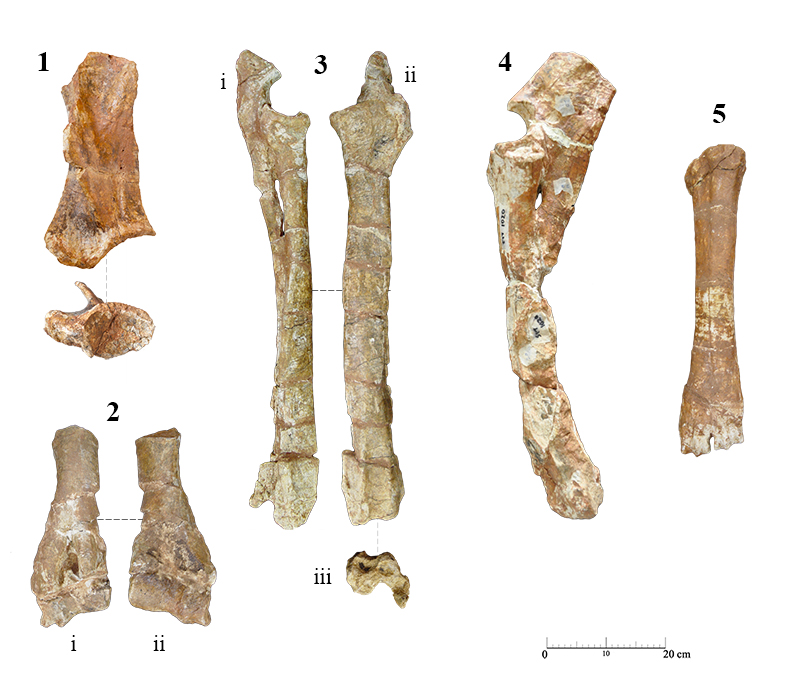
FIGURE 10. Bivariate plots for radii (Ra) and metacarpals (Mc) of Samotherium major from Thermopigi compared to Samotherium findings from Samos and Kerasia. All measurements given in mm (data from Iliopoulos, 2003; Kostopoulos, 2009; this study).
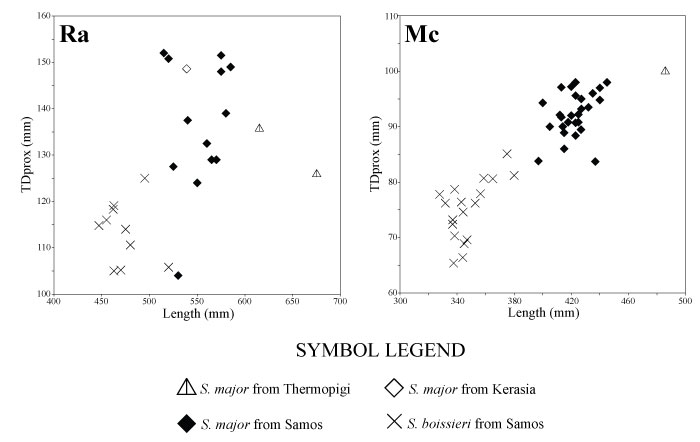
FIGURE 11. Boxplots of ranges or different measurements of radii (Ra) and metacarpals (Mc) of Samotherium major and Helladotherium duvernoyi from Thermopigi (SIT) in comparison with respective measurements from other various localities. Each box represents 50% of the range of each measurement. The top and the bottom bars represent the overall range of the length. The vertical line in the center of each box represents the median of the sample. TD: transverse diameter; prox: proximal; dia: diaphysis. All measurements are given in mm (data from Iliopoulos, 2003; Kostopoulos, 2009; Ríos et al., 2016; this study).
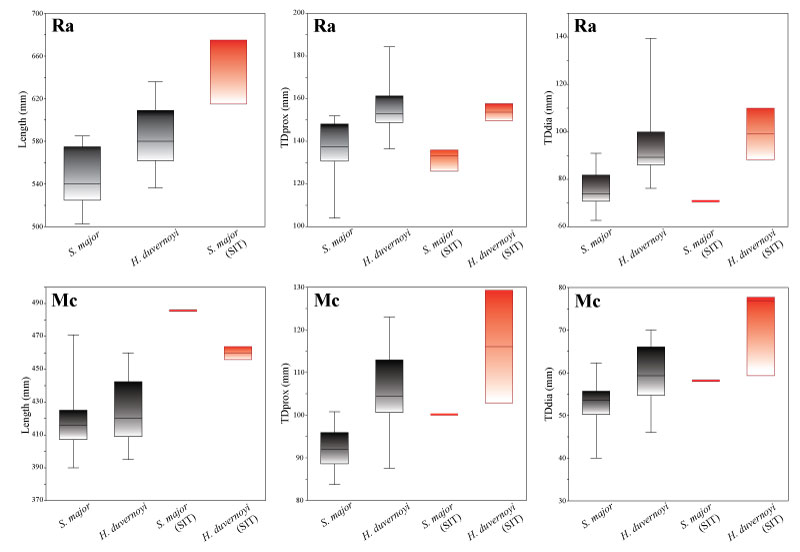
FIGURE 12. Dental and post-cranial fossil material of Palaeotragus rouenii from Thermopigi: 1, SIT 1253, part of left maxilla with P2-M2; 2, SIT 1153, part of left maxilla with M3; 3, SIT 939, left humerus, (i) caudal view, (ii) lateral view and (iii) cranial view; 4, SIT 302, left metacarpal (Mc III+IV), (i) dorsal view and (i) proximal view; 5, SIT 303, distal part and diaphysis of right metacarpal (Mc III+IV); 6, SIT 307, left metatarsal (Mt III+IV); 7, SIT 1256, right radius, (i) cranial view and (ii) caudal view.Scale for dental material equals 5 cm. Scale for post-cranial material equals 20 cm.
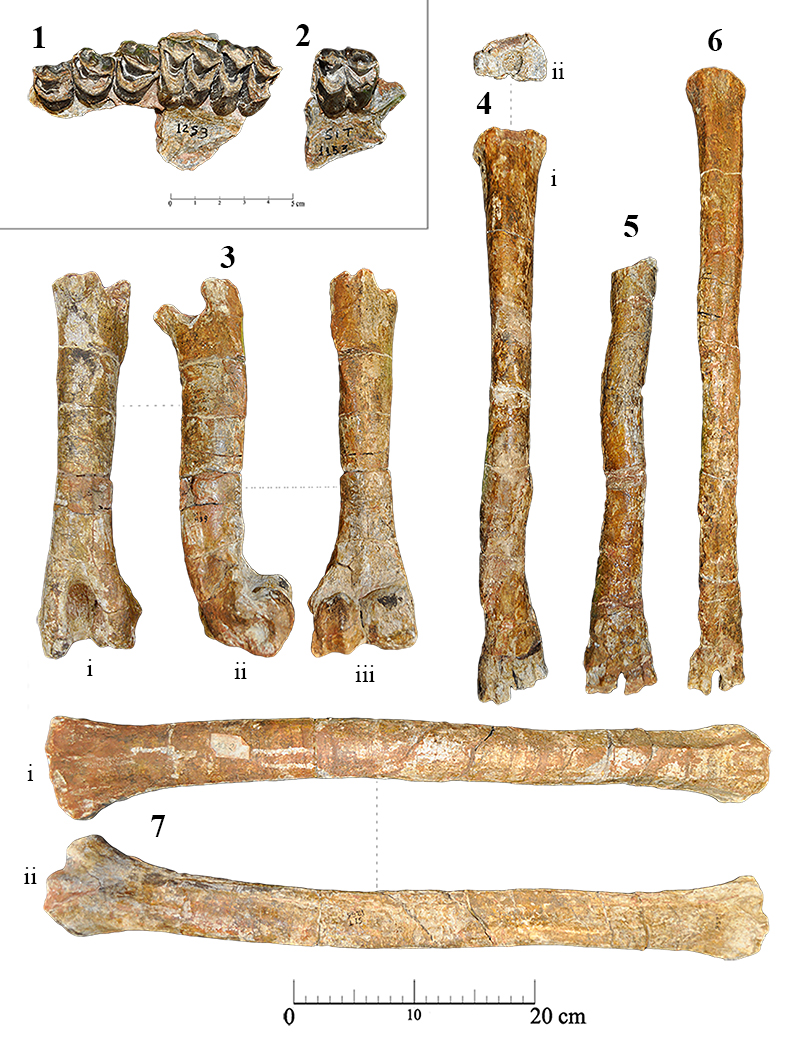
FIGURE 13. Dental fossil material of Palaeotragus sp. from Thermopigi: 1, SIT 1119, isolated right incisor i3, (i) labial view and (ii) lingual view; 2, SIT 1252, isolated right canine; 3, SIT 1511, part of upper left tooth row with p2-p4; 4, SIT 700, left complete mandible with p2-m3. Scale equals 5 cm.
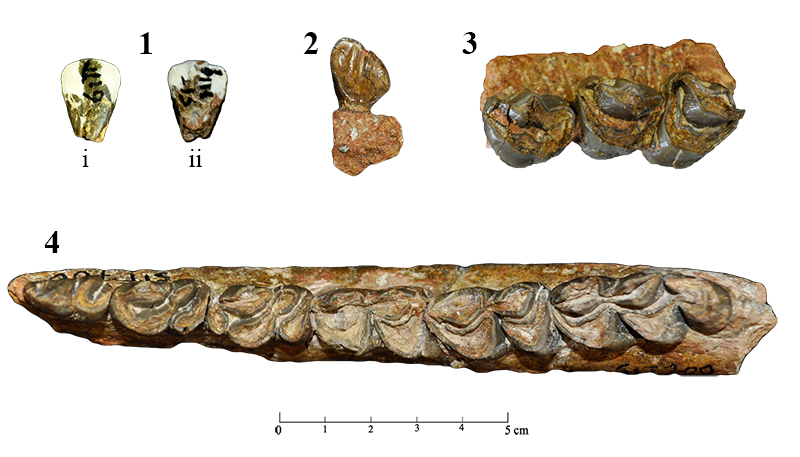
FIGURE 14. Box plot of average amount of upper premolar length of various Palaeotragus species. The red line represents the measurement of the Thermopigi specimen. Each box represents 50% of the range of the premolar length, while the top and the bottom bars represent the overall range of the length. The vertical line in the center of each box represents the median of the sample (data from Bohlin, 1926; Korotkevich, 1970; Geraads, 1978; Godina, 1979; Krakhmalnaya, 1996; Kostopoulos and Saraç, 2005; Kostopoulos, 2009; this study).
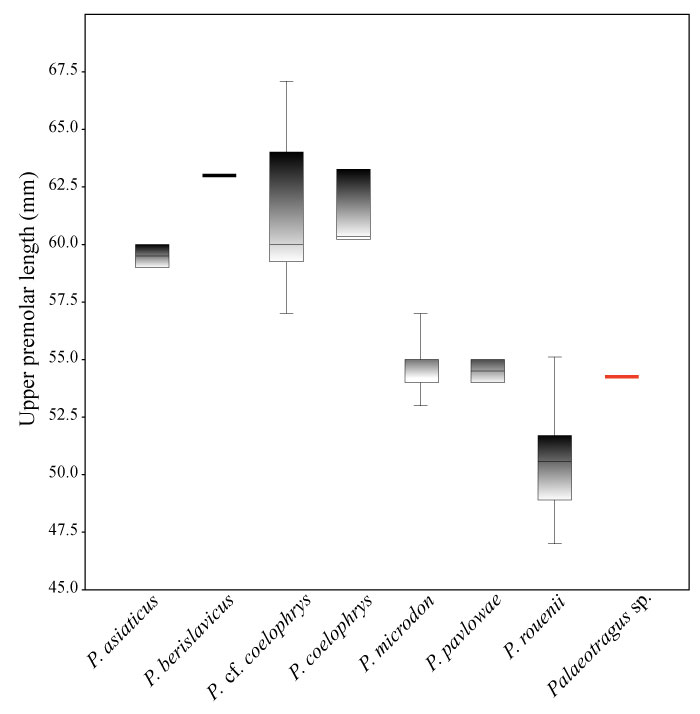
FIGURE 15. Box plot of lower premolar length of various Palaeotragus taxa. The red line represents the measurement of the Thermopigi specimen. Each box represents 50% of the range of the premolar length. The top and the bottom bars represent the overall range of the length. The vertical line in the center of each box represents the median of the sample (data from Schlosser, 1924; Bohlin, 1926; Korotkevich, 1970; Geraads, 1978; Godina, 1979; Iliopoulos, 2003; Kostopoulos and Saraç, 2005; this study).
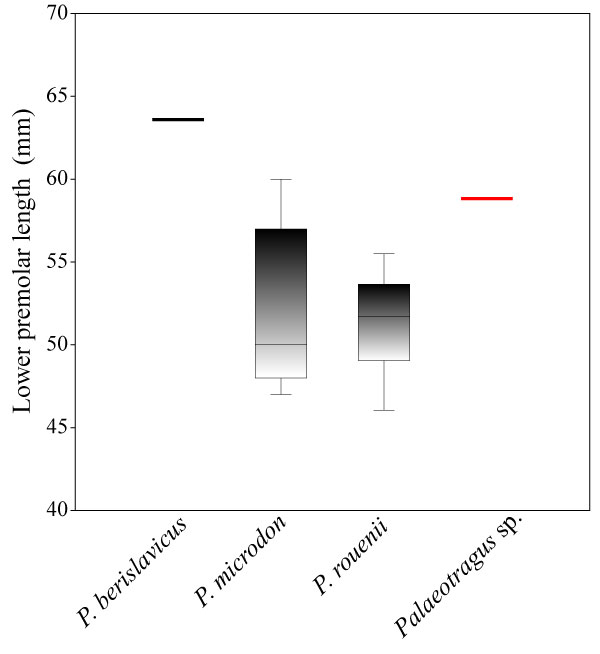
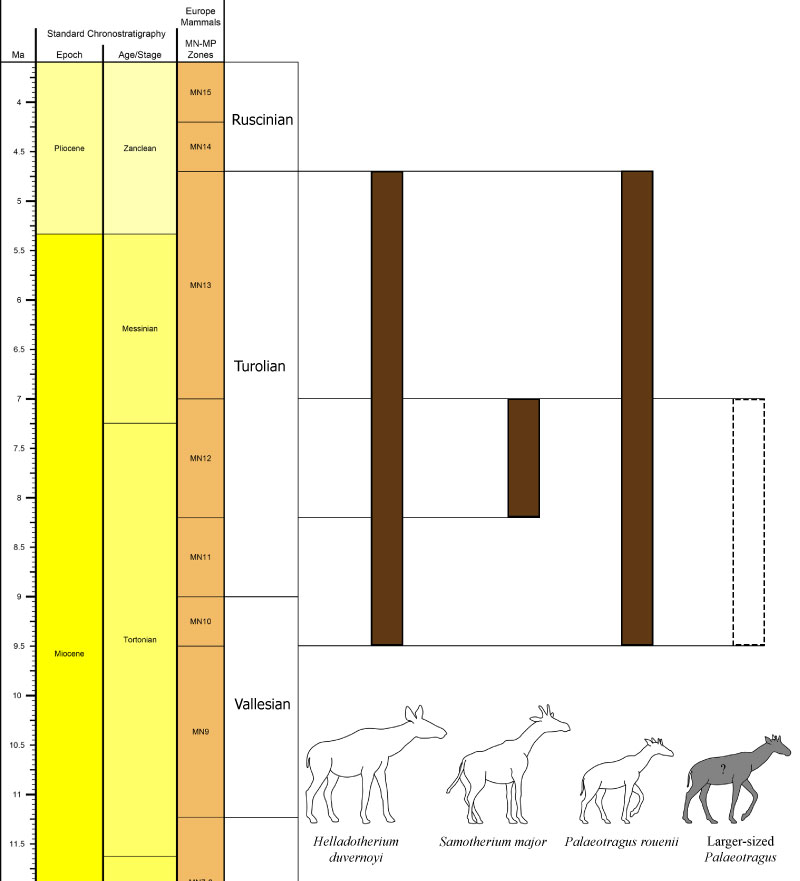
FIGURE 16. Chronostratigraphic distribution of the giraffid species found at Thermopigi: Helladotherium duvernoyi, Samotherium major, Palaeotragus rouenii and Palaeotragus sp. (data from Steininger, 1999; Iliopoulos, 2003; Koufos, 2006; Kostopoulos, 2009; Koufos et al., 2009).