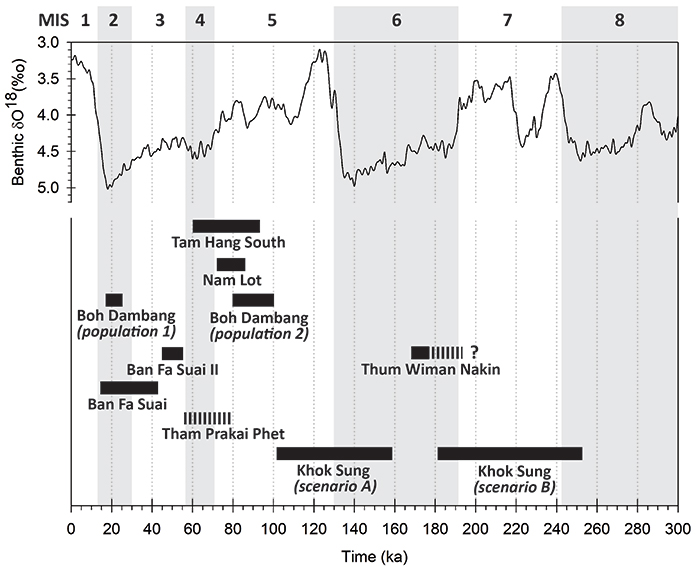
FIGURE 1. Map of Thailand showing fossil sites mentioned in the text (star).
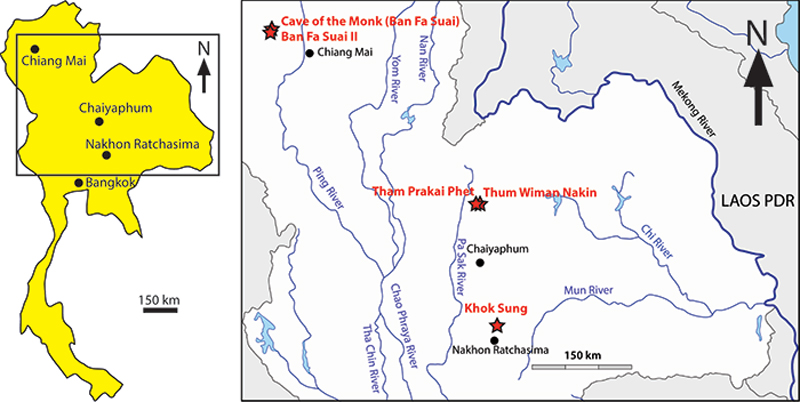
FIGURE 2. Magnetostratigraphic and lithostratigraphic sections of the Khok Sung sand pit, Nakhon Ratchasima Province (modified from Suraprasit et al., 2015).
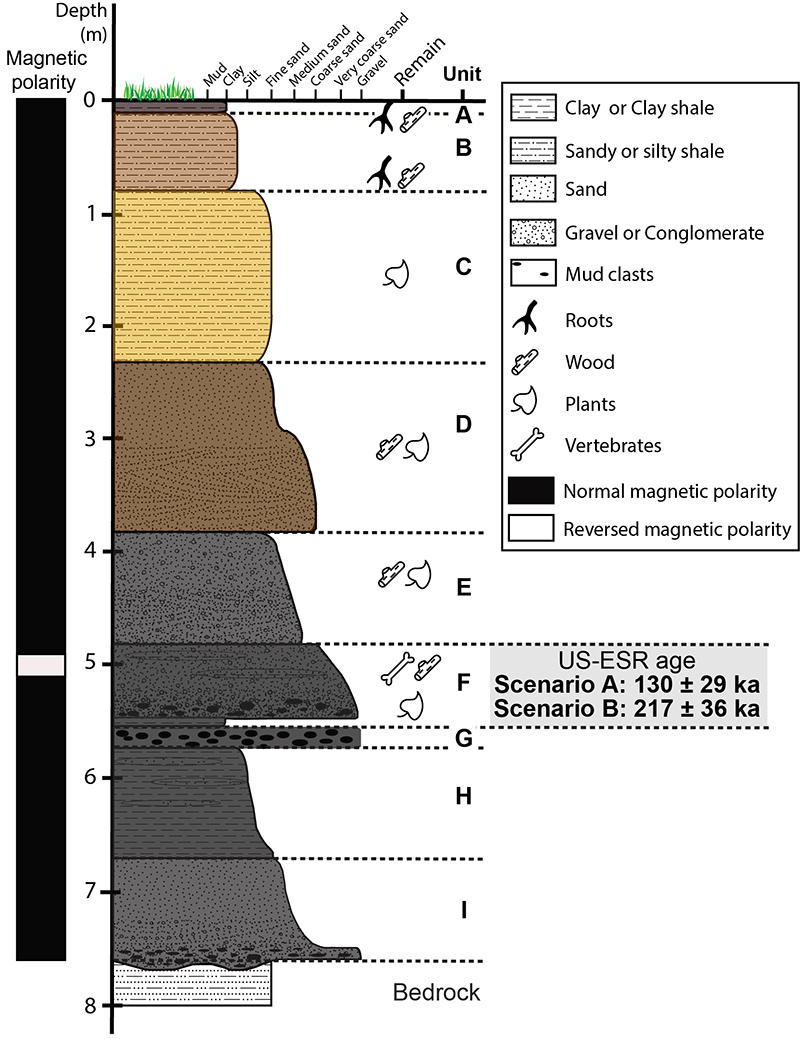
FIGURE 3. Khok Sung locality during excavation in 2005 (picture from Y. Chaimanee). The dark grey sediment corresponds to the fossiliferous layer (unit F). The lower part of unit F is below the water and not visible on the picture.
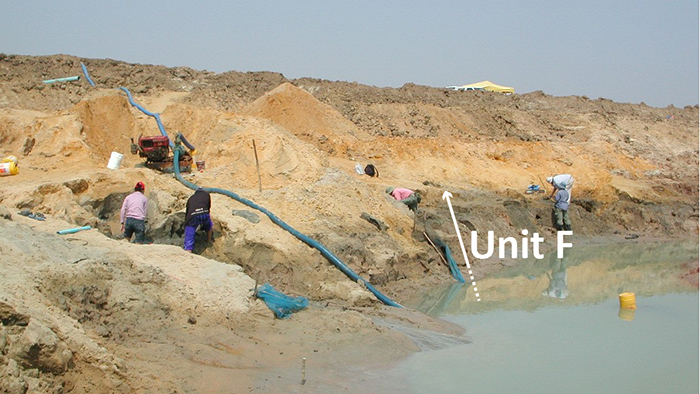
FIGURE 4. ESR dose response curves obtained for the six tooth enamel samples. The equivalent dose (De) values were obtained by fitting a single saturating exponential (SSE) through the mean ESR intensities derived from the three repeated measurements.
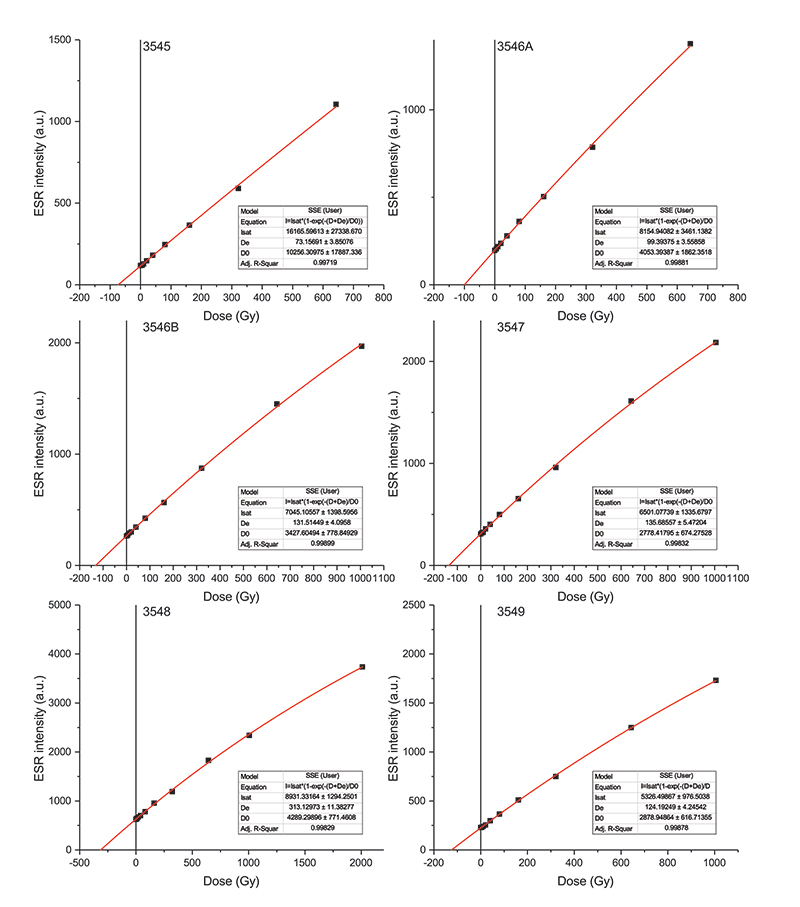
FIGURE 5. Gamma dose rate distribution derived from the 10,000 random simulations (bin size = 20 µGy/a). Values have been corrected for 30% water content. A local maximum may be observed at 340 ± 42 µGy/a (mean value and associated standard deviation derived from the three highest bars).
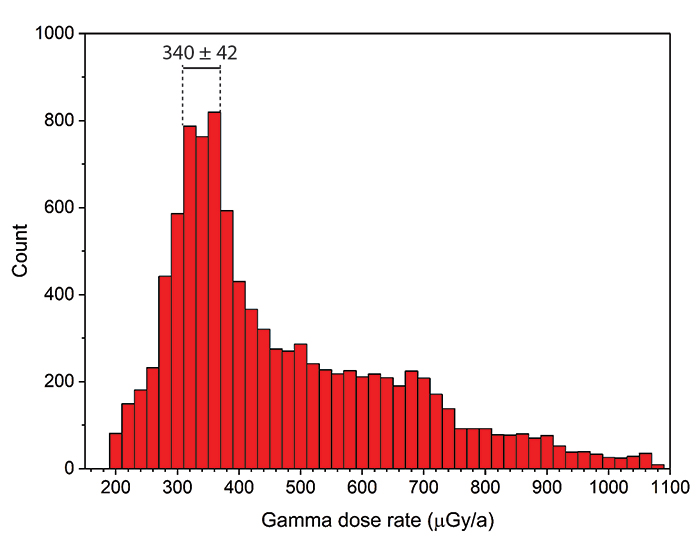
FIGURE 6. Stacked histograms of CSUS-ESR age distributions obtained for each sample.
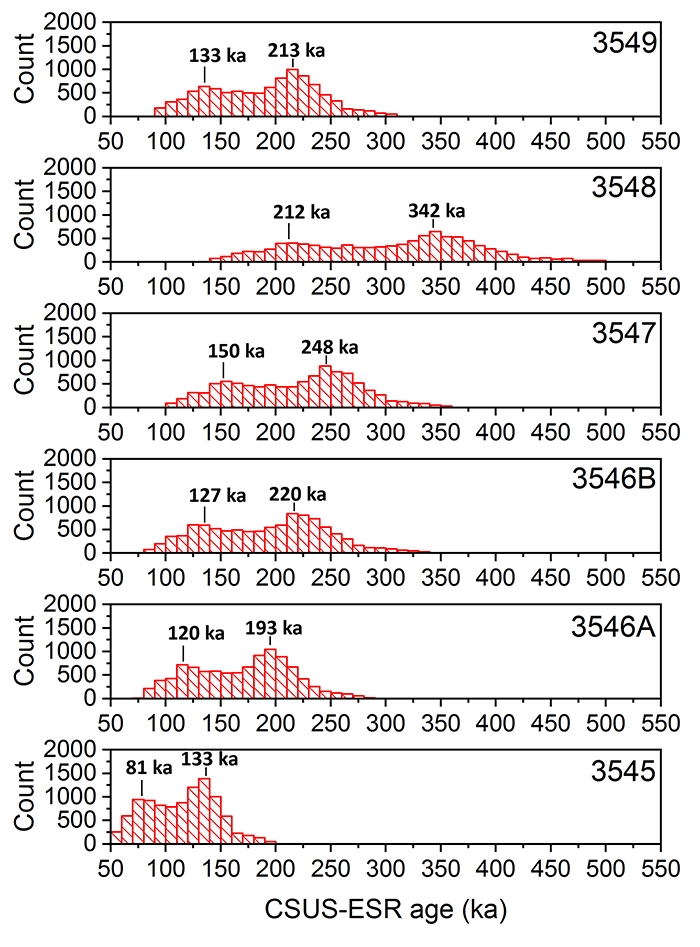
FIGURE 7. Age distribution considering all samples but 3548. Two Gaussian functions were fitted through each of the two peaks, resulting in mean values and associated 1 standard deviation of 130 ± 29 ka and 217 ± 36 ka.
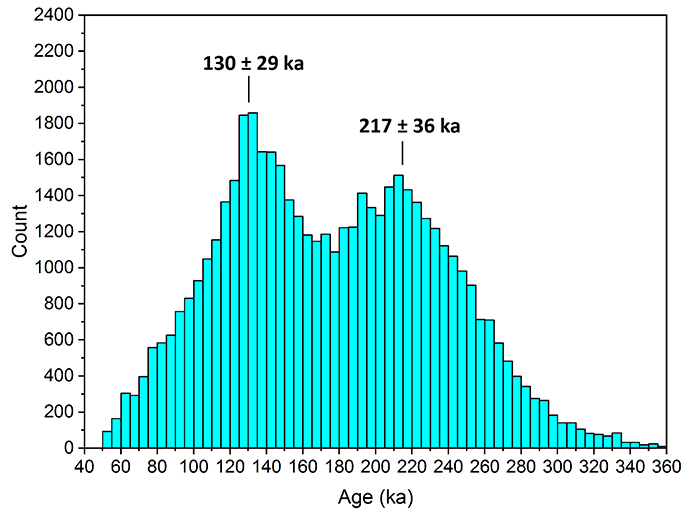
FIGURE 8. Age range of the sites mentioned in the text. Notes: (i) Thum Wiman Nakin site: minimum age constraint for the fossil assemblage; (ii) Tham Prakai Phet site: unpublished preliminary results from an ongoing investigation. MIS data from Lisiecki and Raymo (2005).