FIGURE 1. Age model quality histogram.
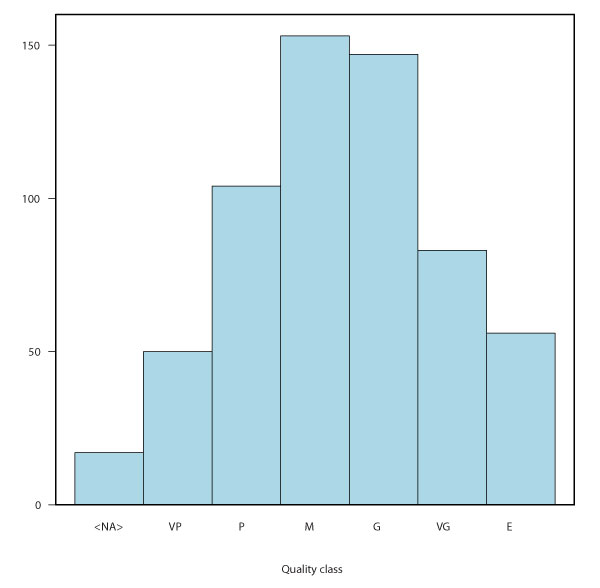
FIGURE 2. Current architecture of the NSB database.
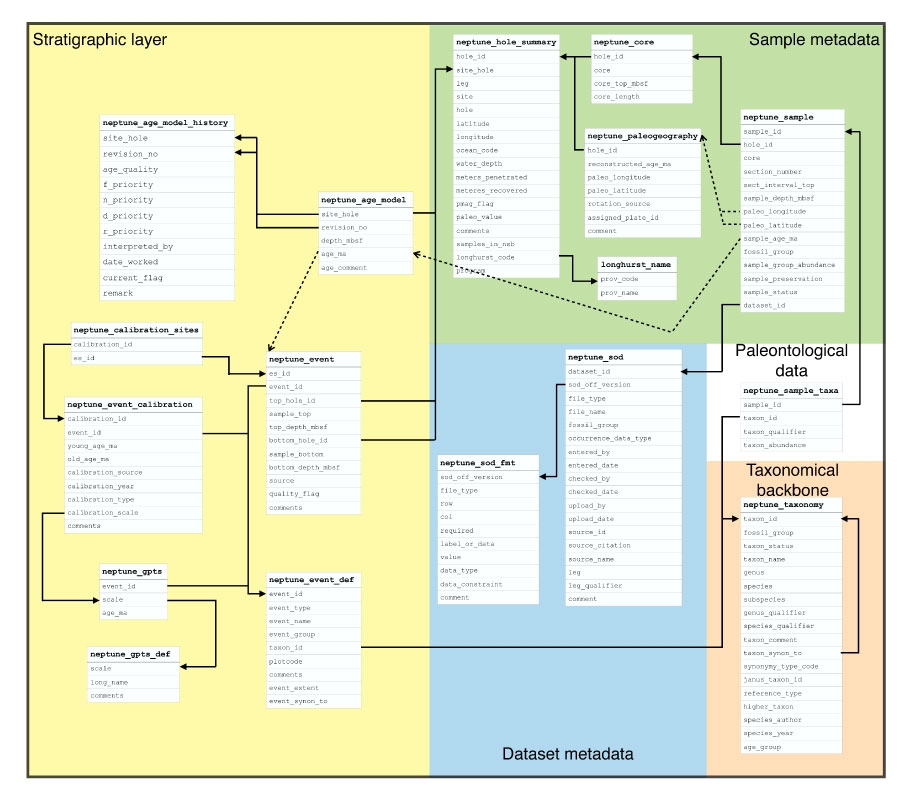
FIGURE 3. Query page for microfossil occurrences.
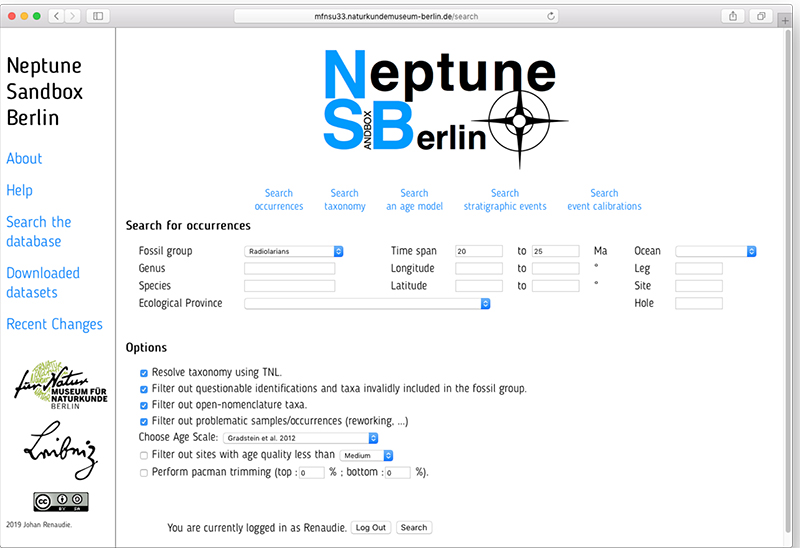
FIGURE 4. Result page for microfossil occurrences (the specific query here was for radiolarians from samples between 20 and 25 Ma).
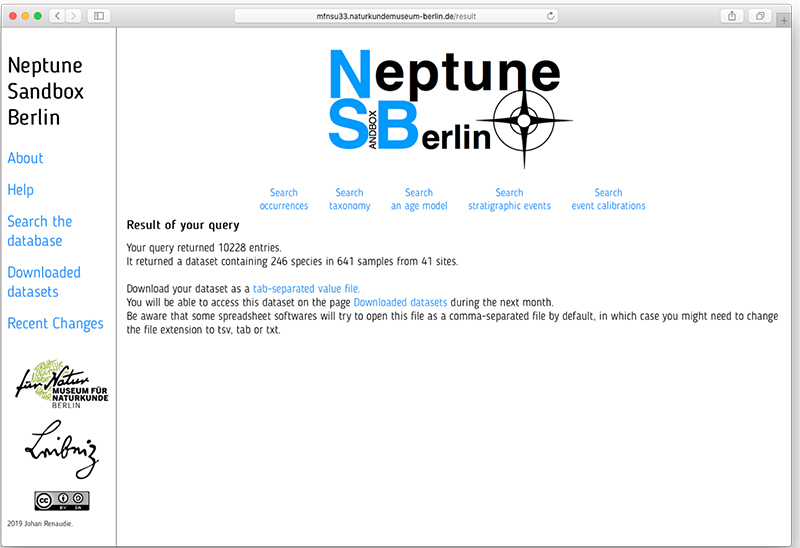
FIGURE 5. Result page for microfossil taxonomy.
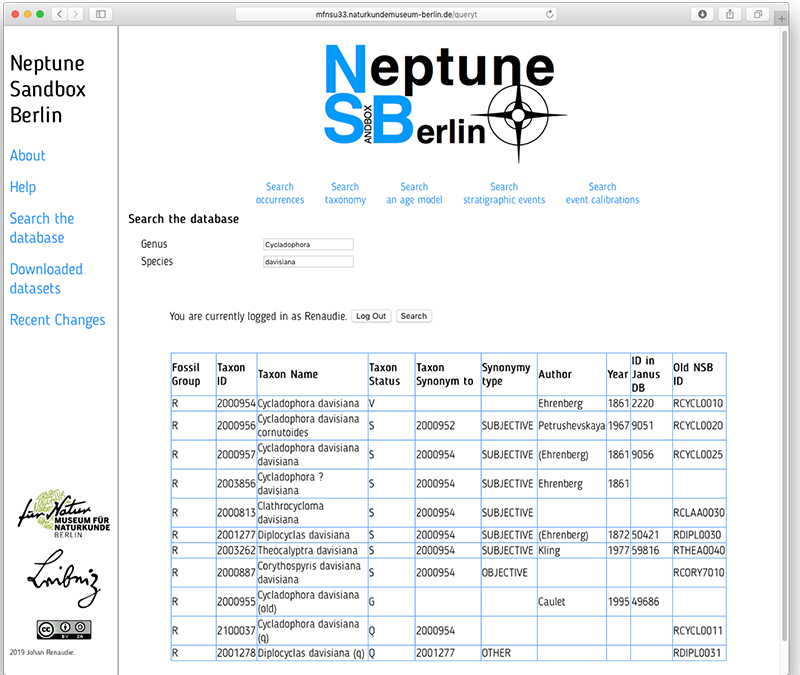
FIGURE 6. Result page for stratigraphic event calibrations.
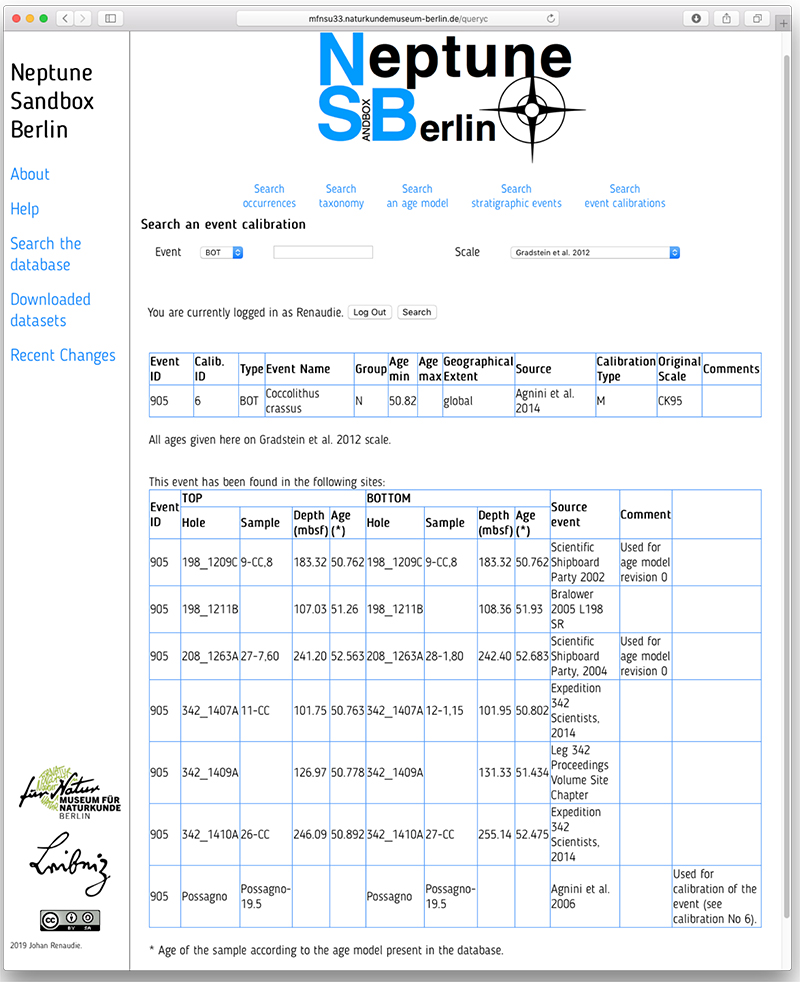
FIGURE 7. Result page for stratigraphic events on a single site.
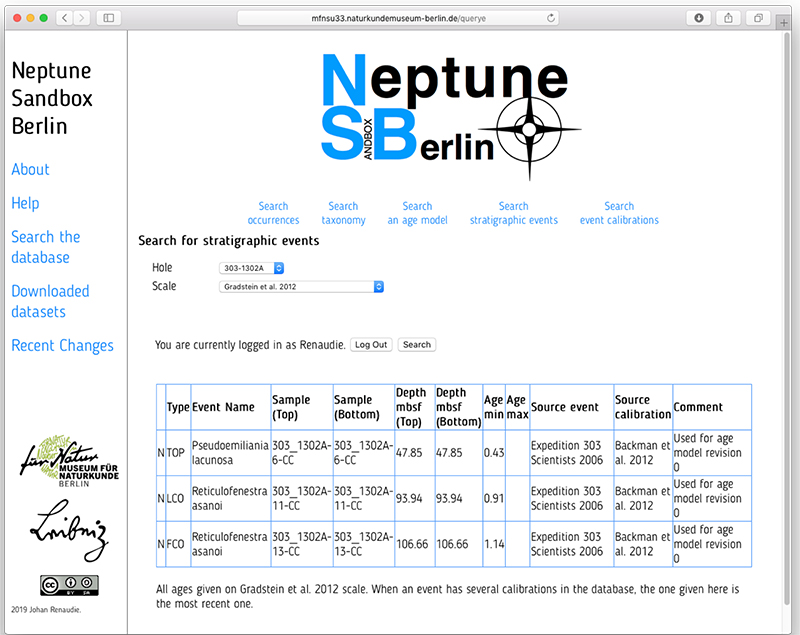
FIGURE 8. Result page for age model query.
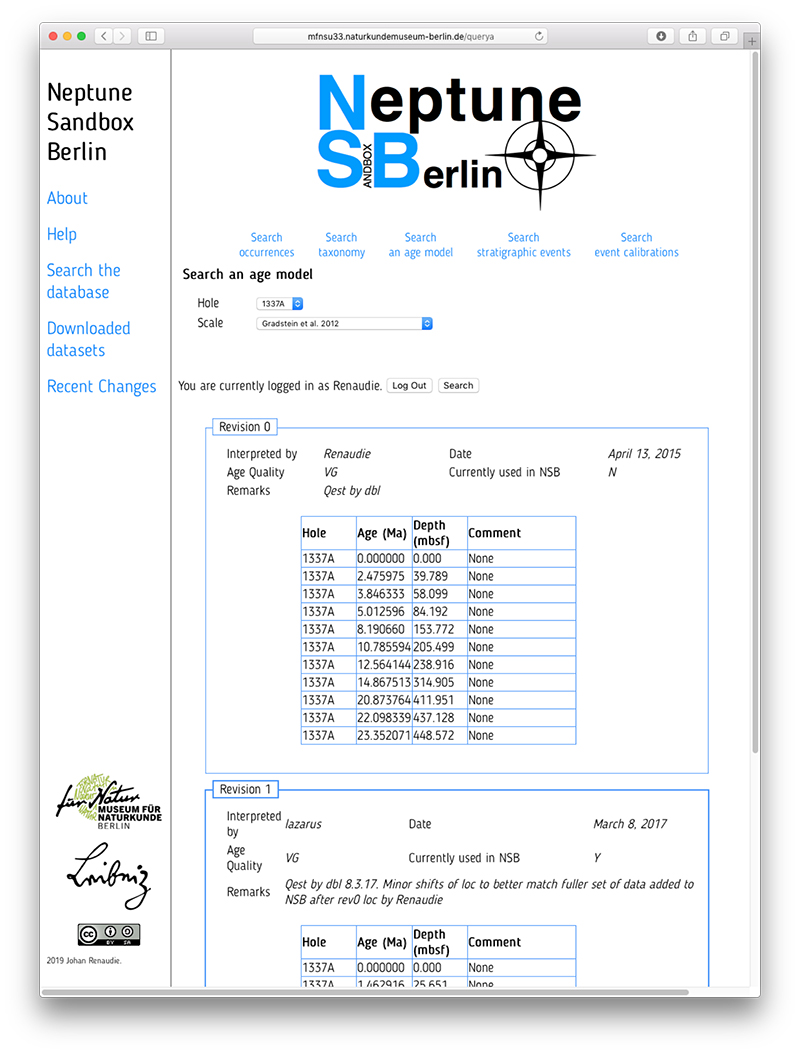
FIGURE 9. Age-Depth plot window.
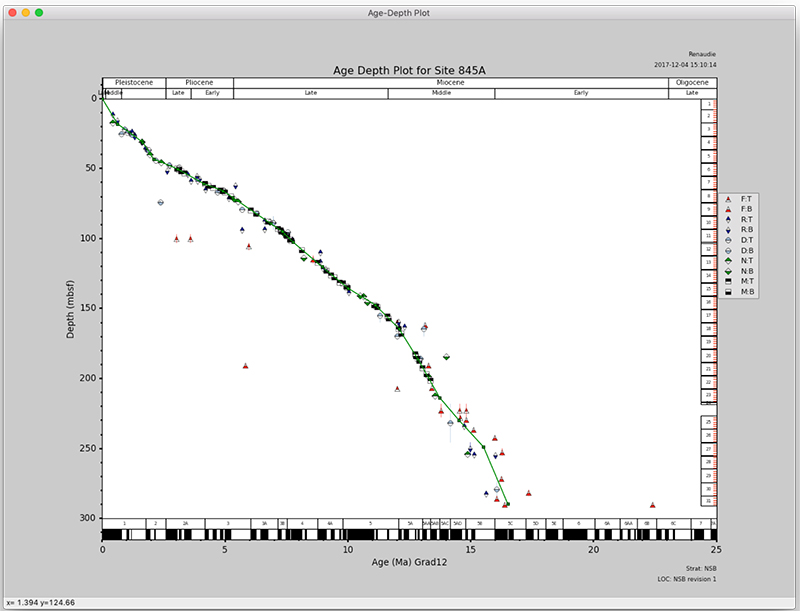
FIGURE 10. Hole selection in NSB_ADP_wx.
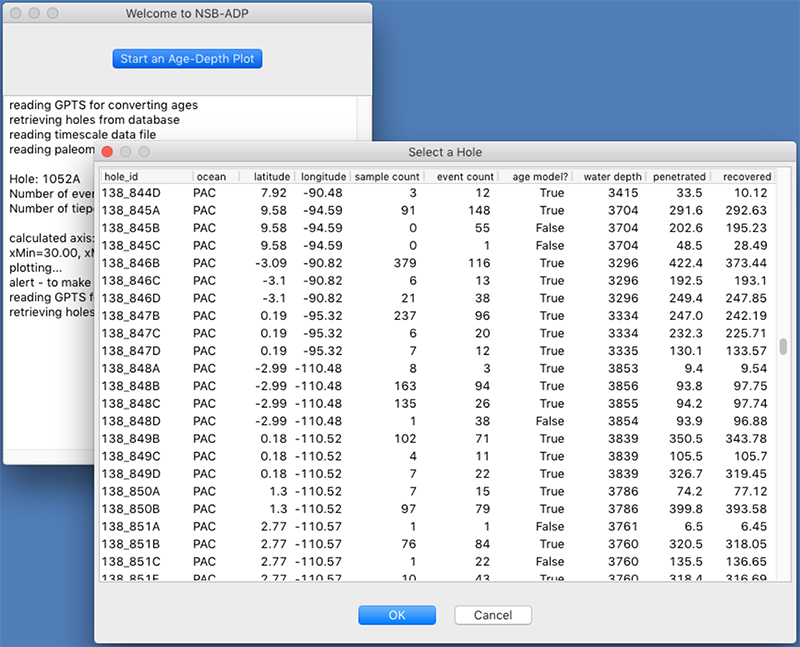
FIGURE 11. Age model selection in NSB_ADP_wx.
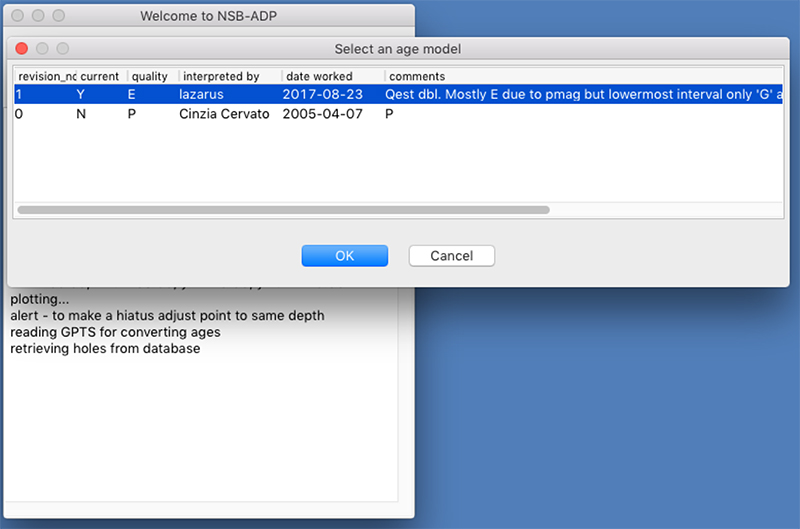
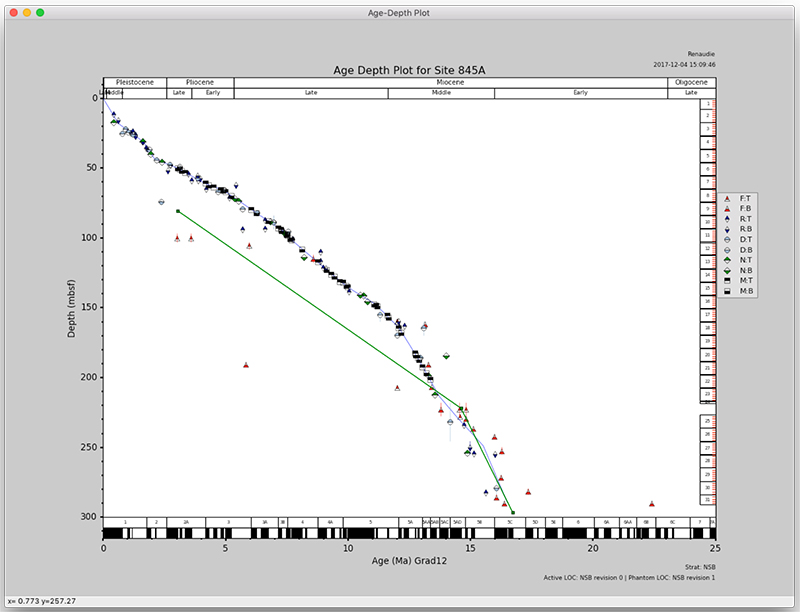
FIGURE 13. Weekly visitors and registered users.
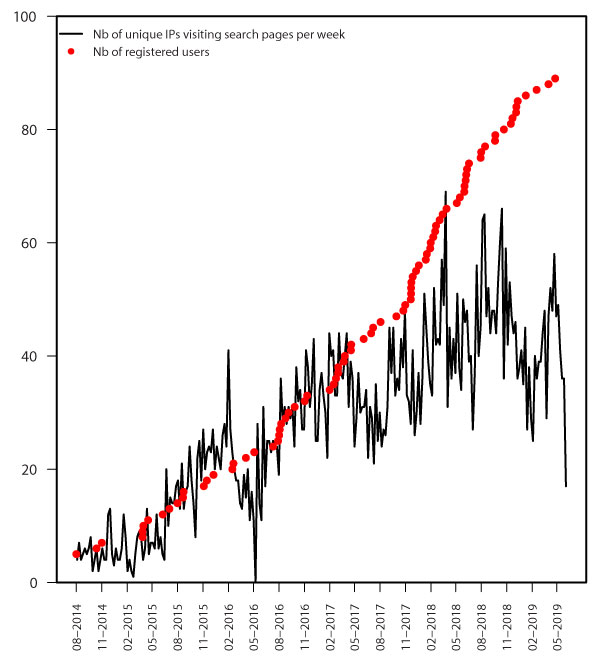
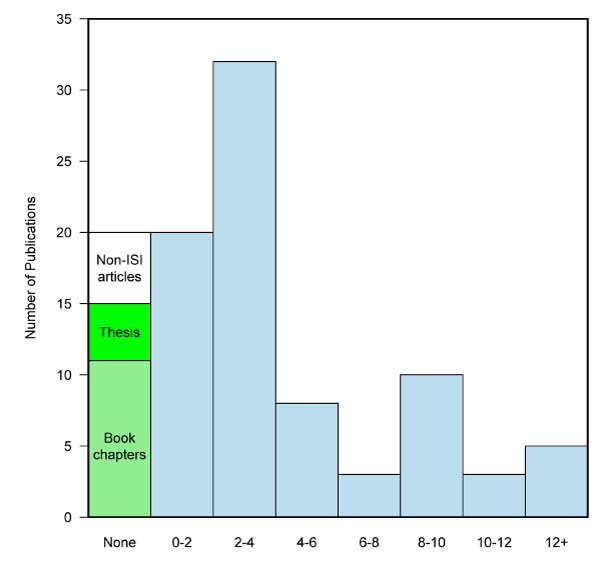
FIGURE 14. Histogram of publications using or about NSB, spread by Clarivate Analytics' Impact Factor (JIF, 2017).