FIGURE 1. Composite stratigraphic column of the John Day Formation with the Columbia River Basalt Group capping the section. Stratigraphic relationships and radiometric dates are based on Hunt and Stepleton (2004), Albright et al. (2008), and Fremd (2010). The black box encompasses the subunits that are considered lower Turtle Cove for the purposes of this study. Figure provided by the National Park Service.
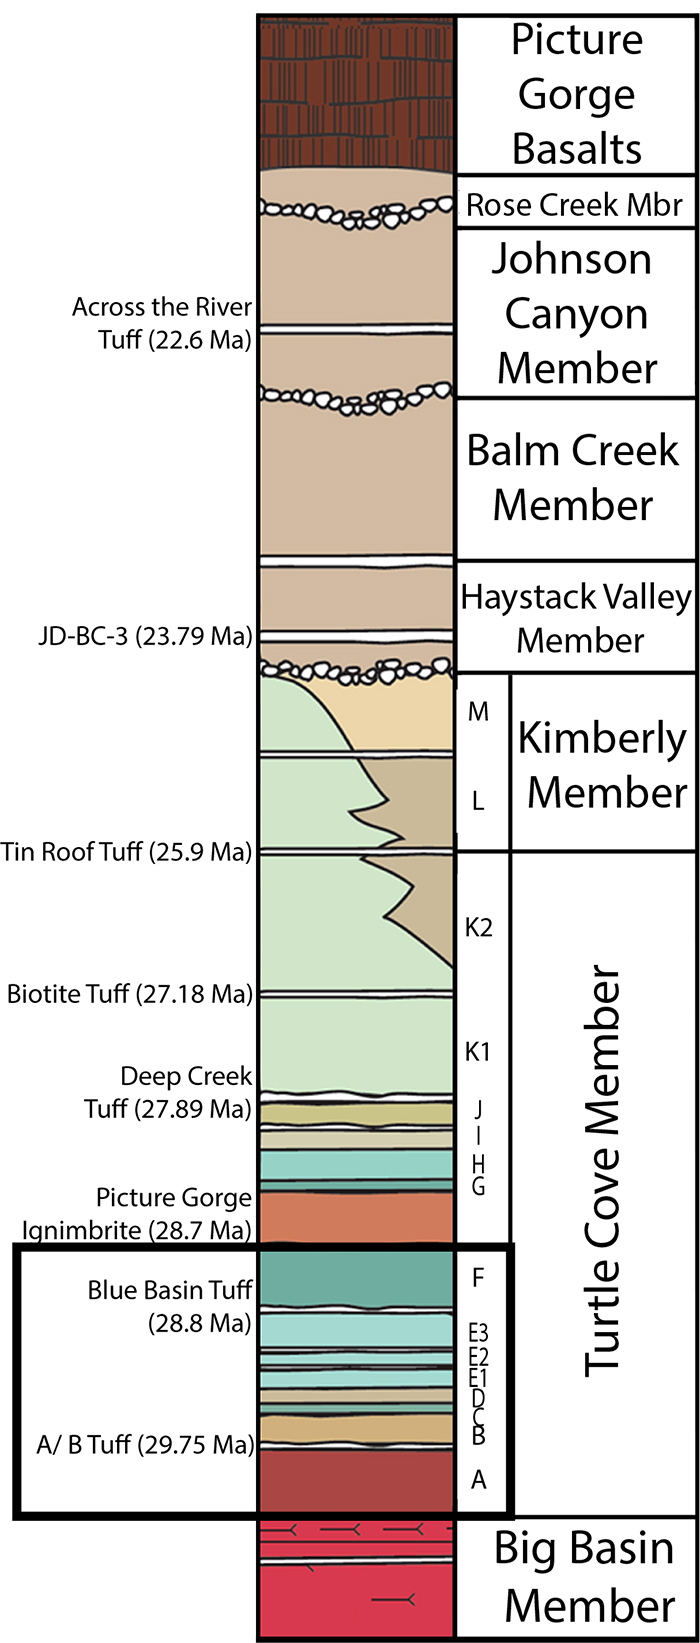
FIGURE 2. Map of Oregon showing the three park units (purple) and the extent of the majority of non-NPS sites worked by JODA paleontologists (green). There are museum collections at JODA from many sites in area highlighted in green. However, many of these sites have not been visited recently. Many of the sites with paleontological resources in the green area are found on lands administered or owned by partners and are scattered across the full area.
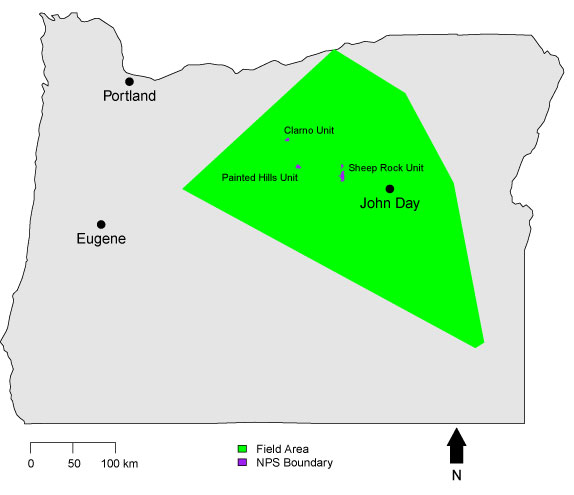
FIGURE 3. Map of locality data for cataloged specimens by year collected in one of the five main collection areas. Years correspond to cyclic prospecting schedule outlined in Table 1. Note the overlap between 1993 and 1994 and 1997 and 1998 contrary to the schedule shown in Table 1. Precise locality information is available to qualified researchers upon request from JODA’s museum program.
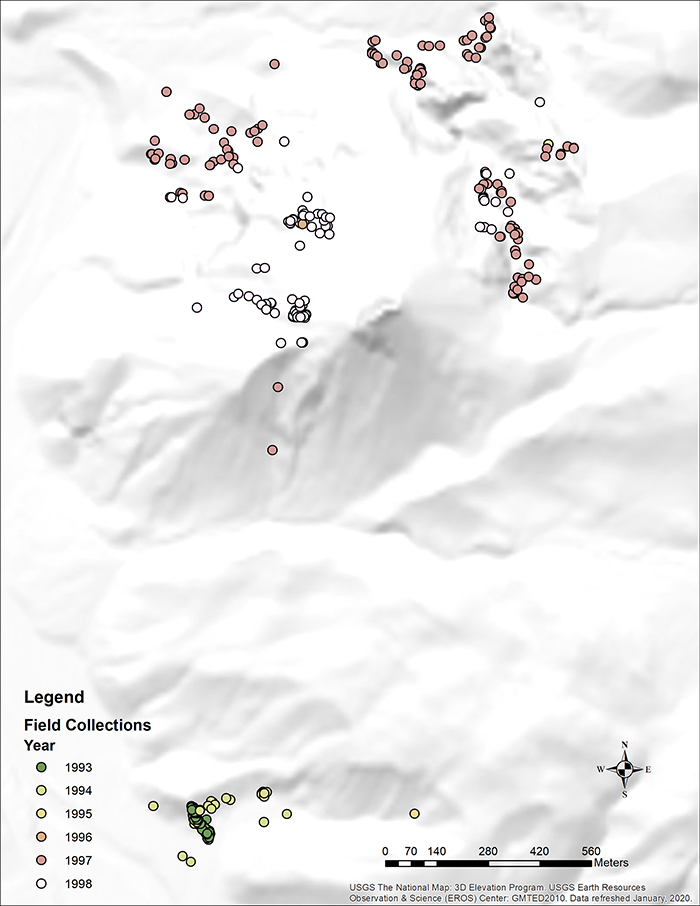
FIGURE 4. Aerial photograph with example measurements of T2.0” and L7.0”. Fieldworkers recorded locality data by locating their place on the air photograph, measuring inches from the top and inches from the left, and writing the air photograph number and measurements in field notes.
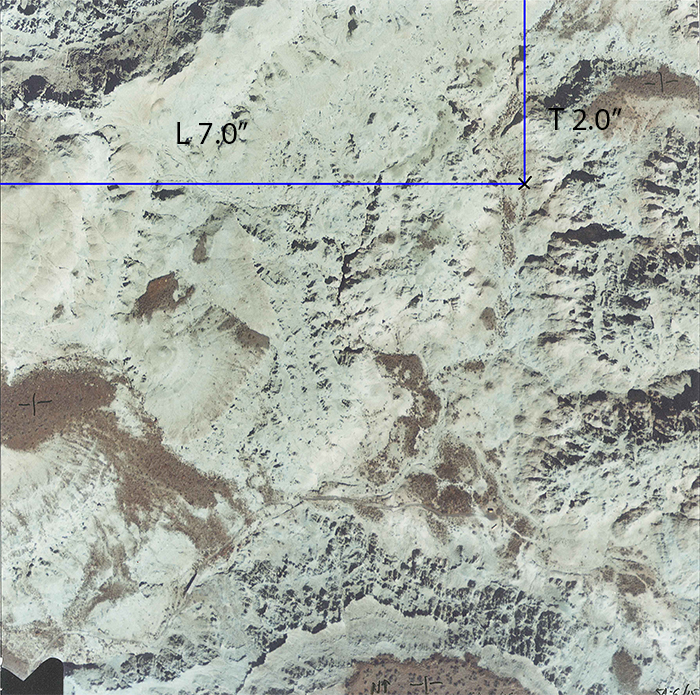
FIGURE 5. Map of field collection data for Test Area from 1999-2000. Each point represents one field number. Precise locality information is available to qualified researchers upon request from JODA’s museum program.
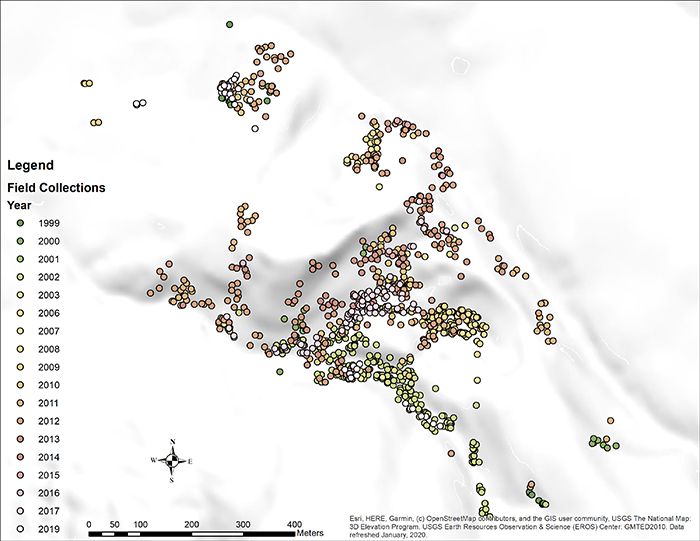
FIGURE 6. Map showing estimated collection area. Points are field localities and 15 meter buffer shows estimated prospecting areas for 2008 (yellow), 2009 (green), and 2010 (blue). Precise locality information is available to qualified researchers upon request from JODA’s museum program.
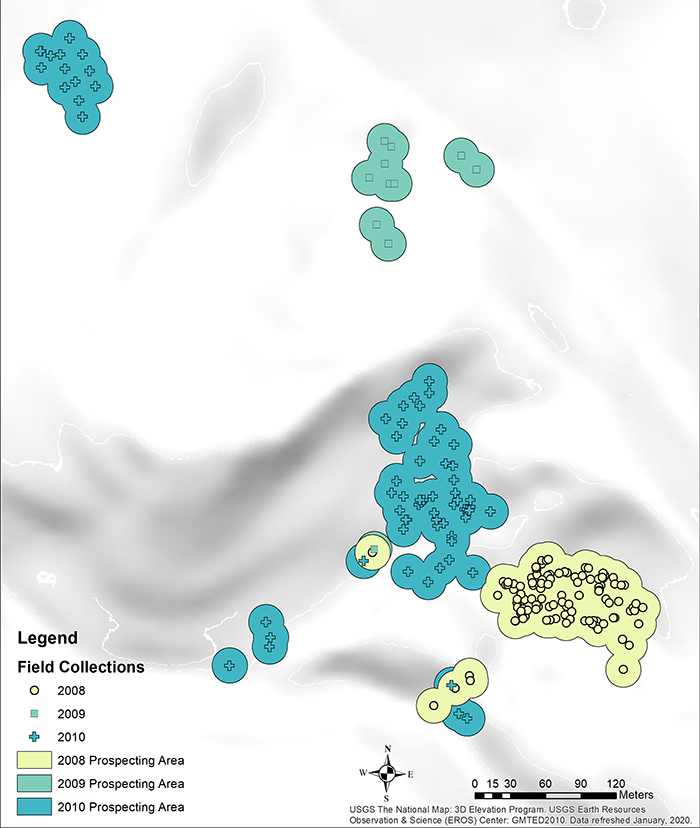
FIGURE 7. Boxplot of yield difference over area index by hiatus class. Note the median for each hiatus class is close to zero. This indicates similar amounts of collection between the earlier year and the later year regardless of the number of years the area has been left to erode.
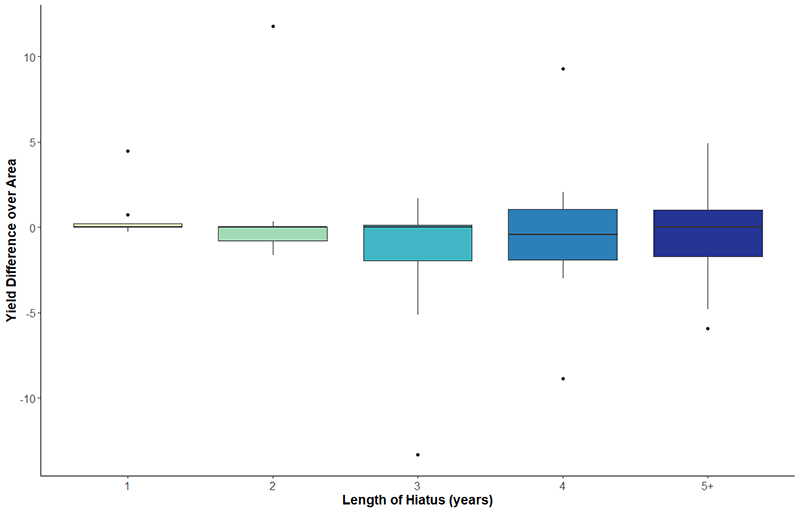
FIGURE 8. Boxplot of last yield over area index by hiatus length. Note the similar mean between all hiatus lengths.
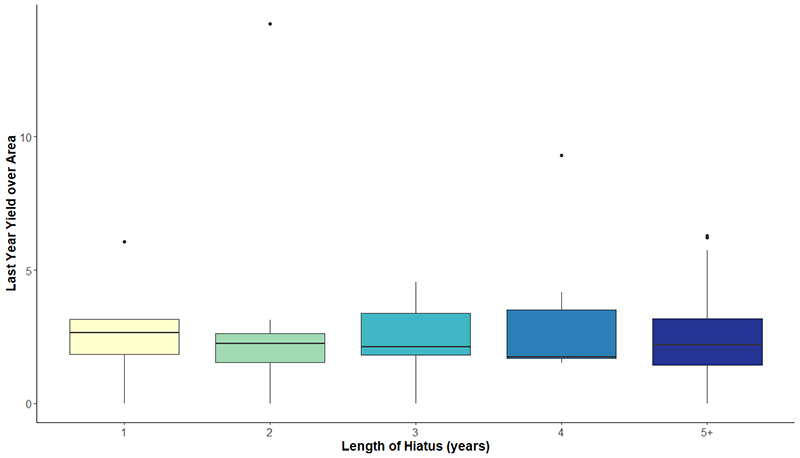
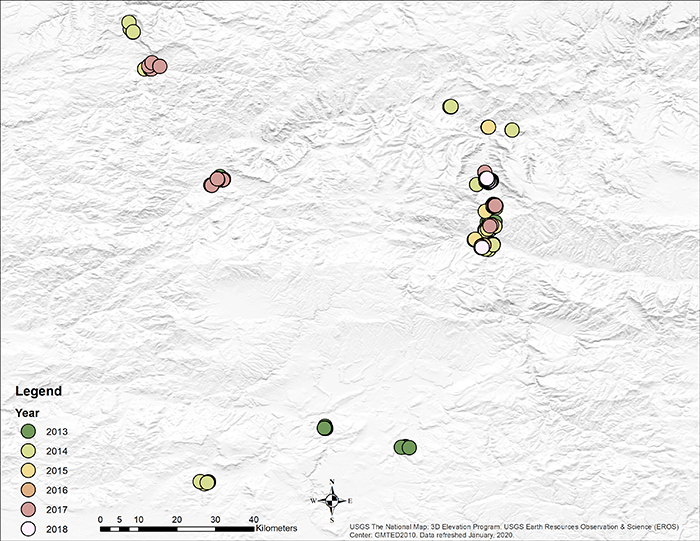
FIGURE 9. All field collections from 2013 - early 2019 to be used for tracking previous collection area. Points outside of JODA boundaries are BLM, USFS, or private localities. Precise locality information is available to qualified researchers upon request from JODA’s museum program.