FIGURE 1. Geological and biostratigraphical maps. A. The Shitangshan Section showing approximate stratigraphic distribution of Redlichia mansuyi and Redlichia mai (modified from Hu et al. 2010). B-D. Studied sections showing their approximate stratigraphic levels respectively in Wulongqing Formation. B. Huanglongqing Section. C. Longbaoshan Section. D. Xinglongcun Section. E. Map of Kunming showing the localities of studied sections. The red lines with arrows showing approximate sampling interbeds in each section.
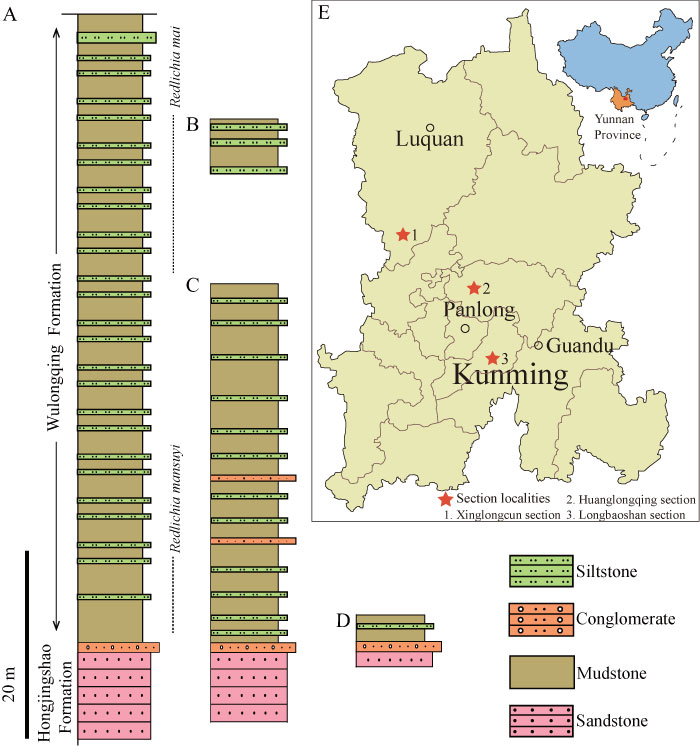
FIGURE 2. Reconstruction of the Palaeolenus douvilei cephalon showing chosen landmarks and semilandmarks. Blue outlines show semilandmarks placement. White arrows indicate semilandmarks trajectory. The black lines show the orientations which are following Whittington et al. (1997). Abbreviations: sag. - sagittal; tr. - transverse; exs. - exsagittal.
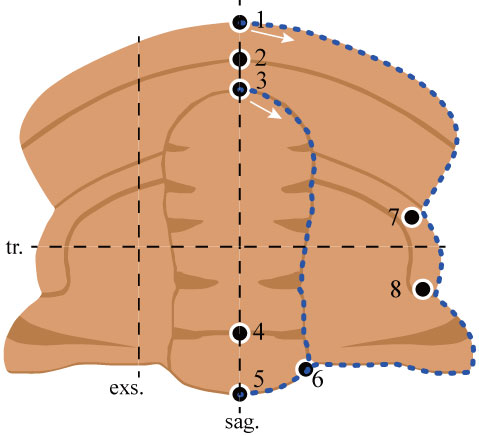
FIGURE 3. Plots of principal component analyses. A. Plot of PC1-PC2 space where two main clusters are identified. Cluster in more positive PC1 space contains Palaeolenus douvillei specimens and the cluster in more negative PC1 space contains Megapalaeolenus deprati specimens. Thin-plate spline indicates the extreme shape for each axis. B. Plot of PC2-PC3 space showing no distinct clusters. C. Plot of PC1-PC3 space showing two distinct clusters of the P. douvillei and M. deprati . Clusters are all bound by convex hulls of proposed taxa.
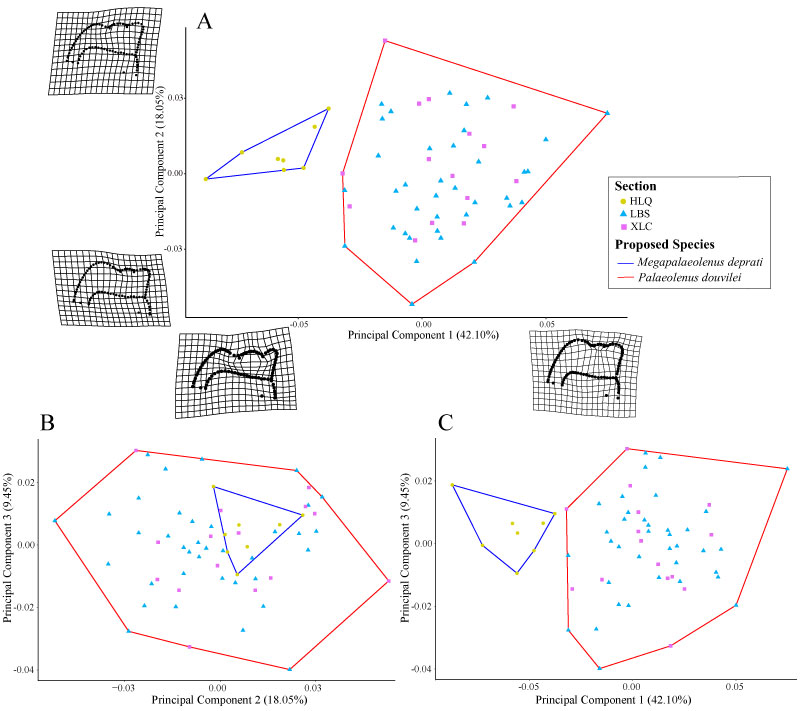
FIGURE 4. The log-centroid size against regressed Procrustes ANOVA scores plot indicates the distinct clusters of the Palaeolenus douvillei and Megapalaeolenus deprati . Clusters bound by convex hulls of taxa. Hollow circles around points indicate specimens with 13 tergites and hollow pentagons around points indicate specimens with at least 14 tergites.
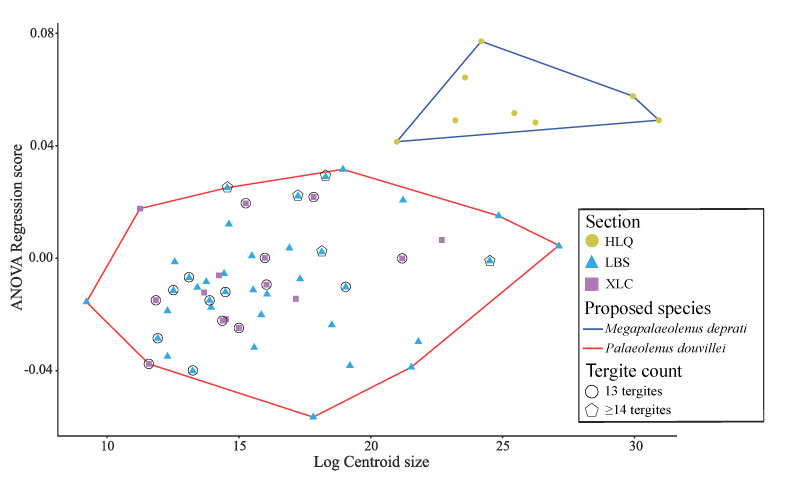
FIGURE 5. Articulated specimens of Palaeolenus douvillei from the Longbaoshan and Xinglongcun sections. A. LBS-548. B. XLC-1960. C. LBS-566. D. XLC-2000A. E. LBS-661A. F. LBS-151. G. XLC-0904. H. LBS-629. I. LBS-177. Scale bars equal 3 mm. White arrows indicate the thorax-pygidium boundary.
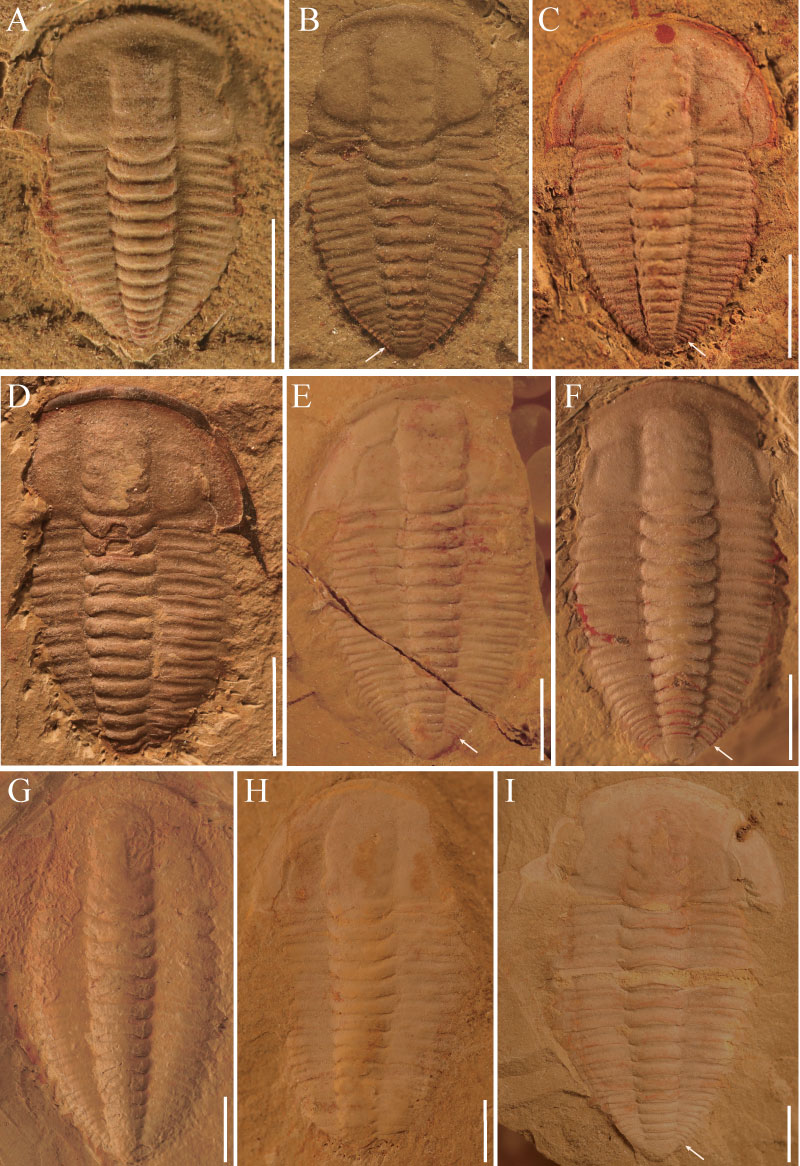
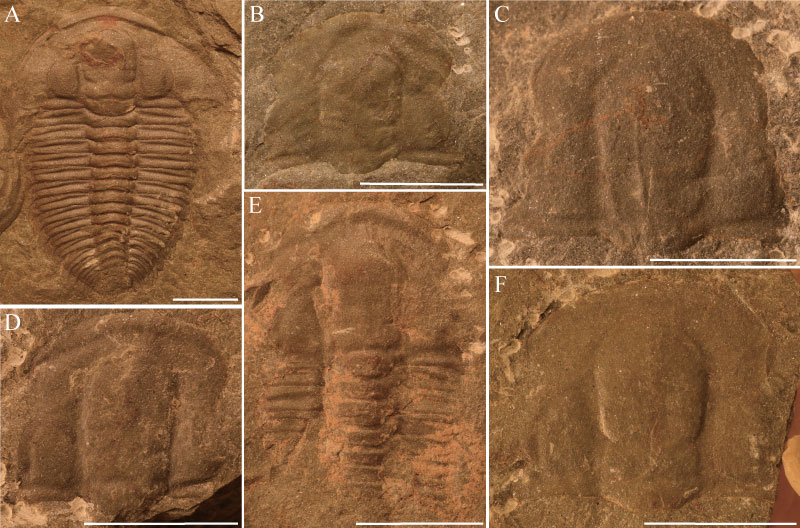
FIGURE 6. Articulated and disarticulated specimens of Megapalaeolenus deprati from the Huanglongqing Section. A. HLQ-39A. B. HLQ-19. C. HLQ-37. D. HLQ-50. E. HLQ-13. F. HLQ-33. Scale bars equal 5 mm.