FIGURE 1. Anterior skulls of rodents in lateral views illustrating anatomical protrogomorphy (A, Aplodontia rufa UMZC E1861), sciuromorphy (B Ischyromys douglassi USNM 617532; C Ratufa bicolor UMZC E1570), hystricomorphy (D Anomalurus beecrofti UMZC E1414), and myomorphy (E Platacanthomys lasiurus UMZC E1917). Red arrows indicate anterior margin of deep masseter attachment; blue arrows indicate the infraorbital foramen. Scale bars equal 5 mm.
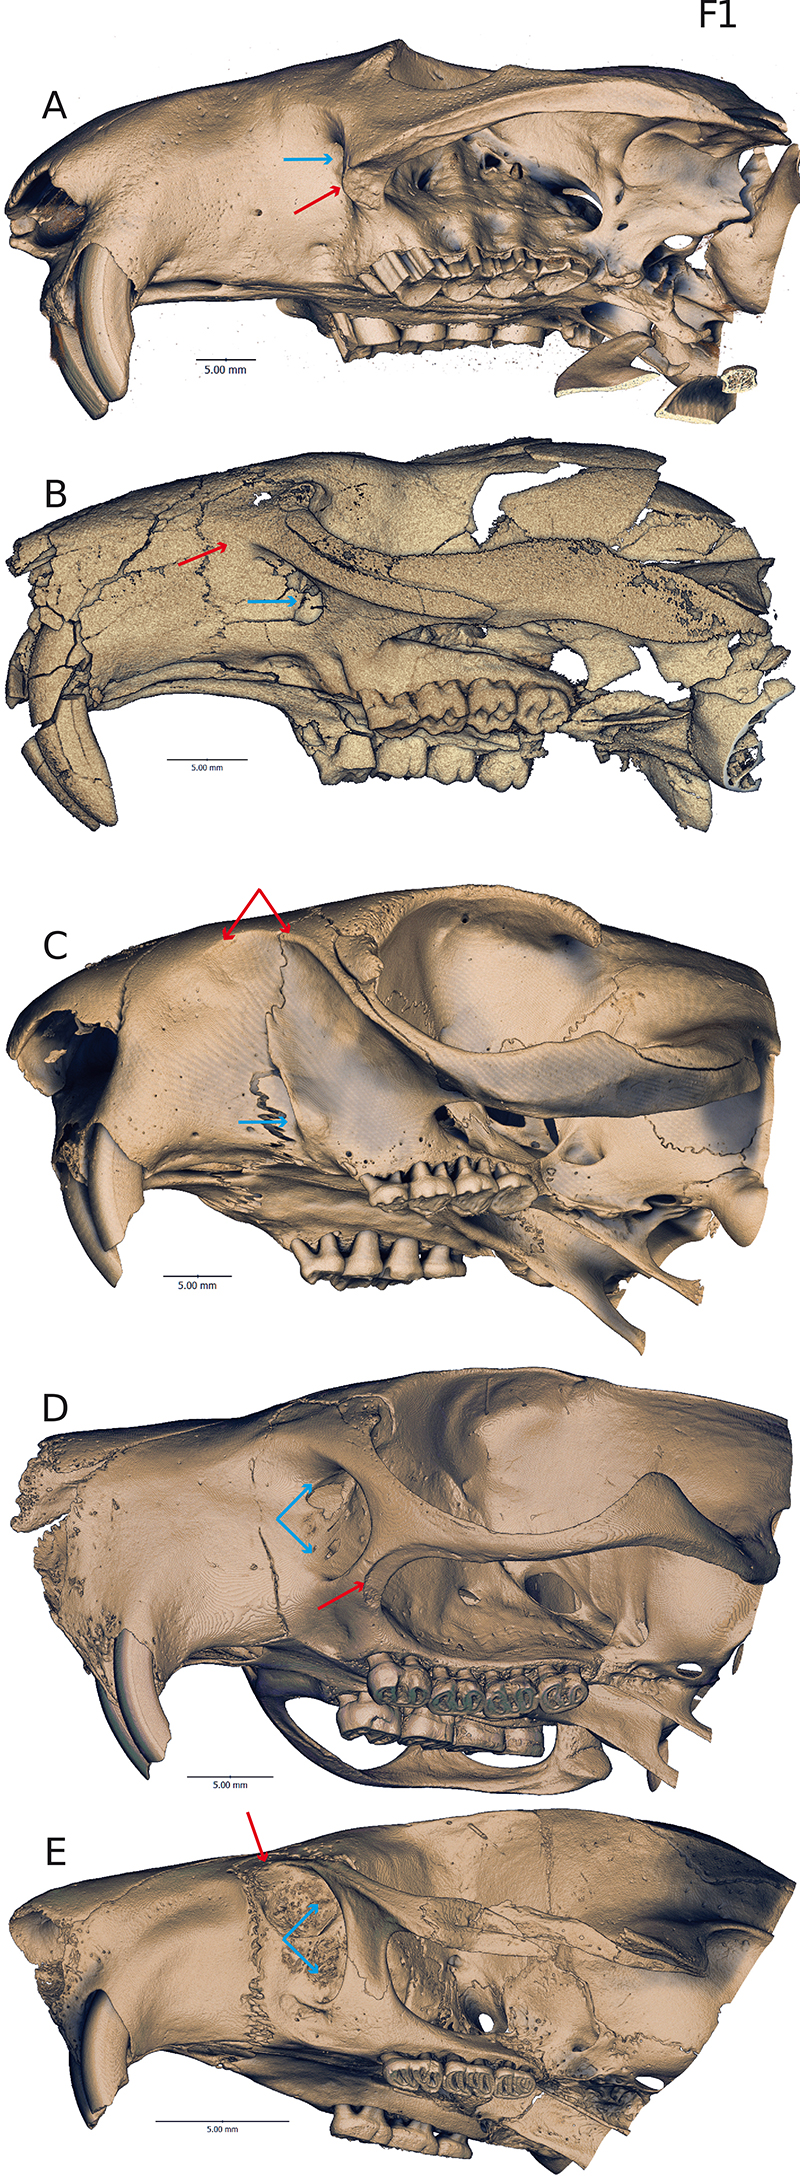
FIGURE 2. CT scan of USNM 617532 embedded in matrix (right) and virtually dissected (left). Scale bar equal 50 mm.
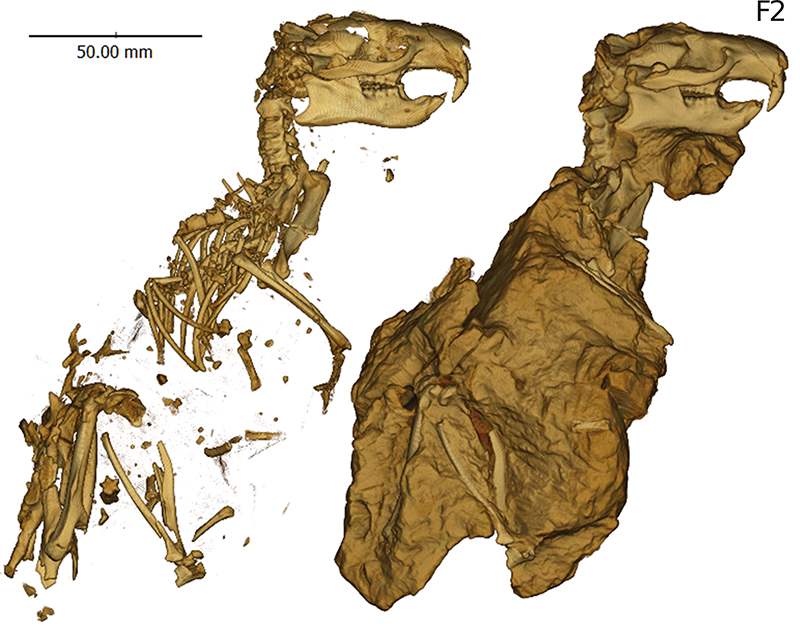
FIGURE 3. Occlusal (top), occlusal-lingual (middle) morphology of upper M1 and occlusal morphology of lower m2 (bottom) of IIschyromys douglassi (USNM 617532). Uppers: Ay, anterostyle; Enl, endoloph; H, hypocone; M, metacone; Mcu, metaconule; Mel, metaloph; Ms, mesostyle; P, protocone; Pa, paracone; Prl, protoloph; Psl, posteroloph; Py, parastyle. Lowers: Ald, anterolophulid; Am, anterior medial ("accessory") cusp; Ecd, ectolophid; Et, entoconid; Hd, hypoconid; Hld, hypolophulid; Med, metalophulid; Md, metaconid; Prd, protoconid; Psd, posterolophid; Psl, posteroloph. Scale bars equal 1 mm.
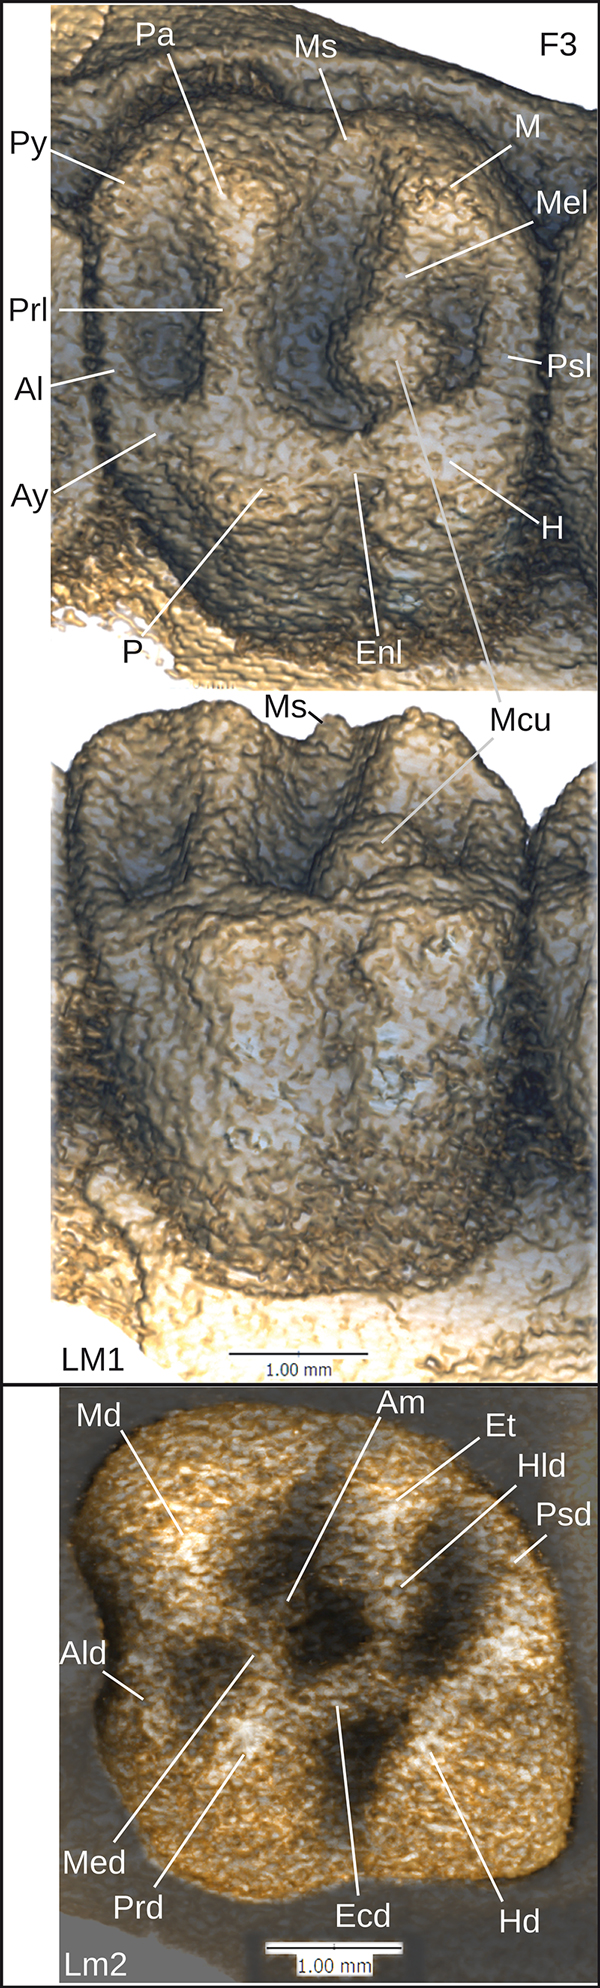
FIGURE 4. A) Graphic depictions of 3D landmarks on a skull of Arvicola amphibius (UMZC E2805). B) Wireframe graphs summarising the cranial shape variation explained by principal components (PCs) 1-4. The dotted line wireframe represents the mean cranial shape across the samples and the solid line wireframe represents the magnitude of shape change for a particular principal component (scale factor 0.1). The landmarks are numbered with descriptions provided in Table 2.
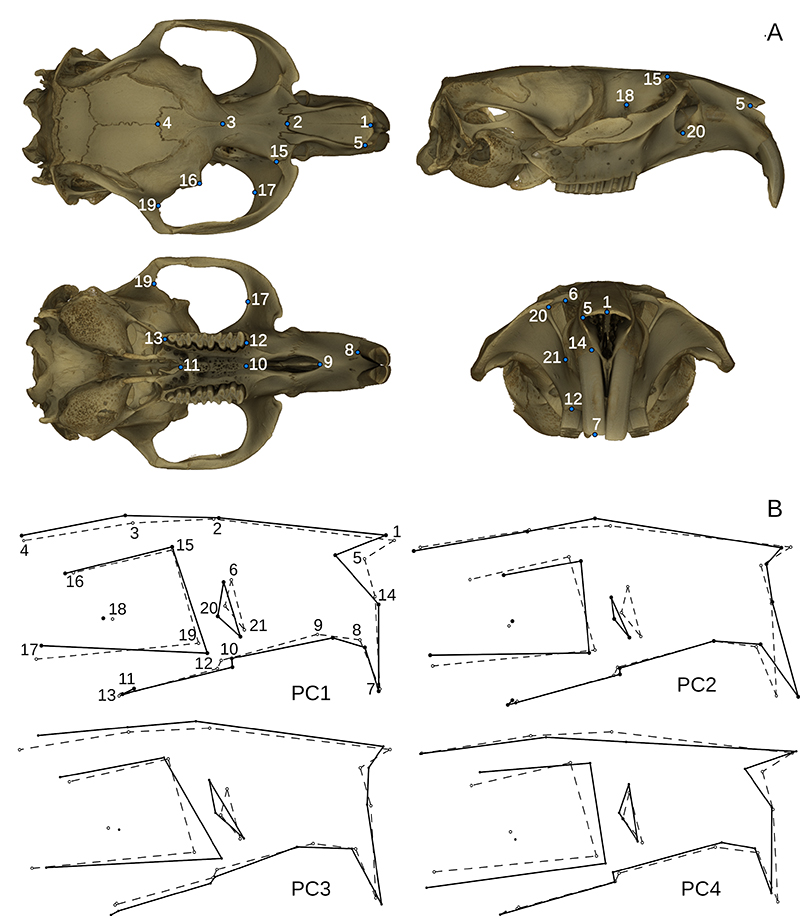
FIGURE 5. Lower (A, C) and upper (B, D) cheek teeth of Ischyromys douglassi from West Canyon Creek, Wyoming. Anterior is to left, buccal top. Am = anterior medial ("accessory") cusp. Scale bars equal 5 mm.
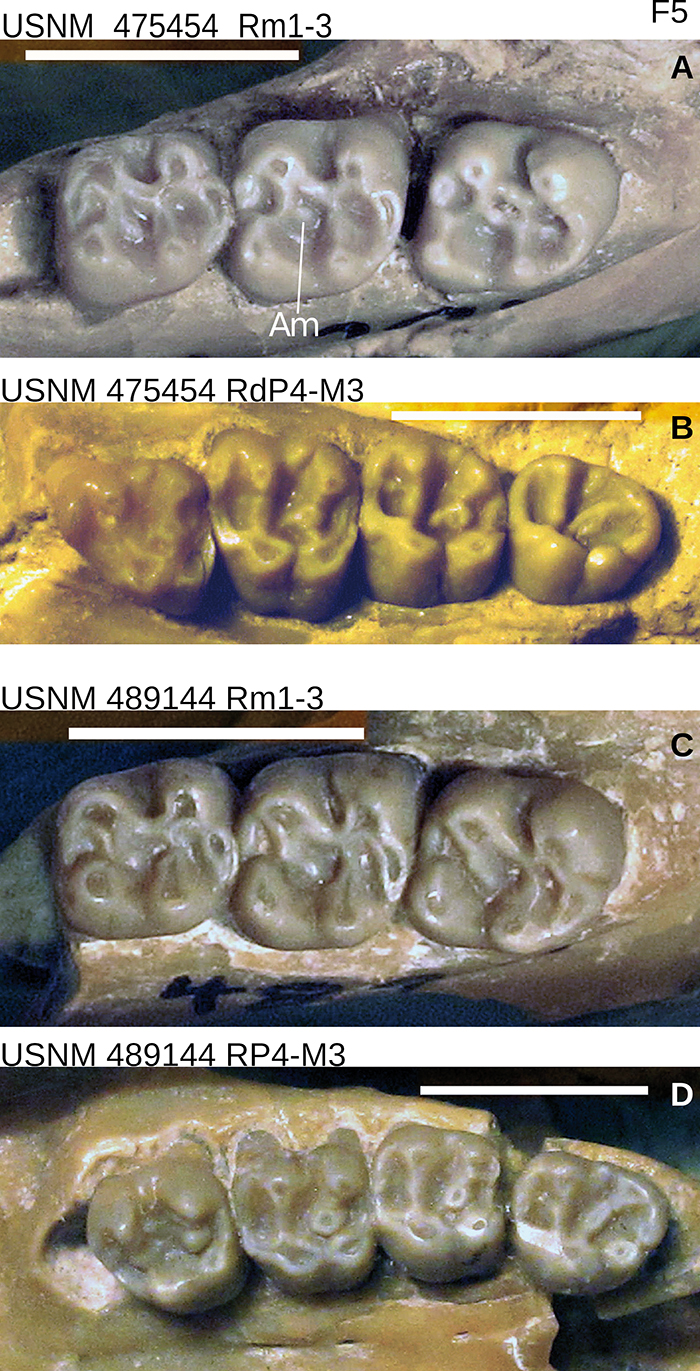
FIGURE 6. Left Upper (A-C, G-I) and left (D-F) and right lower (J-L) dentitions of Ischyromys douglassi USNM 617532 (A-F) and I. typus USNM 16828 (G-L). A, D, G, J show buccal, B, E, H, K show lingual, and C, F, I, L show occlusal views. Scale bars equal 1 mm.
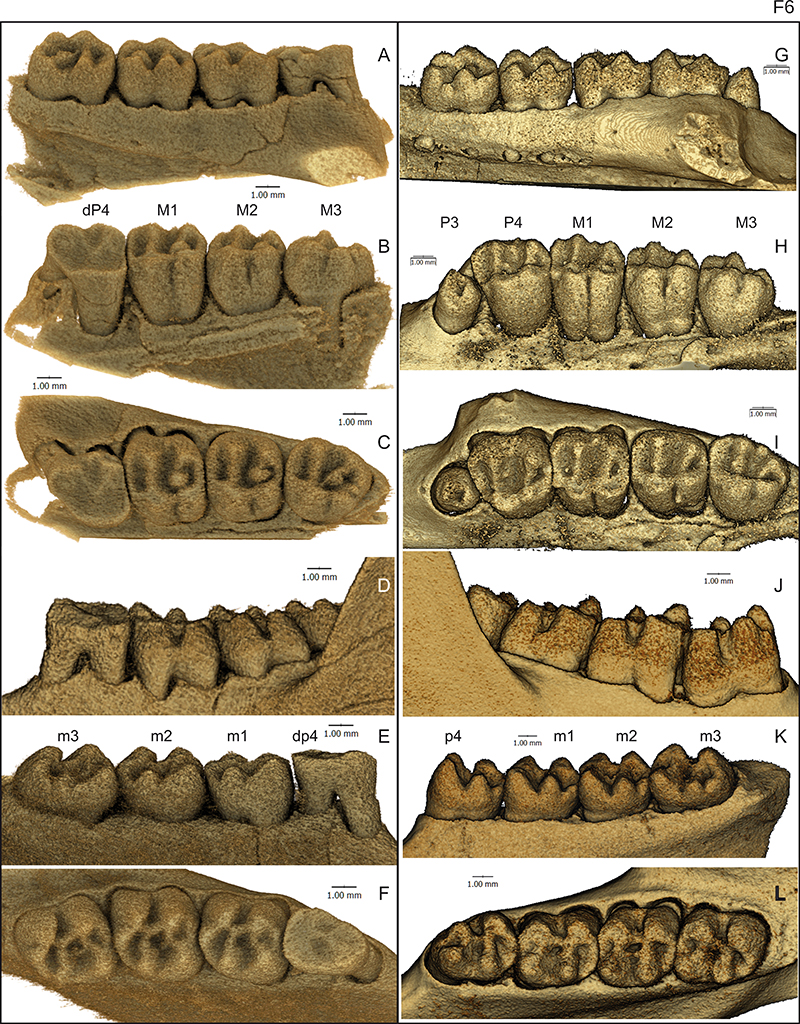
FIGURE 7. Skulls of Ischyromys douglassi USNM 617532 (A-D) and I. typus USNM 16828 (E-H). Arrows in C and G show attachments of deep masseter ventral to the infraorbital foramen (C); white arrows in D show fossae for the attachment of the buccinator muscle (left) and tendon of the superficial masseter (right). “sc” = sagittal crest, “zp” = zygomatic plate. Scale bars equal 5 mm.
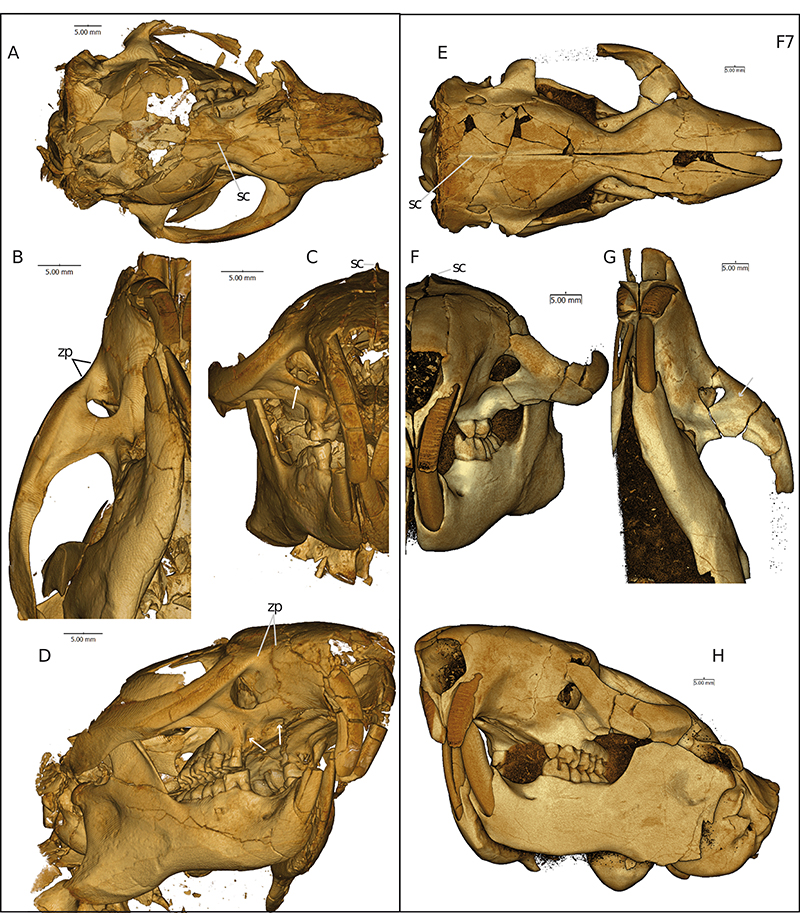
FIGURE 8. Ear region and associated foramina in Ischyromys douglassi (A-C, USNM 617532) and I. typus (D-F, ROM V1007). cf = carotid foramen, fc = fenestra cochleae, fv = fenestra vestibuli, icc = internal carotid canal, g-er = gap in epitympanic recess, sg = stapedial groove. Scale bars equal 5 mm.
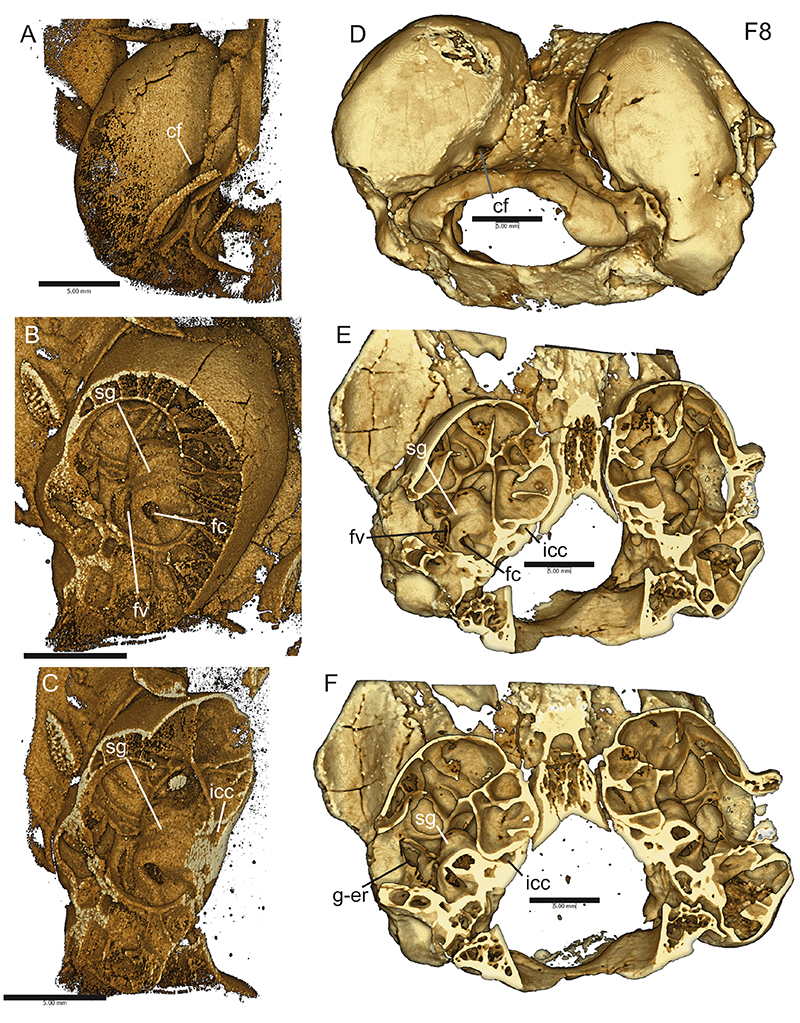
FIGURE 9. Cranial shape variation across the first two principal components. Boundaries have been superimposed onto extant rodents to indicate the space occupied by members of each anatomical condition of the masseter (inset) with wireframes to indicate general pattern of morphological change along each axis. Id = Ischyromys douglassi (USNM 617532), It = I. typus (USNM 16828), G = Gomphos elkema (MAE-BU 14467), L = Lepus californicus (UMZC E3941), P = Paradelomys crusafonti (UM ACQ6618).
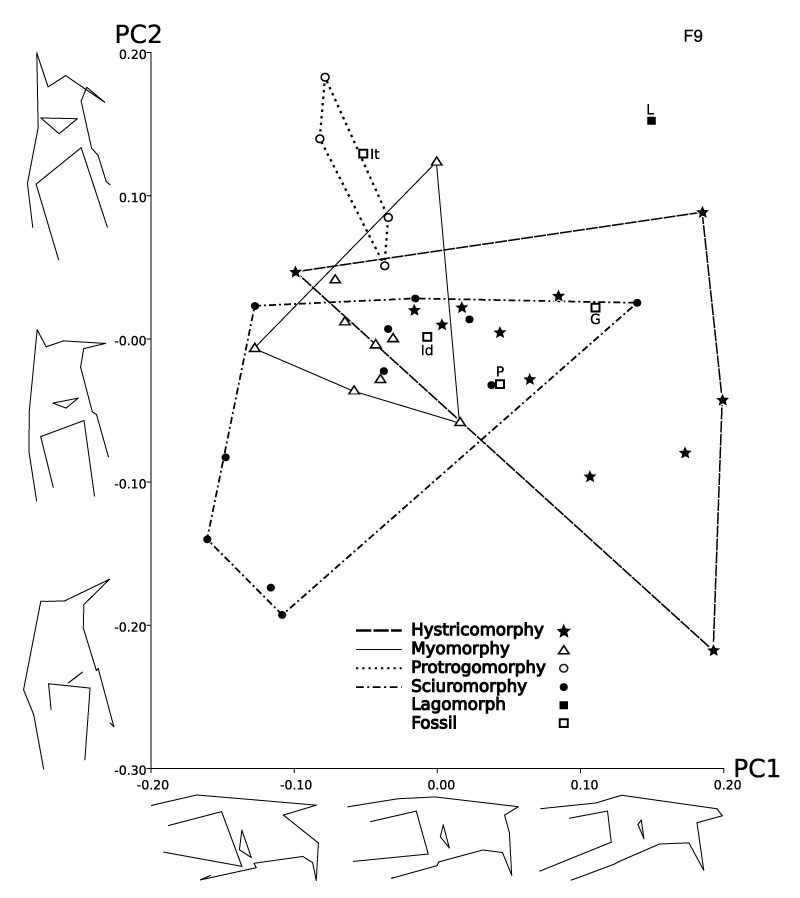
FIGURE 10. Cranial shape variation across the third and fourth principal components. Boundaries have been superimposed as in Figure 9 to indicate the space occupied by members of each anatomical condition of the masseter (inset). Abbreviations are as in Figure 9.
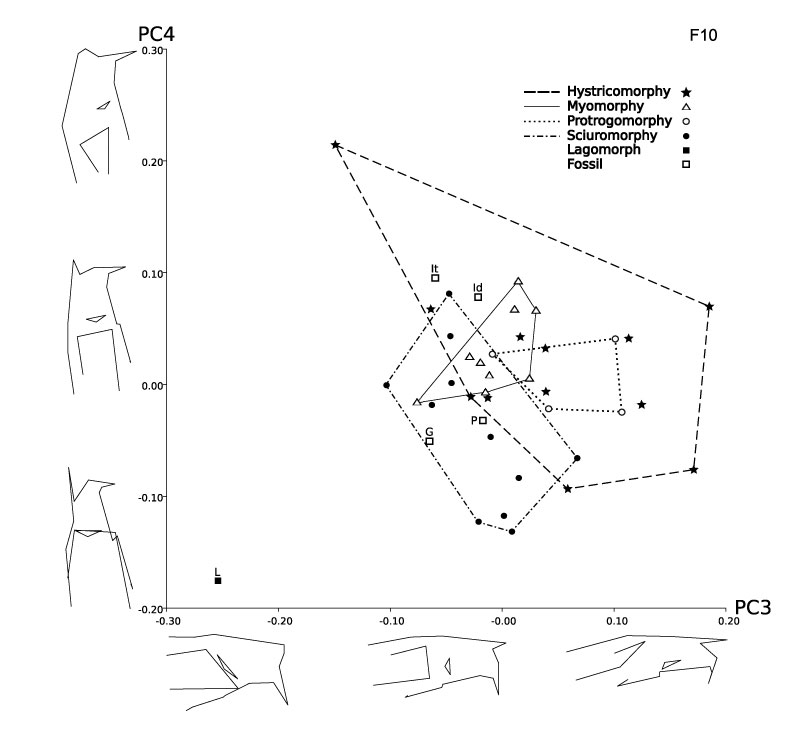
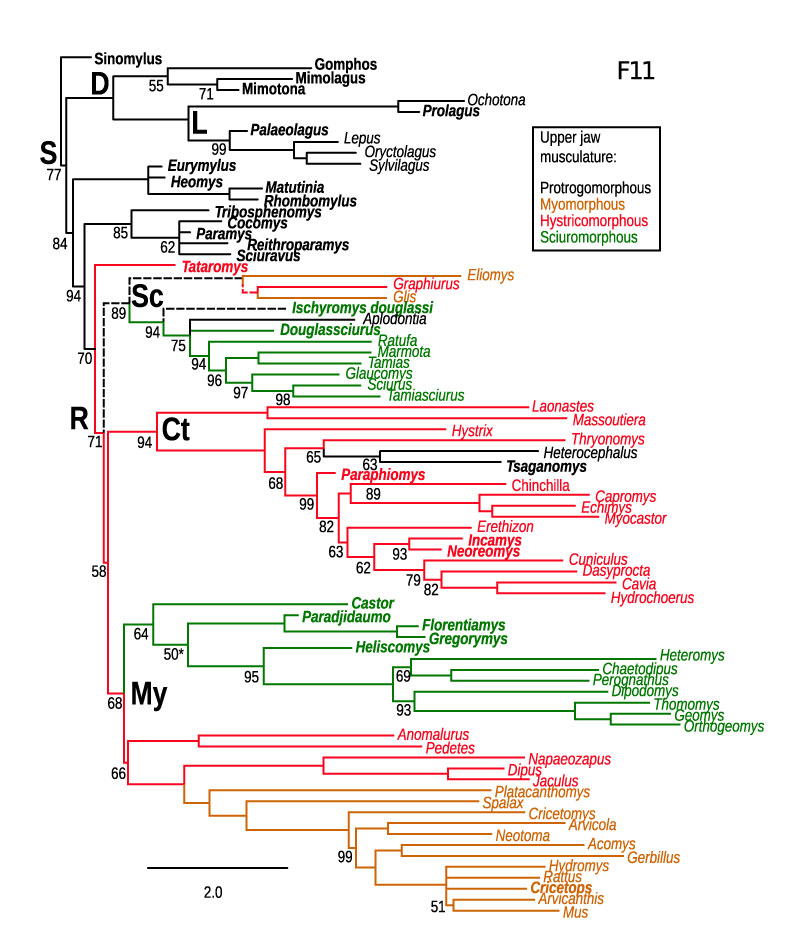
FIGURE 11. Bayesian phylogenetic estimate from Asher et al., (2019) derived from an alignment of eight nuclear and six mitochondrial genes concatenated with DNA indels and 219 morphological characters, comprised of majority rule consensus of 17500 post-burnin (50% of 35G generations sampling every 1000) topologies with posterior probabilities shown as percentages adjacent to each node. Only total group Glires are shown. Numbers adjacent to internal nodes show majority rule consensus across post-burnin trees (representative of Bayesian posterior probabilities); no number indicates 100%. Bold indicates fossils; branch lengths correspond to scale at bottom. Abbreviations are Ct for Ctenohystrica, D Duplicidentata, Gl Glires, L Lagomorpha, My Myomorpha, R Rodentia, S Simplicidentata, and Sc Sciuromorpha. Anatomically protrogomorphous taxa and parsimony-reconstructed branches are shown in black, myomorphous orange, hystricomorphous red, and sciuromorphous green. Unambiguous state reconstructions are shown with solid lines, ambiguous with dashed. Masticatory categories follow Maier and Schrenk (1987), Wang (1997), Meng et al. (2003), Marivaux et al. (2004), Wible et al. (2005), Hautier et al. (2008), Cox and Faulkes (2016), and this paper.