FIGURE 1. Genus richness (corrected sampled-in-bin diversity, CSIB) during the LPIA with all clades combined, and gastropods, bivalves, and brachiopods plotted separately. Mean sea-surface temperature (SST) after Song et al. (2019). The two main phases of the glaciation indicated with snowflakes.
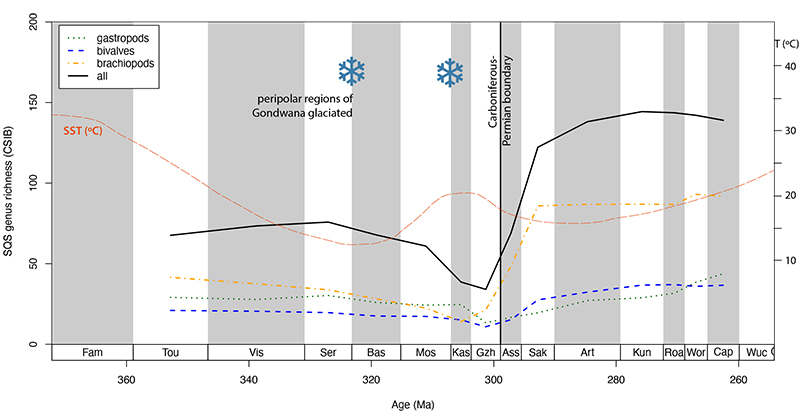
FIGURE 2. Turnover rates during the LPIA with clades plotted individually and merged. Mean sea-surface temperature (SST) after Song et al. (2019). The two main phases of the glaciation indicated with snowflakes.
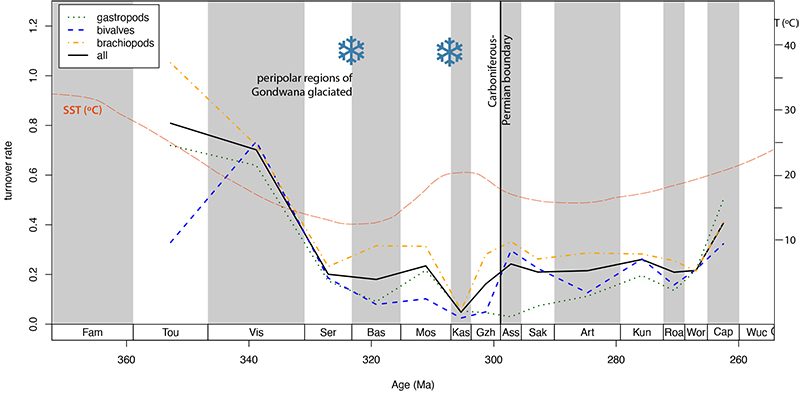
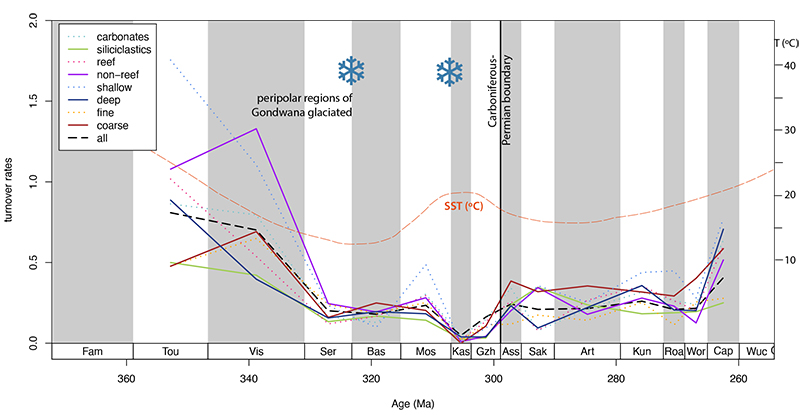
FIGURE 3. Turnover rates for the compared environments merged (also see Appendix 12 with single panels for environments). Mean sea-surface temperature (SST) after Song et al. (2019). The two main phases of the glaciation indicated with snowflakes.