FIGURE 1. Feeding strategies of extant marine mammal predators (from Kienle et al., 2017) with the addition of grazing (sirenians, authors’ work).
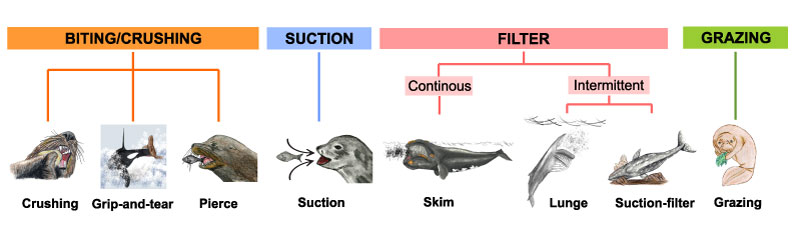
FIGURE 2. Anatomical features associated with biting (pierce, grip-and-tear, and crushing) feeding. 1: Crushing in sea otter (Enhydra lutris skull, from Lawlor, 1979), 2: Grip-and-tear in leopard seal (Hydruga leptonyx skull, authors’ work), 3: Pierce in Southern sea lion, (Otaria byronia skull, authors’ work) and in Amazon river dolphin (Inia geoffrensis skull, authors’ work).
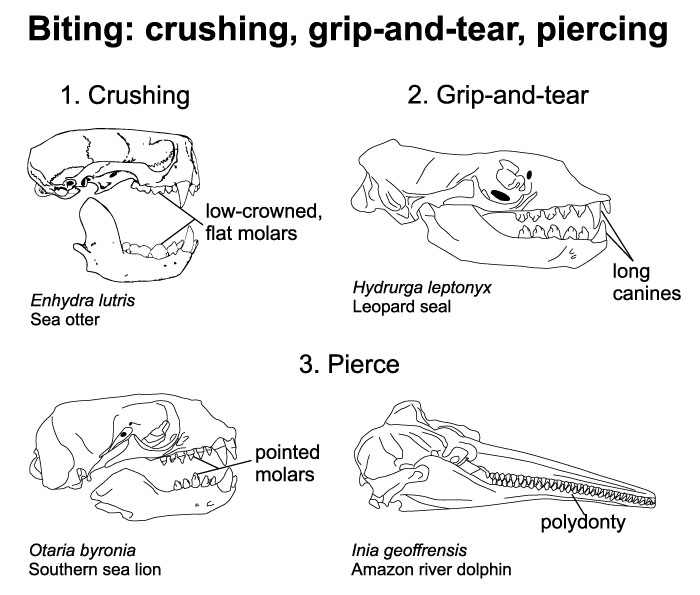
FIGURE 3. Anatomical features associated with suction feeding in walrus (Odobenus rosmarus skull, from Jefferson et al., 2015) and North Sea beaked whale (Mesoplodon bidens skull, authors’ work).
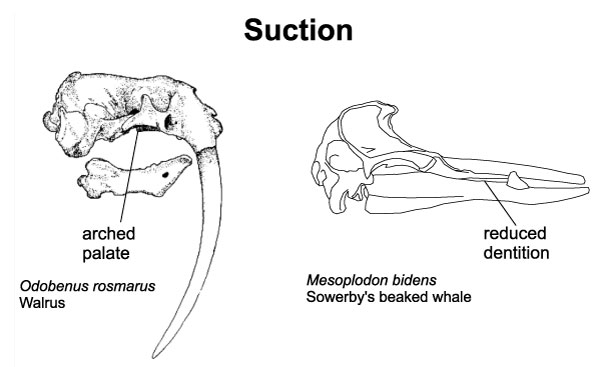
FIGURE 4. Anatomical features associated with filter feeding in crabeater seal (Lobodon carcinophaga skull, public domain image), and gray whale (Eschrichtius robustus skull, authors’ work).
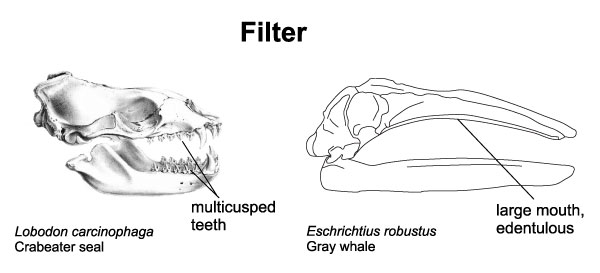
FIGURE 5. Anatomical features associated with grazing in African manatee (Trichechus senegalensis skull, from Werth, 2000), Desmostylia (Paleoparadoxia skull, public domain), and aquatic sloth (Thalassocnus sp. skull, modified from de Muizon et al., 2004).
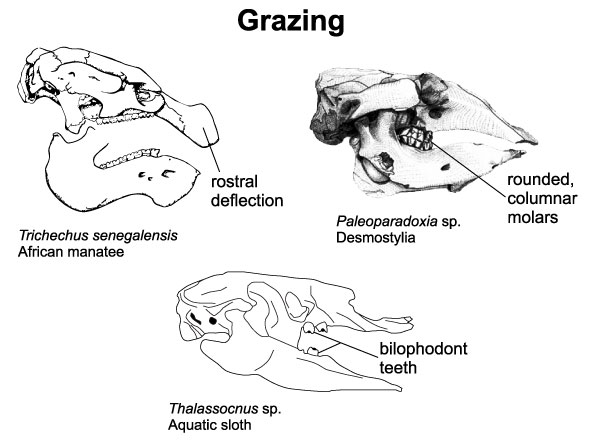
FIGURE 6. Generic level diversity of marine mammal groups through time. Dashed vertical lines: black, epoch boundaries; gray, age boundaries. All silhouettes used in the following figures are the authors’ own work.
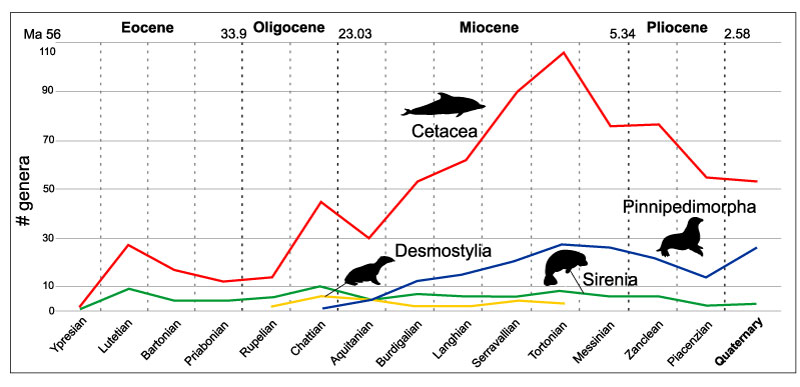
FIGURE 7. Pinnipedimorpha stem taxa and familial level diversity through time. “Stem-Pinnipedimorpha” includes all stem taxa that are not included in Desmatophocidae and the three extant groups. Dashed vertical lines: black, epoch boundaries; gray, age boundaries.
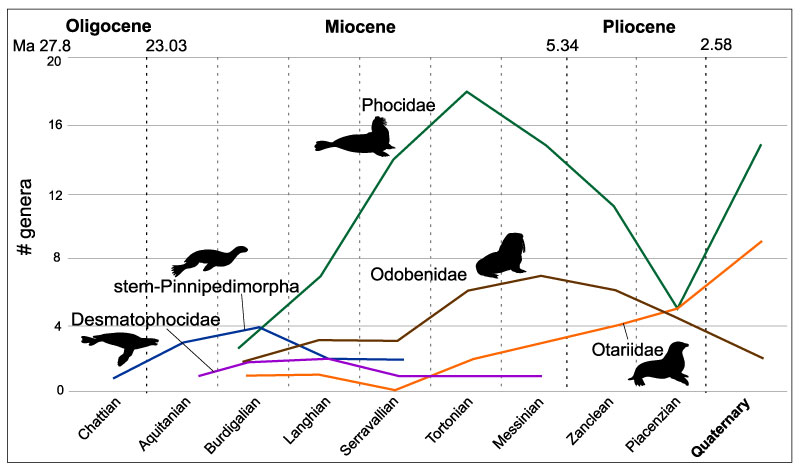
FIGURE 8. Cetacean stem and Neoceti taxa diversity through time. “Archaeoceti” includes all stem taxa that are not included in the two extant groups. Dashed vertical lines: black, epoch boundaries; gray, age boundaries.
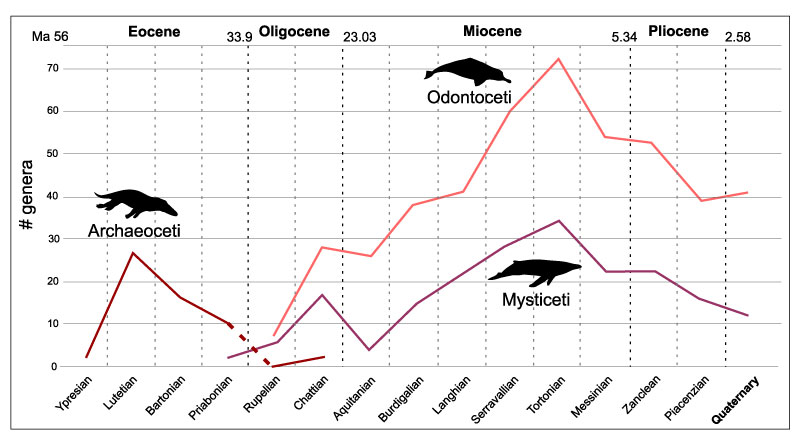
FIGURE 9. Mysticeti stem and familial level diversity through time. “Cetotheriidae s.l.” is a paraphyletic group including all taxa that belong to crown Mysticeti but are not grouped with any of the four living families. Dashed vertical lines: black, epoch boundaries; gray, age boundaries.
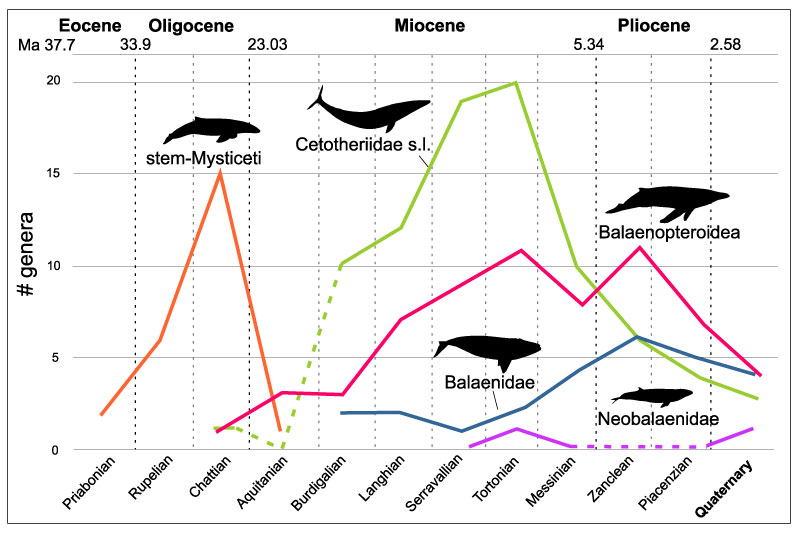
FIGURE 10. Odontoceti stem and familial level diversity through time. The group “Delphinoidea” includes Delphinidae, Monodontidae, and Phocoenidae, as well as extinct members of this crown group of uncertain phylogenetic placement. The “river dolphins” closely related to these taxa (Inioidea and Lipotidae) are plotted separately to emphasize their diversity in the fossil record compared to the present. “Ziphioidea” includes Ziphiidae and closely related stem taxa as identified by Bianucci et al. (2016). Dashed vertical lines: black, epoch boundaries; gray, age boundaries.
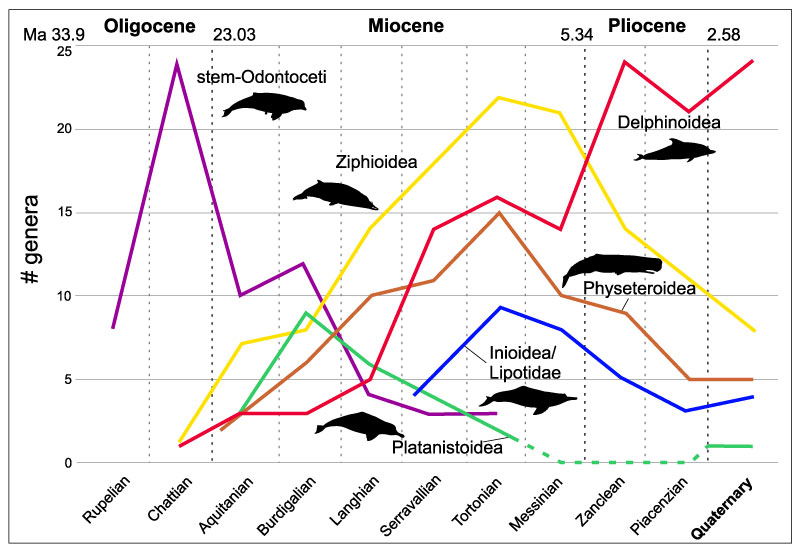
FIGURE 11. Sirenia stem and familial level diversity through time. “Protosirenidae / Prorastomidae” includes all taxa that are not included in the two extant groups. Dashed vertical lines: black, epoch boundaries; gray, age boundaries.
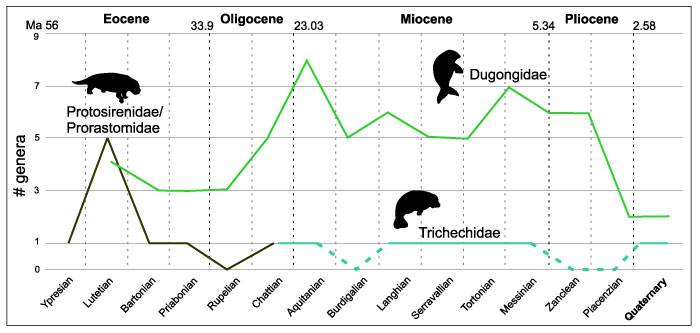
FIGURE 12. Hypothesized ecological replacement of desmostylians (circles) by sirenians (squares) in the North Pacific Ocean. On the top, map of the localities of Tortonian age (11 Ma) where desmostylian and sirenian were recorded. On the bottom, map of the localities of Zanclean age (5 Ma) where sirenians were recorded. Desmostylia disappear from the fossil record by the end of the Tortonian (7.2 Ma) when sirenians, particularly Hydrodamalis spp., start colonizing this region, likely feeding on the same resources. Only one occurrence per genus is reported in each locality. Locality data for each occurrence of Desmostylia and Sirenia in the Tortonian and Zanclean were downloaded from the Paleobiology Database using the search parameters described in Materials and Methods and then plotted on the map.
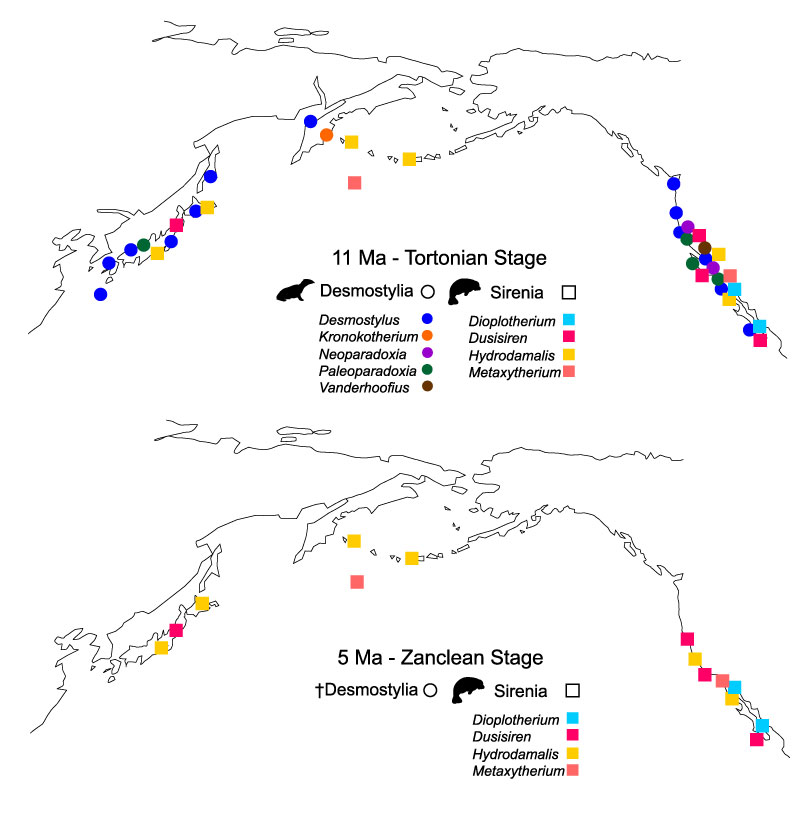
FIGURE 13. Comparison of Otariidae (fur seals and sea lions) diversity with diatom species diversity (productivity), δ18O values from benthic foraminifers (mean ocean temperature), and sea level changes. Diatom species data: downloaded from Neptune database (https://nsb-mfn-berlin.de) on 03-05-2018; δ18O values: from Prokoph et al. (2008) (raw data from Zachos et al., 2001, “benthic foraminifera” and “deep sea” series); sea level data: from Miller et al. (2005).
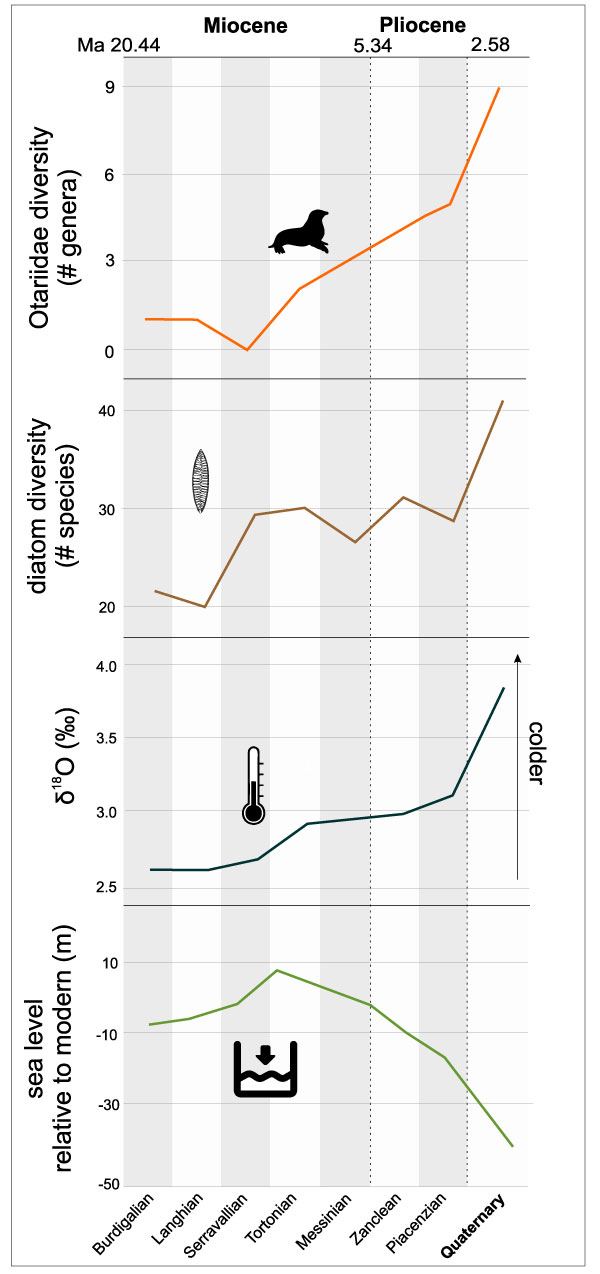
FIGURE 14. Comparison of cetacean, mysticete, and odontocete diversity with diatom species diversity (productivity) and δ18O values from benthic foraminifers (mean ocean temperature). Diatom species data and δ18O values are from the same sources as in Figure 13.
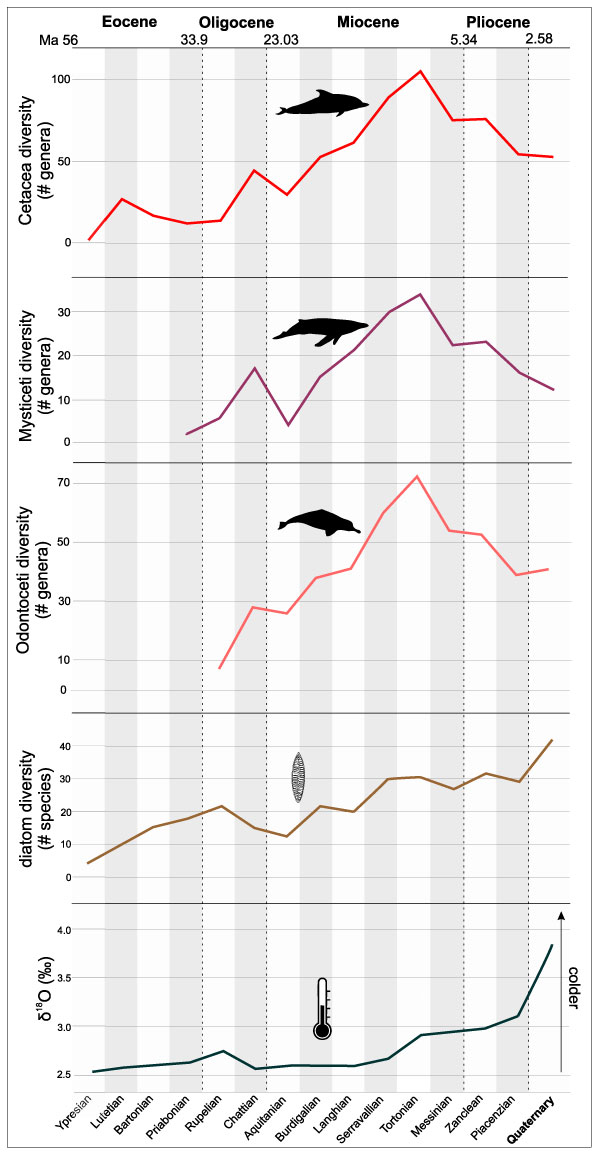
FIGURE 15. Comparison of Sirenia (manatees and dugongs) and Desmostylia diversity with δ18O values from benthic foraminifers (mean ocean temperature) and sea level changes. δ18O values and sea level change data are from the same sources as in Figure 13.
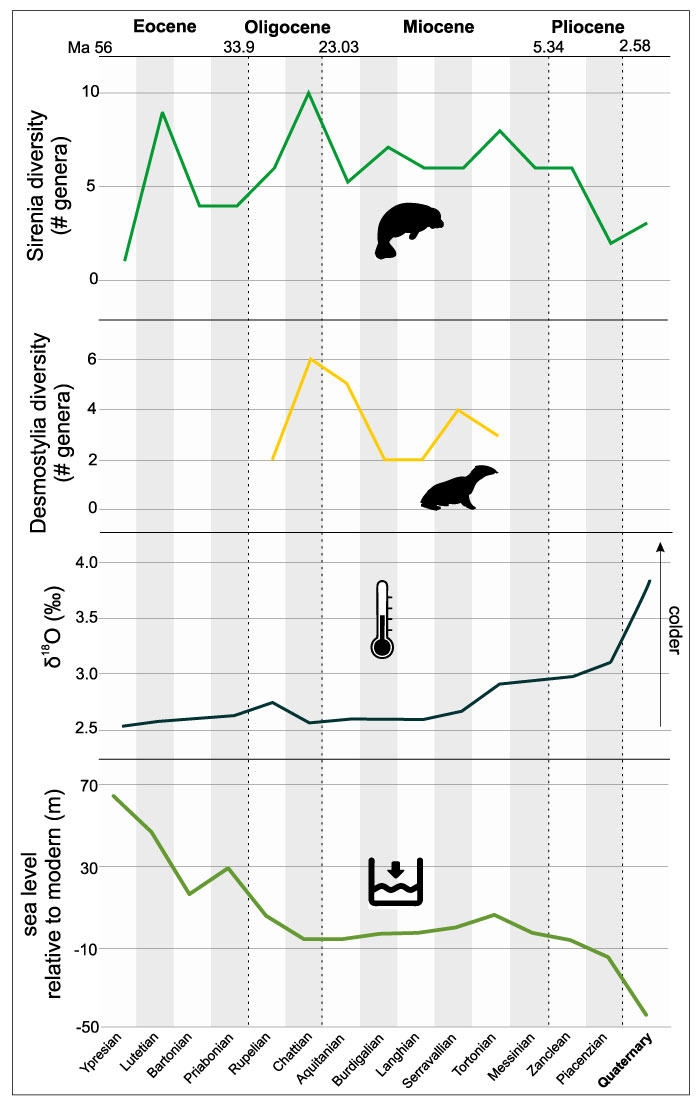
FIGURE 16. Ancestral state reconstruction of prey capture strategies and tooth pattern and cusp shape in Odobenidae. Topology follows Berta et al. (2018). Details on the tree can be found in Appendix 1. All data matrices and complete trees with branch lengths can be found in the Supplementary Information uploaded to Dryad repository (https://doi.org/10.6086/d14671).
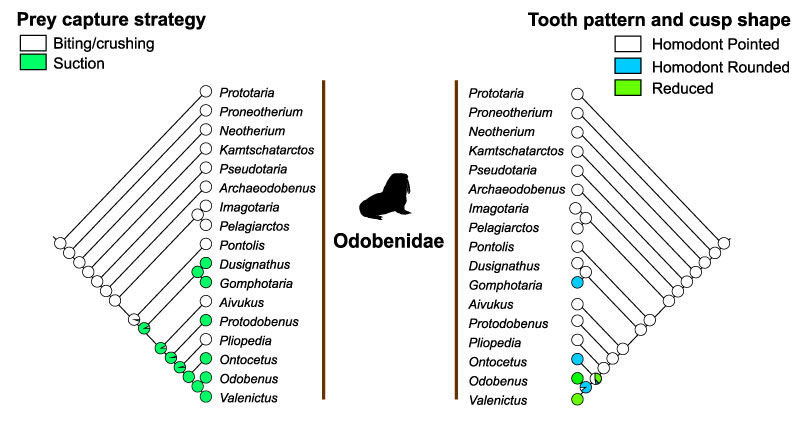
FIGURE 17. Ancestral state reconstruction of prey type preference in stem and crown Pinnipedimorpha. Topology follows Rybczynski et al. (2009), Dewaele et al. (2017), and Berta et al. (2018). Details on the tree can be found in Appendix 1. All data matrices and complete trees with branch can be found in the Supplementary Information (https://doi.org/10.6086/d14671).
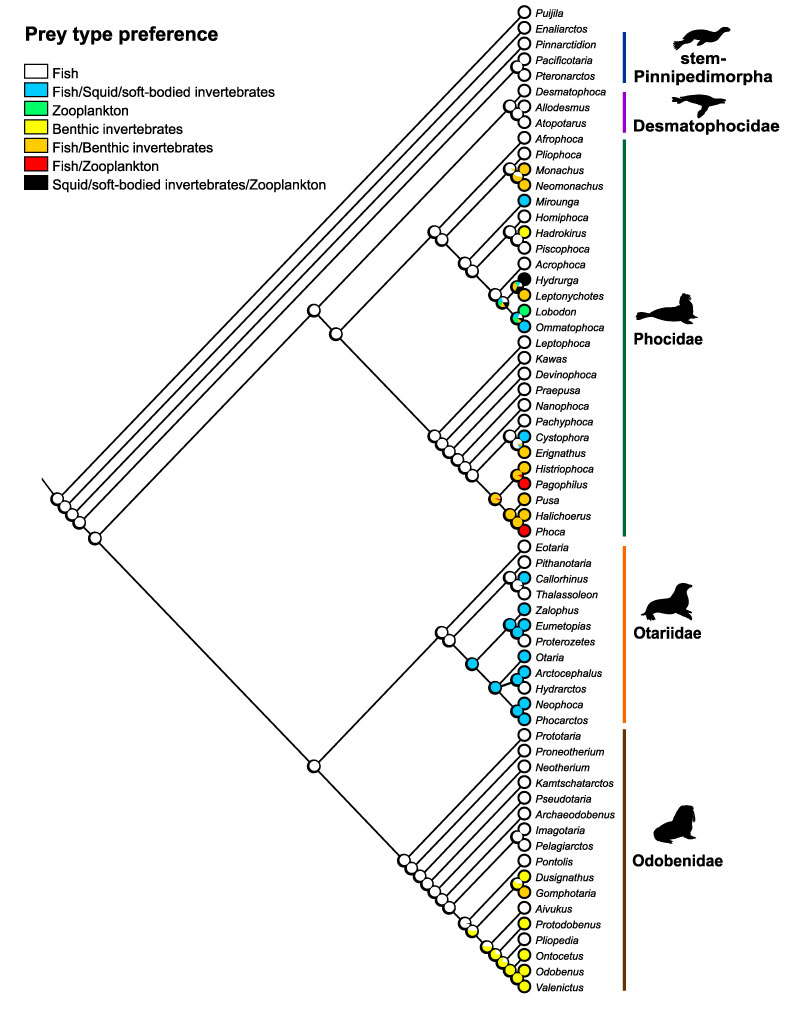
FIGURE 18. Ancestral state reconstruction of prey capture strategies and prey type preference in stem and crown Mysticeti. Topology follows Gatesy et al. (2013) and Fordyce and Marx (2018). Details on the tree can be found in Appendix 1. All data matrices and complete trees with branch lengths can be found in the Supplementary Information (https://doi.org/10.6086/d14671).
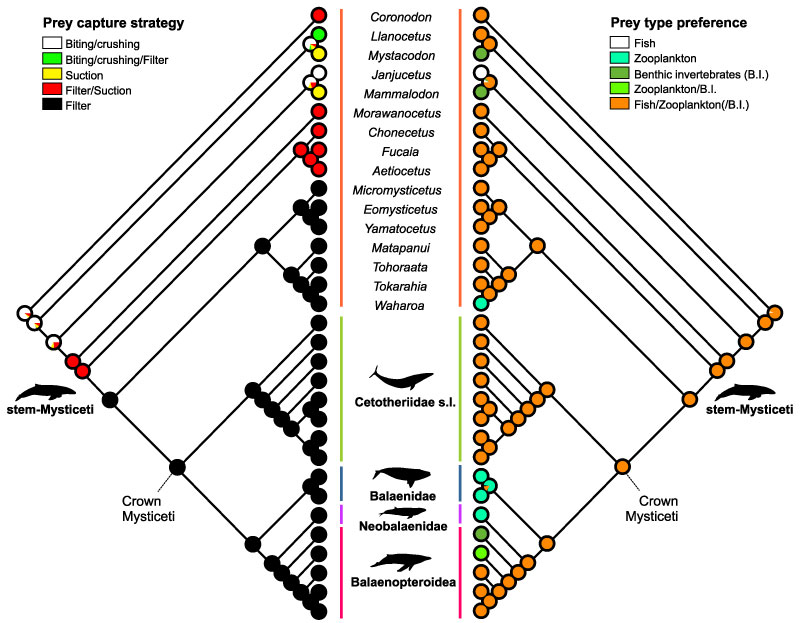
FIGURE 19. Ancestral state reconstruction of prey capture strategies and tooth pattern and cusp shape in stem Odontoceti. Topology follows Gatesy et al. (2013) and Boessenecker et al. (2017). Details on the tree can be found in Appendix 1. All data matrices and complete trees with branch lengths can be found in the Supplementary Information (https://doi.org/10.6086/d14671).
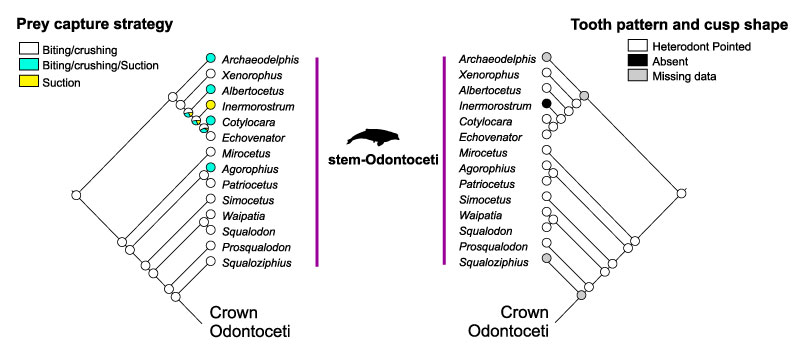
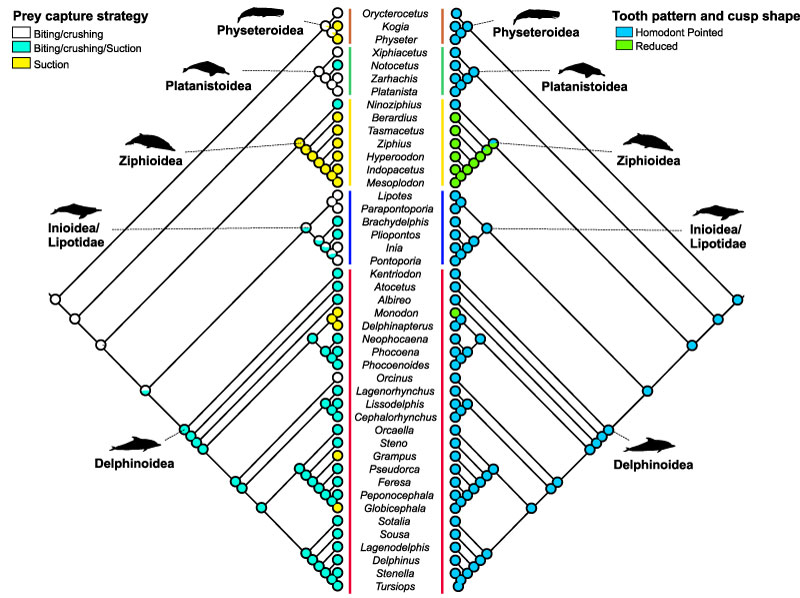
FIGURE 20. Ancestral state reconstruction of prey capture strategies and tooth pattern and cusp shape in crown Odontoceti. Topology follows McGowen et al. (2009) and Gatesy et al. (2013). Details on the tree can be found in Appendix 1. All data matrices and complete trees with branch lengths can be found in the Supplementary Information (https://doi.org/10.6086/d14671).