FIGURE A1. Photograph of a colossal squid upper beak. Arrows indicate two of the high points in undulations along the hood. Scale near the rostral tip is in mm.
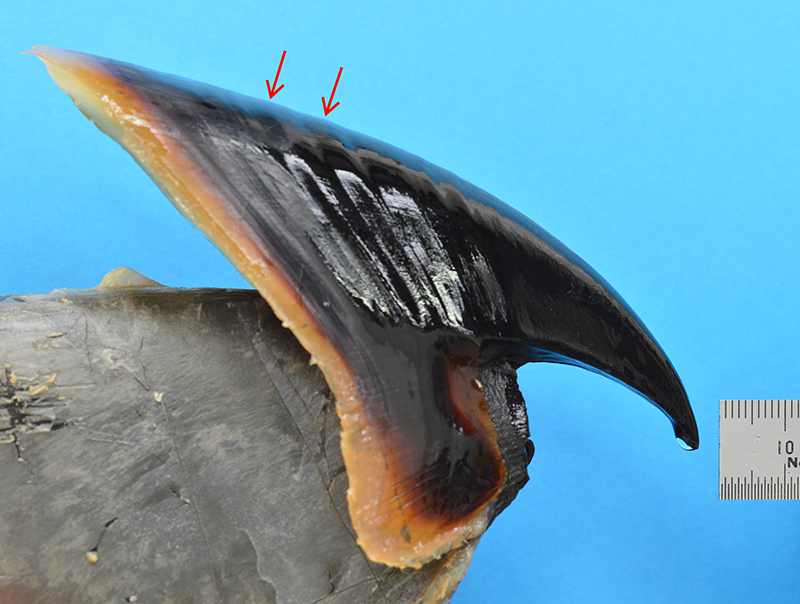
FIGURE A2. Patterns of spiral deviations from the rostral tip for six different spirals to the digitized outline of the upper squid beak of Figure A1. Apart from the L1 spiral, each plot has the same vertical scale (limits that are denoted by red ticks on the L1 plot). Vertical lines and shade, respectively, locate the estimates of spiral shape change and transition between spirals.
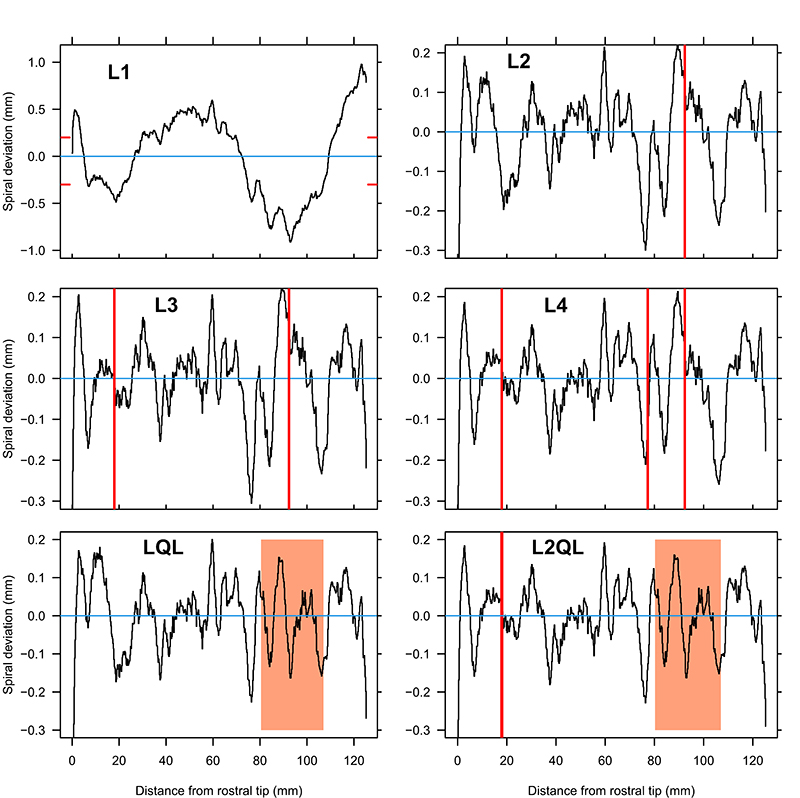
FIGURE A3. Scree plot of the reduction in error (residual standard deviation) for different spirals fitted to the upper beak of the colossal squid. Generalized transition spirals are denoted by the lowercase letter g.
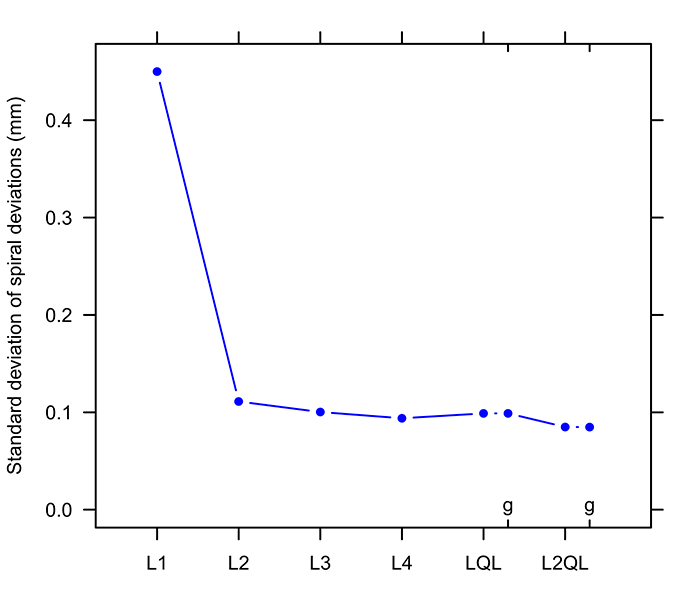
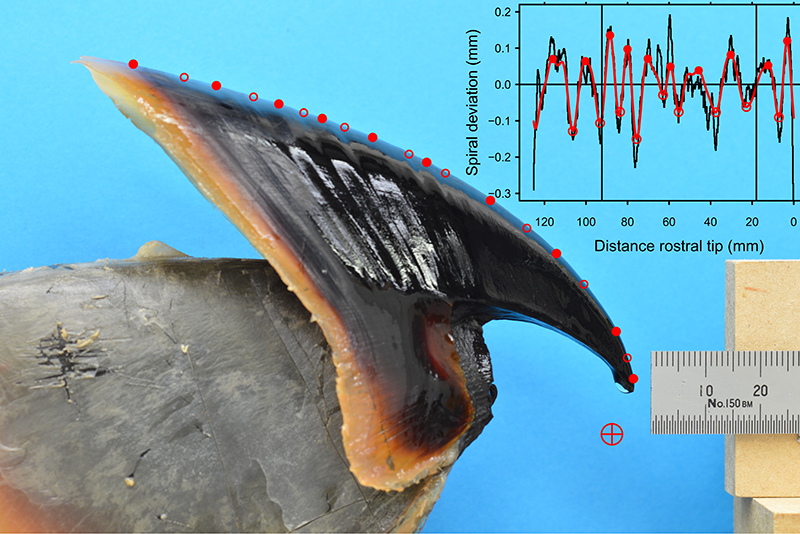
FIGURE A4. Upper colossal squid beak with wavelet maxima and minima located on the hood. Circle and cross symbol denote the spiral axis. Inset shows the spiral deviations from the L2QL fit, with vertical lines for the center of spiral change and wavelet reconstruction with maxima (solid circles) and minima (open circles). Note the reversal of the inset horizontal scale to match the direction of growth from the rostral tip. See text for detail on wavelet scale and reconstruction.
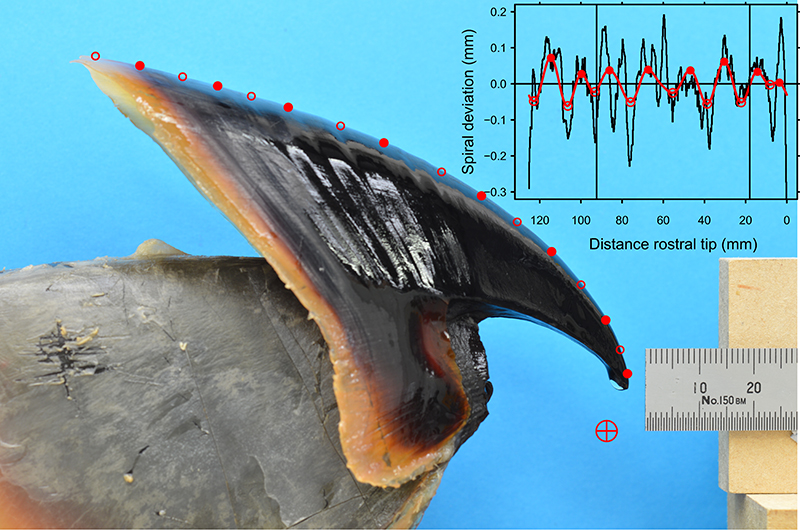
FIGURE A5. Upper colossal squid beak with combined wavelet maxima and minima located on the hood. Circle and cross symbol denote the spiral axis. Inset shows the spiral deviations from the L2QL fit, with vertical lines for the center of spiral change and combined wavelet reconstruction with maxima (solid circles) and minima (open circles). Note the reversal of the inset horizontal scale to match the direction of growth from the rostral tip.
