APPENDIX 1.
Output from linear regression analyses (available online in spreadsheet format).
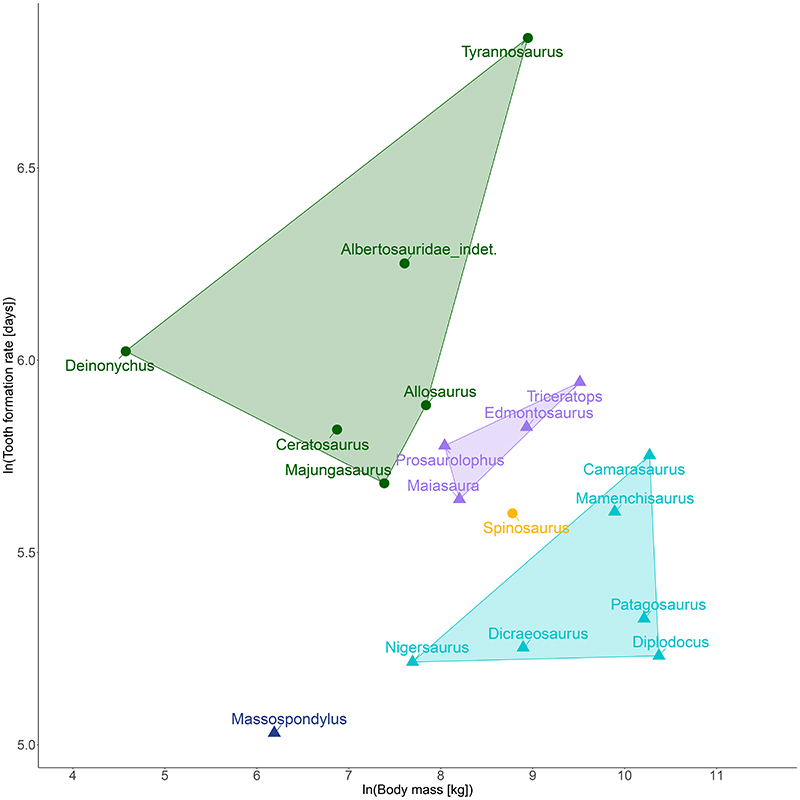
APPENDIX FIGURE 1. Natural logarithm of tooth formation rate plotted against natural logarithm of body mass including labels for individual data points and highlighting the spinosaurine data point. Dark blue = sauropodomorpha, light blue = sauropods, purple = ornithischians, green = theropods, yellow = spinosaurine.
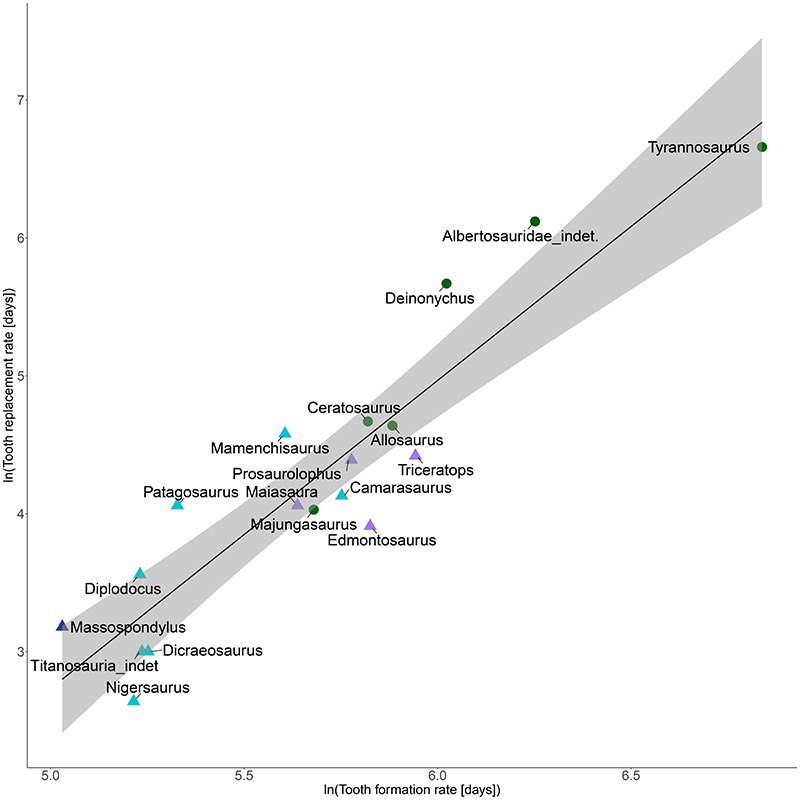
APPENDIX FIGURE 2. Natural logarithm of known tooth replacement rates plotted against natural logarithm of tooth formation rates including all available archosaurs and individual labels. A regression line and the confidence interval were added. Colour code as in Appendix Figure 1.