FIGURE 1. (A) Schematic drawing of a tooth cross section showing the concentric incremental lines of von Ebner and the radial tubuli. (B) Schematic drawing of a tooth longitudinal section; it demonstrates why cross sections do not always show all growth lines.
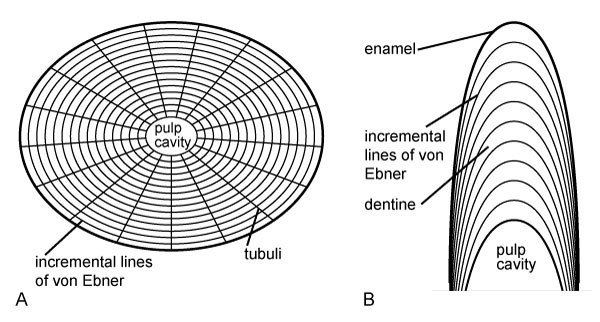
FIGURE 2. (A) Positions of the measurements in labial (left) and distal (right) view. L = length from the crown (apex) to the basal end; WAPa = width measured anterio-posteriorly at the apex; WAPb = width measured anterior-posteriorly at the base; WLLa = width measured labio-lingually at the apex; WLLb = width measured labio-lingually at the base. PCap = width of the pulp cavity measured anterio-posteriorly; PCll = width of the pulp cavity measured labio-lingually. (B-F) Positions and collection IDs of the thin sections (SNSB-BSPG 2008 XXXVII followed by the number and letter given in the pictures). All scale bars equal 1 cm.
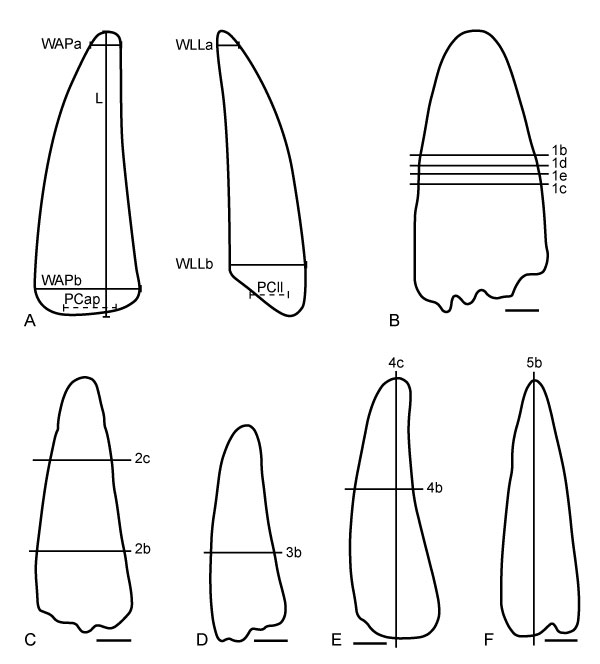
FIGURE 3. (A-E) Teeth SNSB-BSPG 2008 XXXVII 1a-5a in mesial (left) and lingual (right) view. All scale bars equal 1 cm.
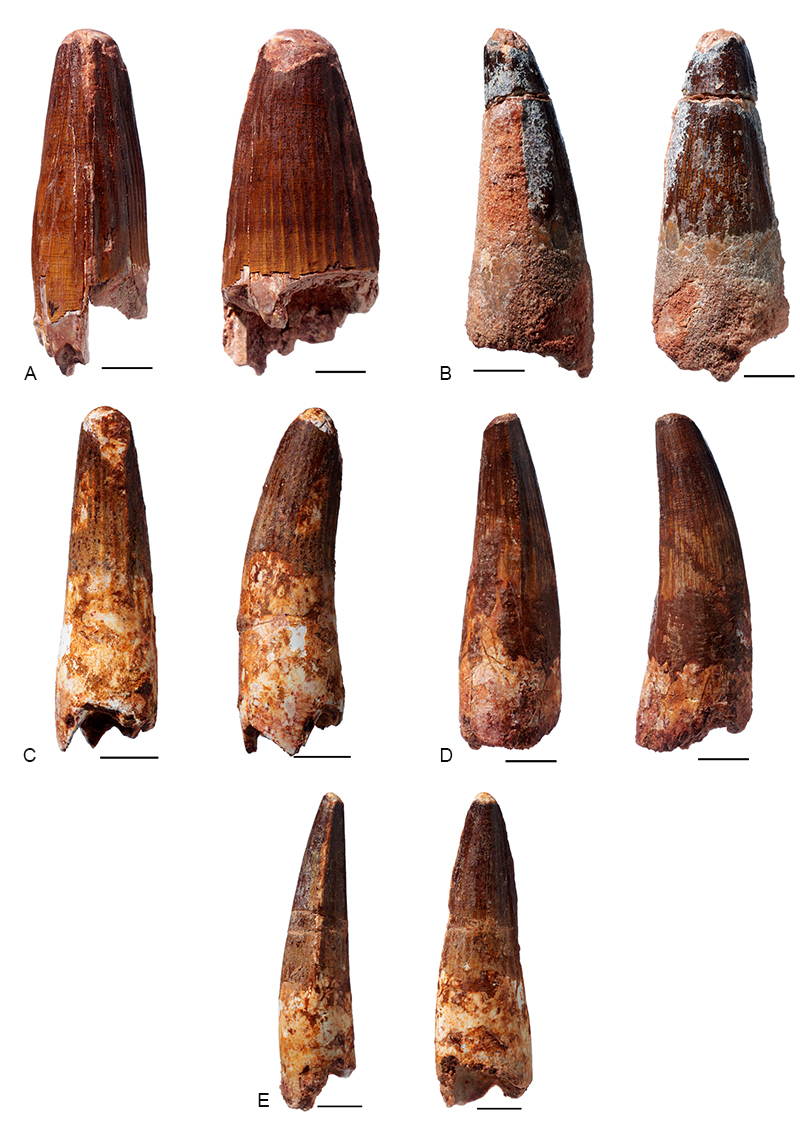
FIGURE 4. (A) Section SNSB-BSPG 2008 XXXVII 1b. The growth lines are visible in the upper half of the section; scale bar equals 1 mm. (B) Section SNSB-BSPG 2008 XXXVII 1e shows the curving of the dentine near the enamel; scale bar equals 1 mm. (C) Section SNSB-BSPG 2008 XXXVII 3b shows a higher density of growth lines around the pulp cavity. The arrow indicates the mineralised gap in the internal wall of the tooth; scale bar equals 1 mm. (D) Section SNSB-BSPG 2008 XXXVII 2b shows the red mineralisation and fissures; scale bar equals 5 mm. (E) Section SNSB-BSPG 2008 XXXVII 2c. The arrow indicates the area of a series of start of alternating incremental lines; scale bar equals 1 mm. (F) Section SNSB-BSPG 2008 XXXVII 2c. The arrow indicates curving incremental lines; scale bar equals 1 mm.
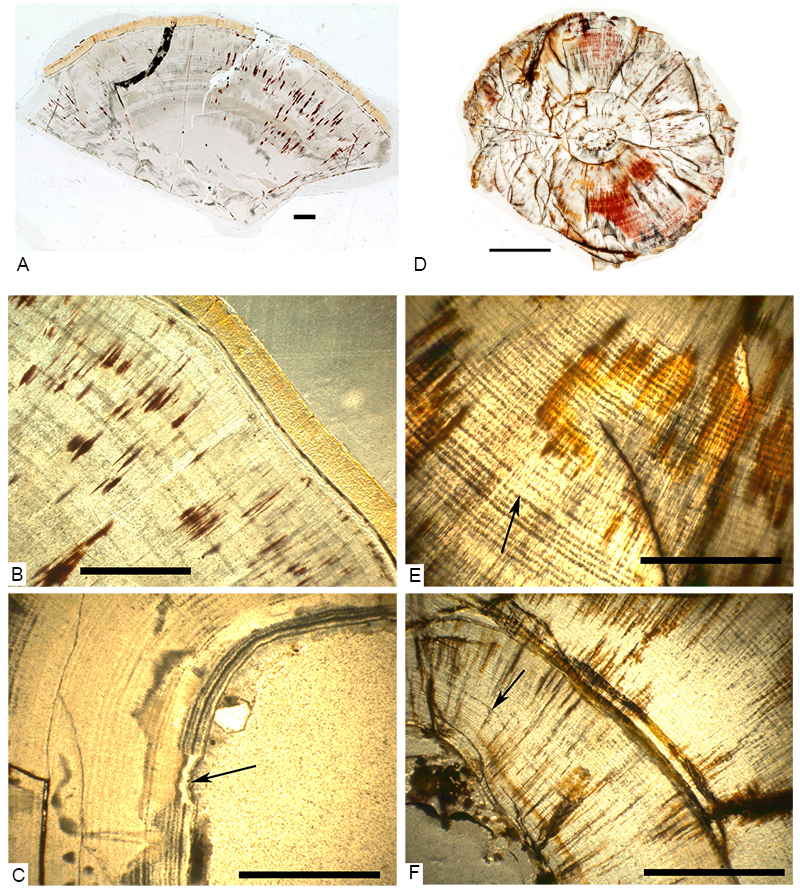
FIGURE 5. (A) Section SNSB-BSPG 2008 XXXVII 4b; scale bar equals 1 mm. (B) Section SNSB-BSPG 2008 XXXVII 4b with clearly visible growth lines; scale bar equals 1 mm. (C) Section SNSB-BSPG 2008 XXXVII 4c; scale bar equals 1 mm. (D) Section SNSB-BSPG 2008 XXXVII 5b shows the dentine tubuli curving towards the apex; scale bar equals 1 mm. (E) Section SNSB-BSPG 2008 XXXVII 5b shows the red mineralisation and the growth lines; scale bar equals 1 mm. (F) Section SNSB-BSPG 2008 XXXVII 5b. The arrow indicates the foreign particle with bent growth lines to its left and right; scale bar equals 1 mm.
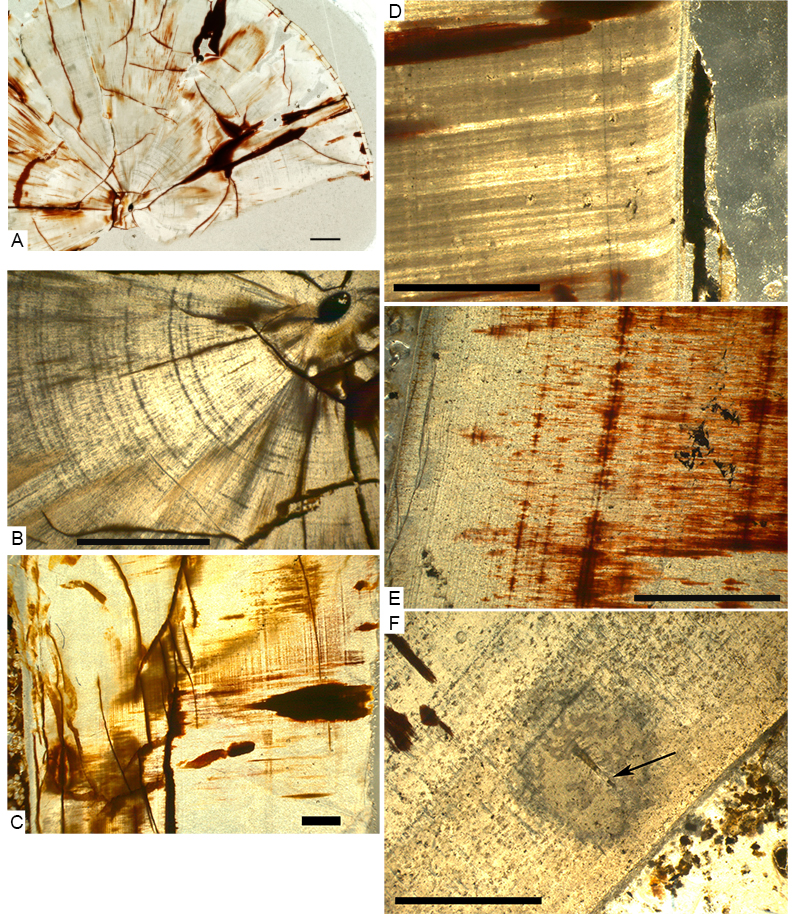
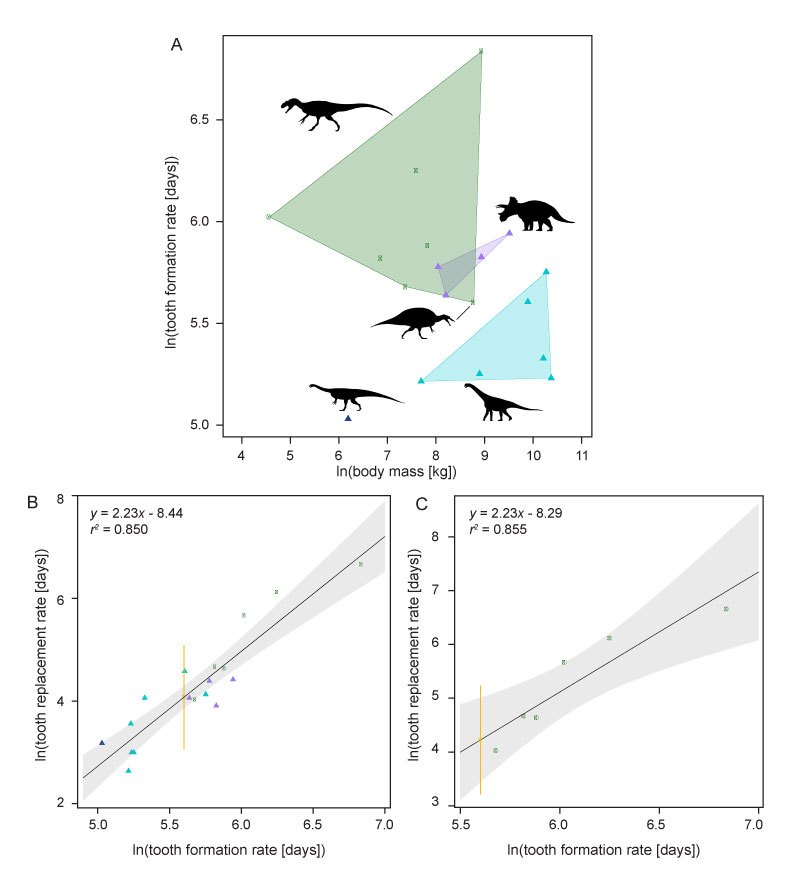
FIGURE 6. (A) Natural logarithm of tooth formation rate plotted against the natural logarithm of the body mass. Dark blue = sauropodomorpha, light blue = sauropods, purple = ornithischians, green = theropods. (B) Natural logarithm of known tooth replacement rates plotted against natural logarithm of tooth formation rates including all available archosaurs, with a regression line and the regression equation. Colour code as above; yellow = spinosaur with the standard deviation as error bars. (C) Natural logarithm of known tooth replacement rates plotted against natural logarithm of tooth formation rates including theropods only, with a regression line and the regression equation. Colour code as above. Silhouette of Triceratops by R. Amos, all other silhouettes by S. Hartman from www.phylopic.org; licence https://creativecommons.org/licenses/by-nc-sa/3.0/.