FIGURE 1. Photographs of the outcrop and fossil samples. A. Outcrop at Caloosa Shell Quarry, Hillsborough County, Florida, USA. B. Close-up of outcrop showing sampling scheme. Pairs of replicate samples were taken immediately adjacent to each other at 30 cm vertical increments. C. Fossil sample prior to either sieving or cementation. D. Artificially cemented sample.
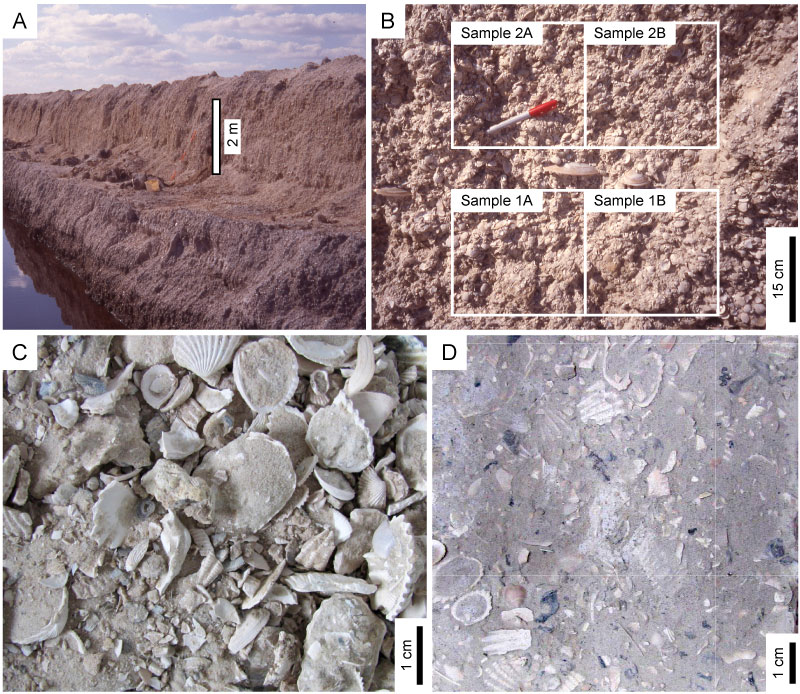
FIGURE 2. Classical (A) and coverage-based (B) rarefaction of the Bermont Formation samples. In each panel, the red curve marks the lithified sample, and the blue curve marks the corresponding unlithified replicate sample. The gray curves mark other unlithified samples taken from different horizons of the same formation at the same outcrop. The red and blue bands mark 95% confidence intervals.
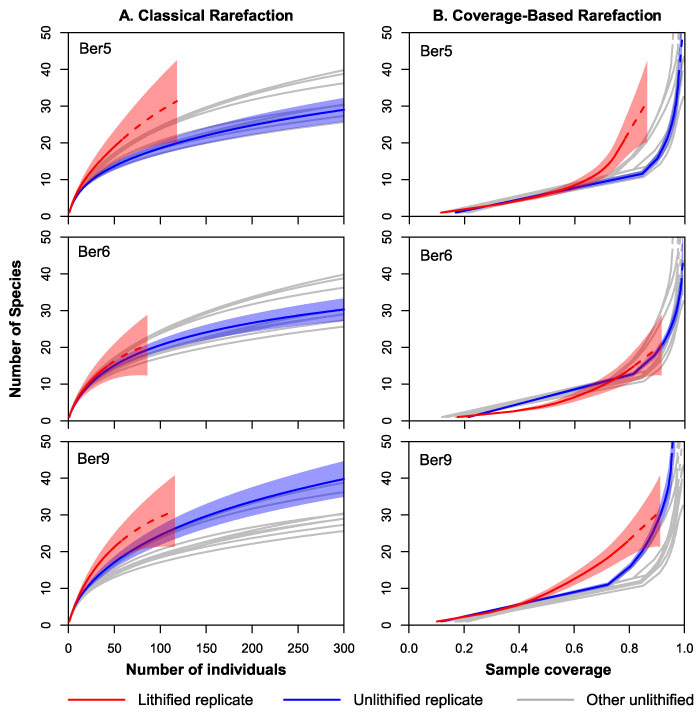
FIGURE 3. Classical (A) and coverage-based (B) rarefaction of the Fort Thompson Formation samples. In each panel, the red curve marks the lithified sample, and the blue curve marks the corresponding unlithified replicate sample. The gray curves mark other unlithified samples taken from different horizons of the same formation at the same outcrop. The red and blue bands mark 95% confidence intervals.
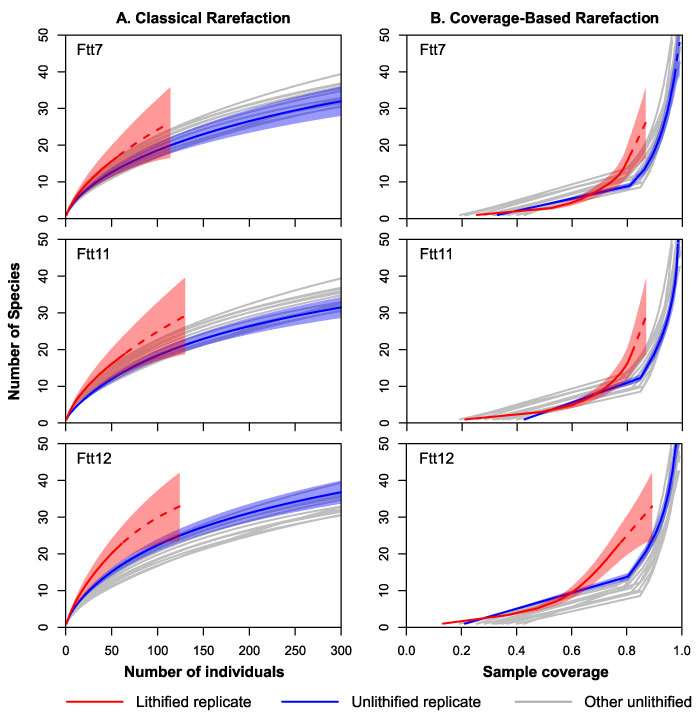
FIGURE 4. Rank abundance plots for the Bermont (A) and Fort Thompson (B) samples.
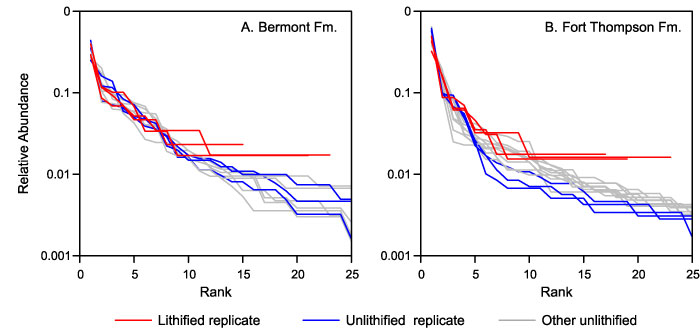
FIGURE 5. Percentage of individuals in each sample belonging to small-shelled species, defined as less than 15 mm. A. Bermont Formation. B. Fort Thompson Formation.
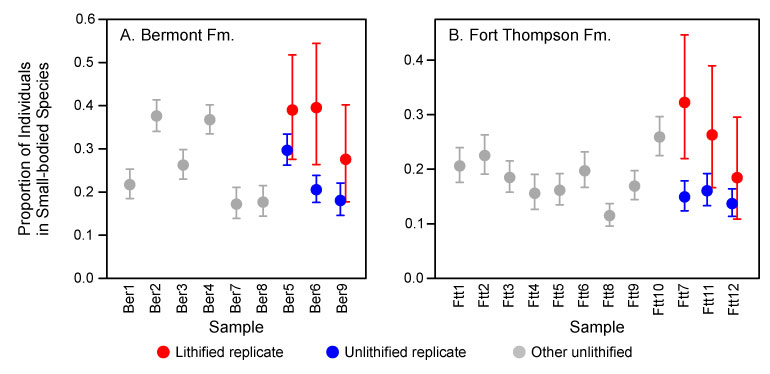
FIGURE 6. Principal coordinates analysis. The eigenvalues for the first two axes accounted for 72% of the variation in the data.
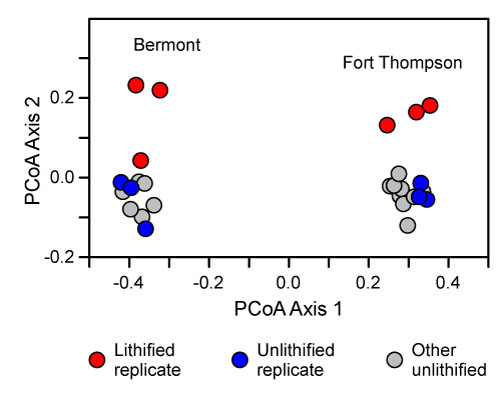
FIGURE 7. Relative abundances of the ten most abundant species in the overall dataset. Relative abundance is plotted on a square-root scale so that low values can be more easily distinguished. A. Bermont Formation. B. Fort Thompson Formation.
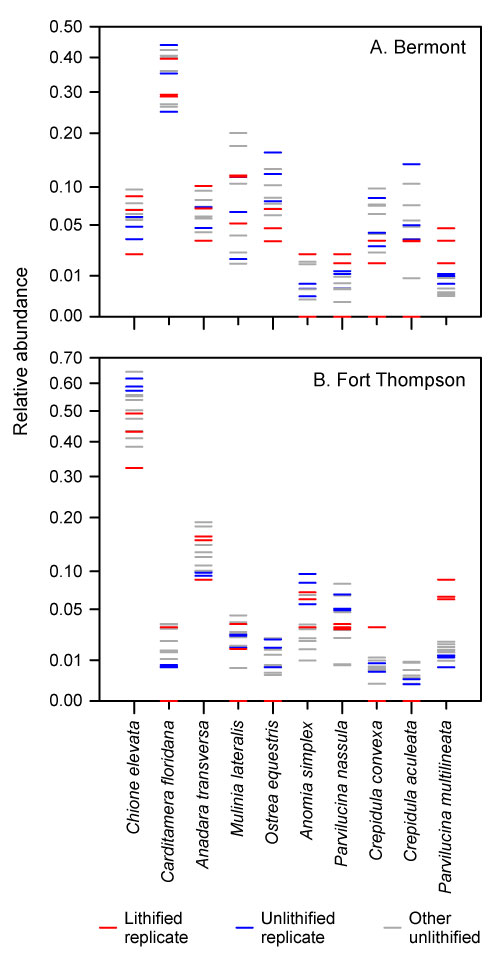
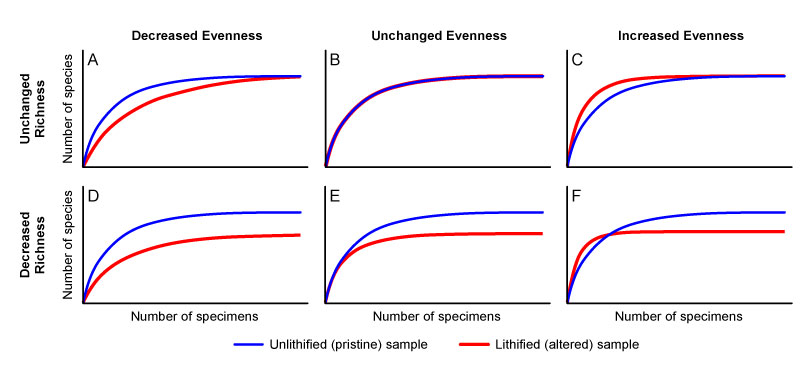
FIGURE 8. Hypothetical rarefaction curves illustrating the potential effects of lithification or other diagenetic processes on the observed biodiversity of a fossil assemblage. The rarefaction curves are shown in blue for unlithified, unaltered assemblages and in red for the lithified, altered assemblages. A-C, Total species richness is the same in the pristine and altered samples. D-F, Total species richness is lower in the altered samples. A,D, Evenness is lower in the altered samples. B,E Evenness is the same. C,F, Evenness is higher in the altered samples.