FIGURE 1. Translucent 3D-models of Cambarellus diminutus sample C7tank in combination with 3D-models of calcite clusters, which precipitated inside the carcass during its decomposition in freshwater. 1.1 3D-model without calcite clusters on day 1. 1.2 3D-model on day 2 showing a small amount of calcite clusters inside the cephalothorax and the first tergite. 1.3 3D-model on day 4 showing a lot of calcite clusters inside the antennules, the left major propodus, the rostrum, the cephalothorax, the tergites, the uropods, and the telson. 1.4 3D-model on day 7, showing widespread calcite clusters at the inner side of the carapace of the carcass except the dorsal side of the cephalothorax and the tergites (see also Figure.4.1). 3D-models were reconstructed based on µ-CT data.
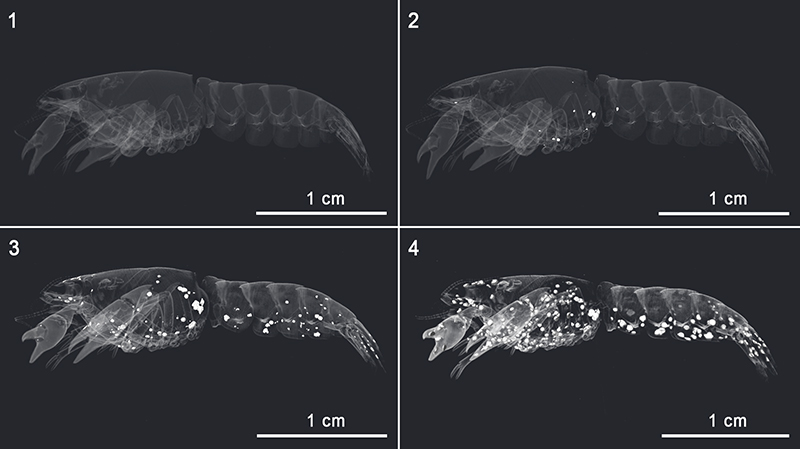
FIGURE 2. Median values of percentage decrease in the total volume of gastroliths (TVGtank and TVGdist.) in comparison to the percentage increase in the total volume of calcite clusters (TVCtank and TVCdist.) of sample C4 tank, C6tank, C9tank, C10tank and C1dist., C3dist., C4dist., C8 dist., C9dist. and C10 dist. for the duration of 11 days (Data set can be found in the supplement [Appendix 7, Appendix 8, Appendix 9, Appendix 10]). 100 % in TVGtank/dist represents the starting volume of gastroliths at the beginning of the experiments. 100 % in TVCtank/dist represents the maximum volume of calcite precipitation achieved during the experimental period. 3D-models in violet box show the reduction of gastroliths for the duration of 11 days. V, Volume; d, day; TVG, total volume of gastroliths; TVC, total volume of calcite; tank, tank water; dist., distilled water. 3D-models were reconstructed based on µ-CT data.
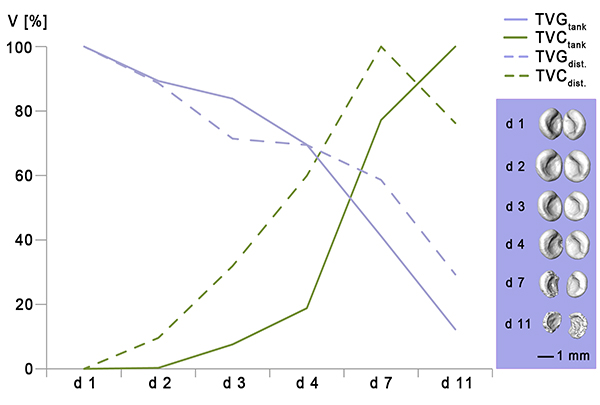
FIGURE 3. Comparison of the maximum volume of precipitated calcite of samples C1tank to C10tank and C1dist. to C10dist. in dependence of the body size. Specimens without gastroliths (which were in the intermoult phase) are marked with a circle. Specimens with gastroliths are marked by using a filled triangle (early premoult phase), filled squares (late premoult phase) and filled circles (postmoult phase). Also shown are regression lines for individuals without gastroliths (R2 = 0.39) and with gastroliths (R2 = 0.08).
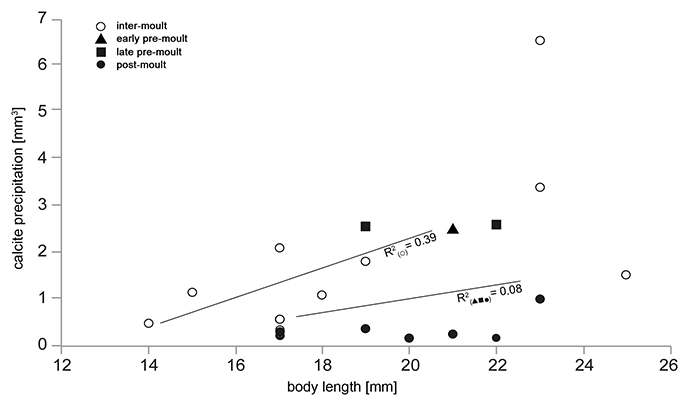
FIGURE 4. 4.1 Anterior view from the cephalothorax into the abdominal region of a translucent 3D model of Cambarellus diminutus sample C7 tank in combination with 3D models of calcite clusters on day 7). 4.2 SEM image of the carapace surface with a plumose seta and some kind of bacteria. 4.3 SEM image of the surface of a calcite cluster with parts of the cuticle layers and bacteria. Abbreviations: A, abdominal segment; B, bacteria; C, cuticle; CC, calcite cluster; In, intestine; P, plumose seta. 3D-models were reconstructed based on µ-CT data.
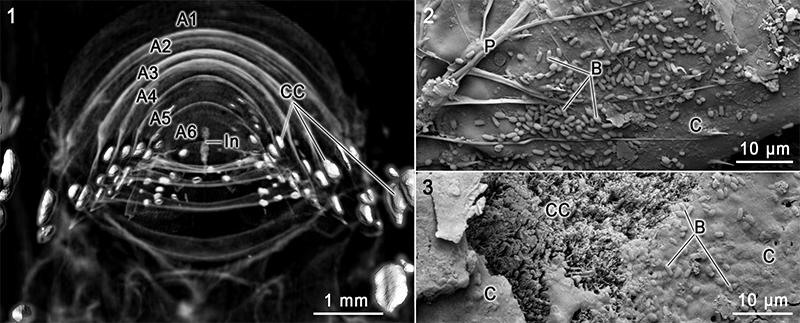
FIGURE 5. SEM-images of several diverse calcite structures which precipitated inside the carcasses. 5.1 Bispherical structure with mineralized setae and a part of the cuticle layers. 5.2 and 5.3 Spherical structures. 5.4 Elliptical structure which is tapering at the left side. 5.5 Complex structure. 5.6 Bispherical structure with mineralized setae and a part of the cuticle layers.
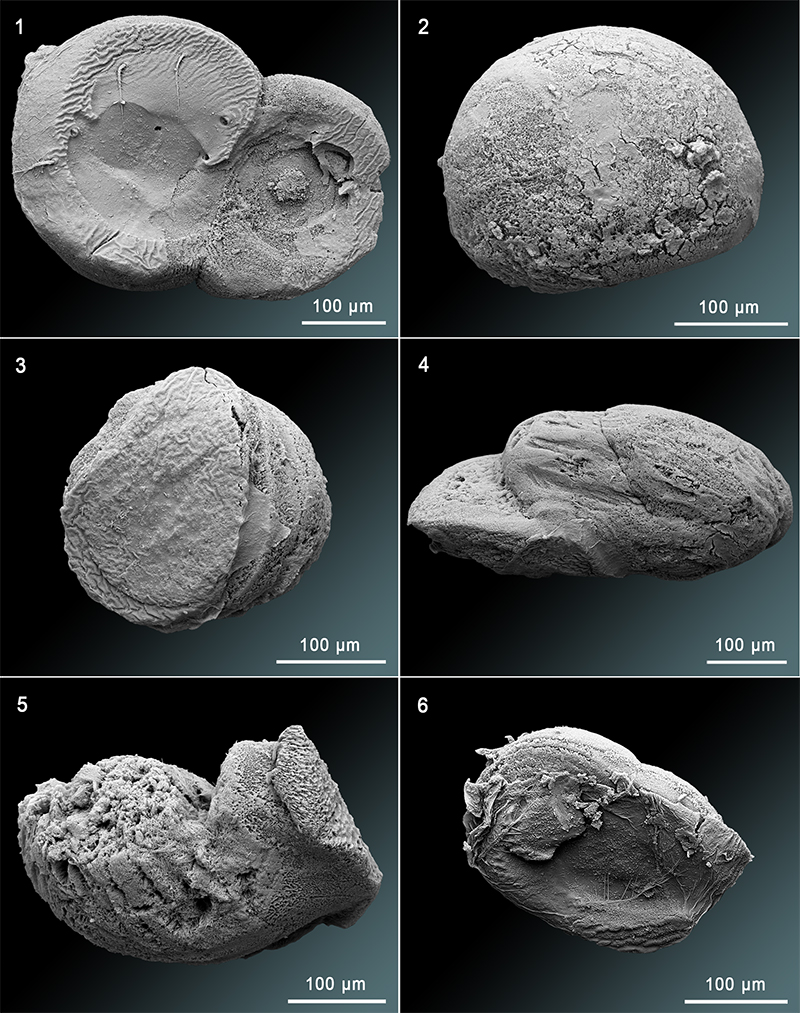
FIGURE 6. 3D-models and SEM-images of sample C3tank. 6.1 3D-model of the whole crayfish in dorso-lateral view. 6.2 3D-model of the chela of the first left pereiopod in combination with a SEM-image of the calcified muscle of the dactyl. 6.3 SEM-image of a calcified muscle from the inside of the dactyl of the chela of the first left pereiopod. 3D-models were reconstructed based on µ-CT data.
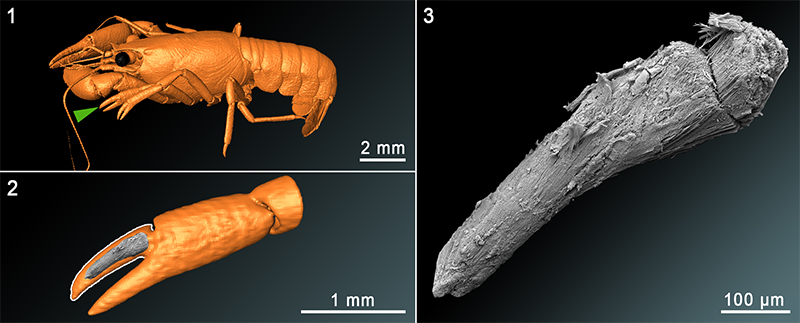
FIGURE 7. Representative Raman spectra of a mineralized muscle of Cambarellus diminutus (sample C3tank) and observed crystal clusters compared to Raman reference spectra of crystalline calcite and apatite, taken from the RRUFF Raman data base (*R040170, #R060070, Laetsch and Downs, 2006). Raman spectra of the mineralized muscle as well as of the crystal cluster exhibit all main Raman bands typically observed in well crystallized calcite, including the lattice modes, which are absent in amorphous calcium carbonate (Wang et al., 2011).
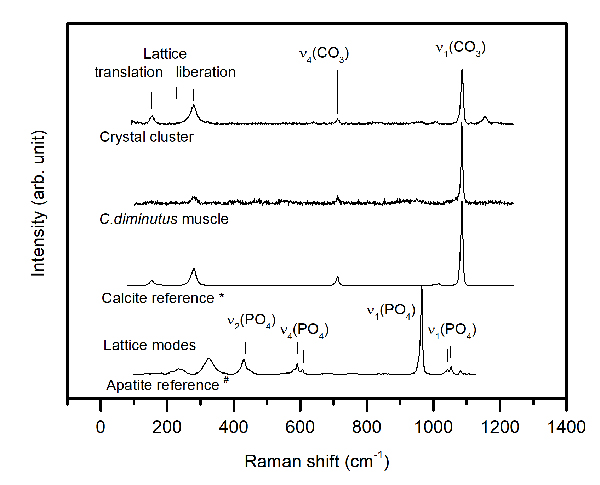
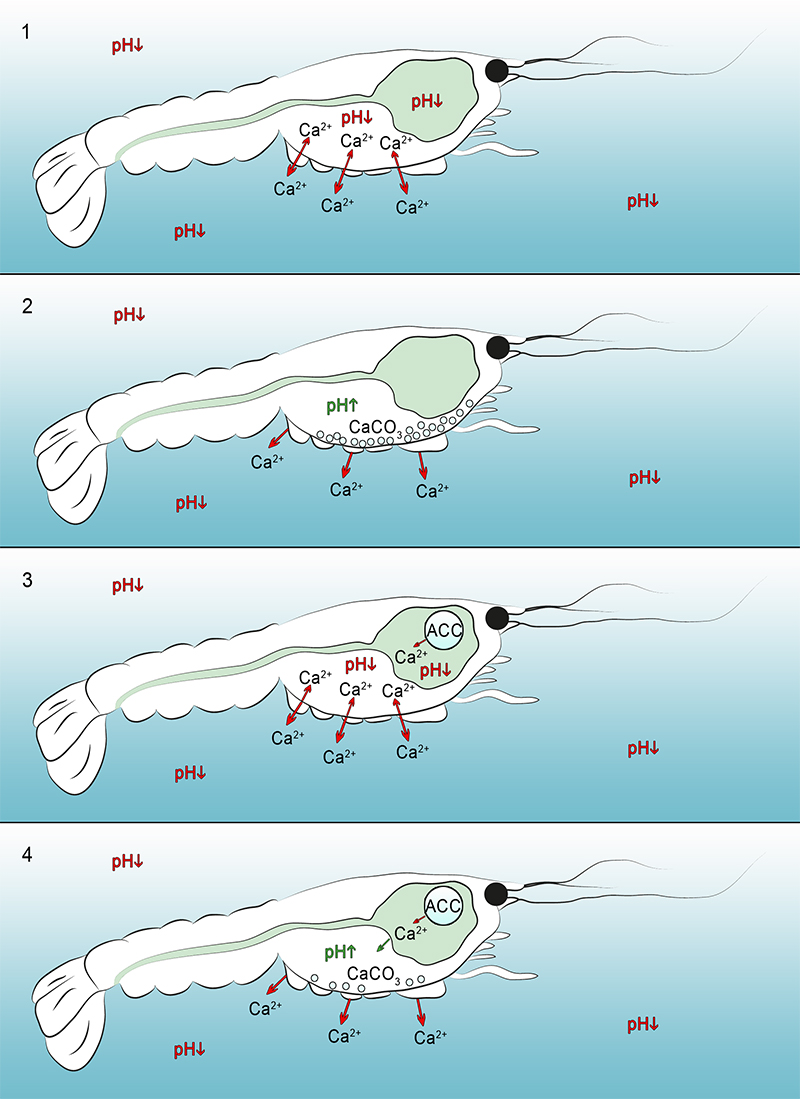
FIGURE 8. Hypothetical scenarios of calcium dissolution and precipitation of calcite clusters inside decomposing crayfish without (8.1-2) and with gastroliths in tank water (8.3-4). 8.1 Low pH-values around and inside the carcass caused by an enzymatic self-digestion (autolysis) and bacterial activity release dissolved calcium ions which migrate out of the carapace into the body cavity and into the environment (red arrows). 8.2 Increase of the pH-value inside the carcass caused by microbial activities during the putrefaction result in a precipitation of calcite clusters at the inner side of the carapace, consisting of previously dissolved calcium ions out of the cuticle layers. 8.3 Low pH-values around and inside the carcass caused by enzymatic self-digestion (autolysis) and bacterial activity resulted in an accumulation of dissolved calcium ions (red arrows). In addition, low pH conditions inside the stomach and decay of the “gastrolith-cavity-membrane” resulted in dissolving calcium ions from the gastroliths. 8.4 An increase of the pH-value inside the carcass, along the inner side of the carapace, caused by microbial activities during the putrefaction resulted in a precipitation of calcite clusters by previously dissolved calcium ions out of the cuticle layers and gastroliths.