FIGURE 1. Detailed quarry map of the Howe-Stephens Quarry with finds from excavation seasons 1992-2001. The color coding reflects the hypothesis of skeletal unity based on field observations (Ayer, 2000). Sauropods are indicated in red text in the legend. Note that the 2002 season, which was the last season for the Howe-Stephens Quarry, only uncovered another silicified tree trunk, which was found below the partial skeletons of SMA 0002 “E.T.” and SMA no # “Brösmeli”. The arrows indicate the sampled bones used in this study. This quarry map was made by E. Premru, and provided by the Sauriermuseum Aathal, Aathal, Switzerland.
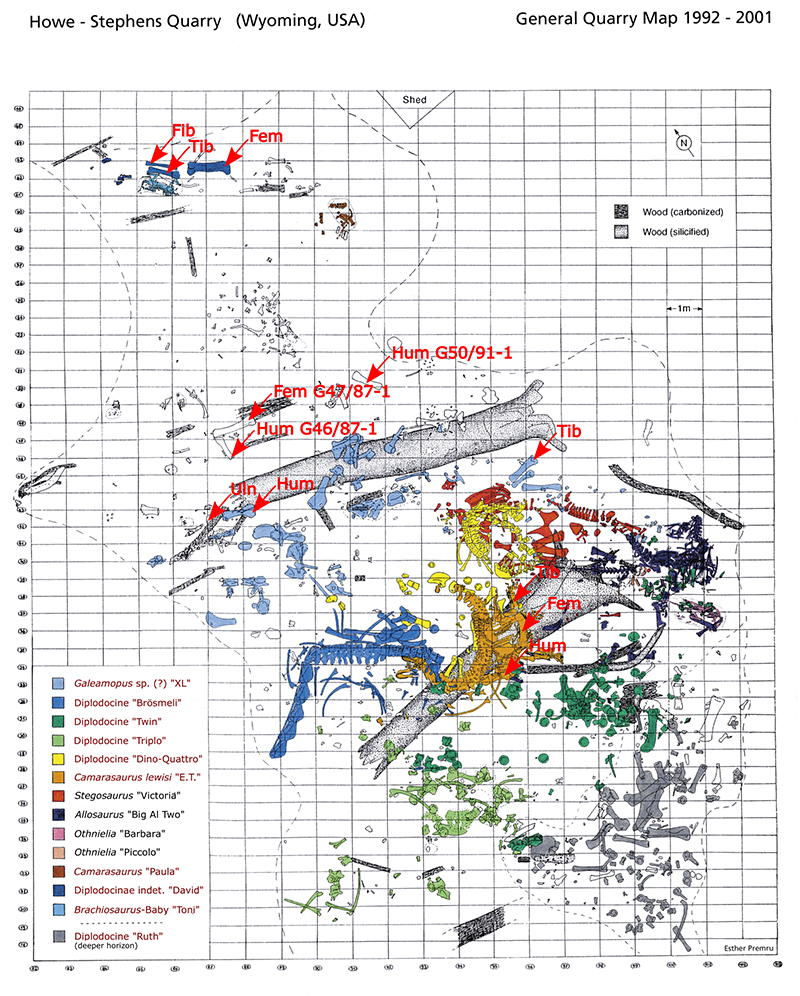
FIGURE 2. Detailed quarry map of the Howe Scott Quarry with finds from excavation seasons 1995-2003. The color coding reflects the hypothesis of skeletal unity based on field observations (Ayer, 2000). Sauropods are indicated in red in the legend. The arrows indicate the sampled bones used in this study. The quarry map was made by E. Premru, and provided by the Sauriermuseum Aathal, Aathal, Switzerland. Note that SMA M16/12-3 is not marked on the map due to a coordinate inaccuracy, which makes it impossible to correctly locate bone SMA M16/12-3 on the quarry map.
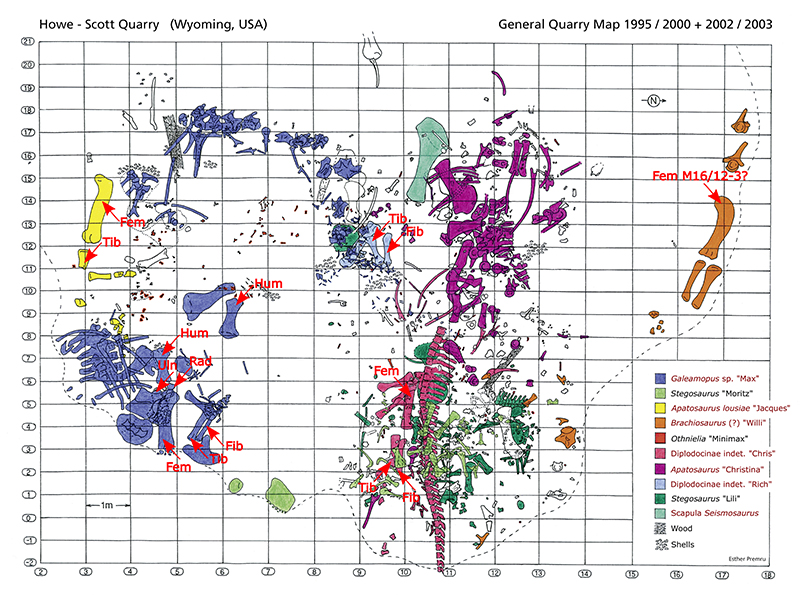
FIGURE 3. The innermost cortex of fibula SMA 0084 “Rich” with the three visible generations of secondary osteons. The numbers indicate the three overlapping secondary osteons. Image taken under plane-polarized light.
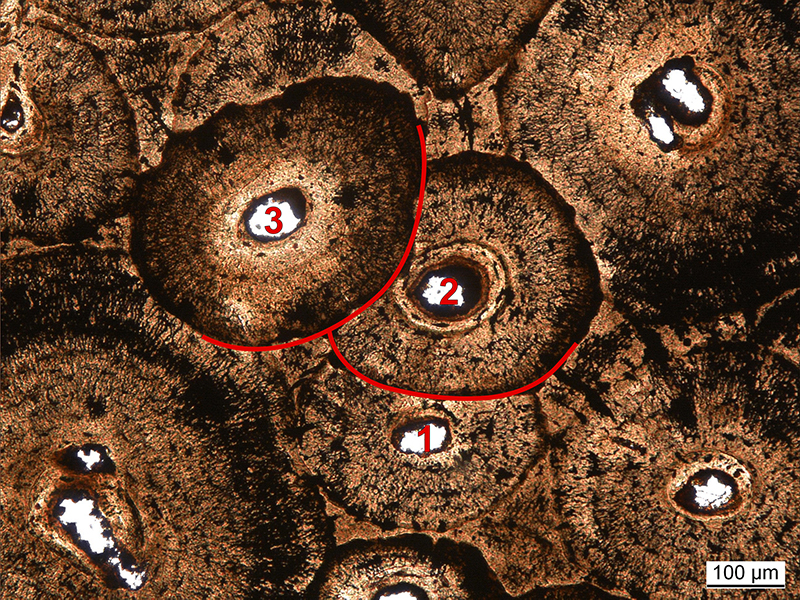
FIGURE 4. Growth marks preserved in the femur of SMA 0087 “Chris”. To study the cyclicity, all growth marks are considered. Multiple, closely spaced LAGs (arrows) were counted as one growth mark.
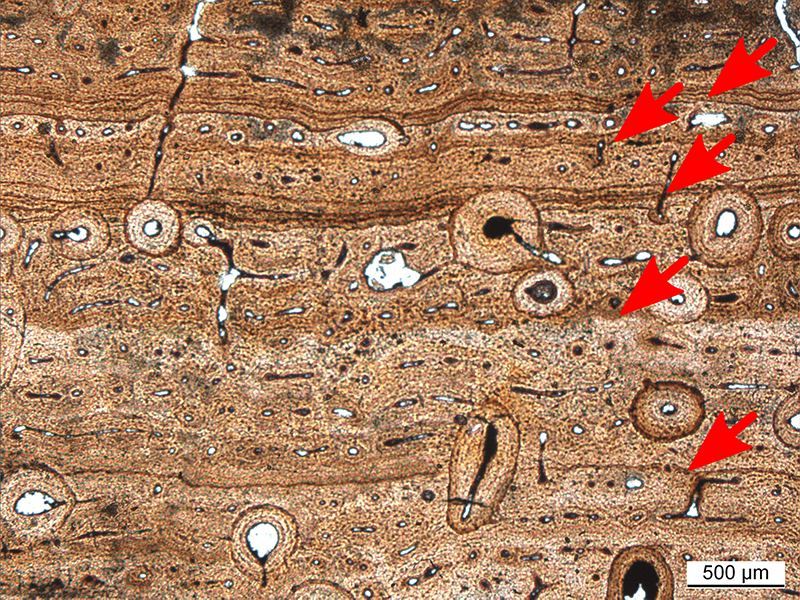
FIGURE 5. Images of all samples taken from SMA 0002 “E.T.” A, humerus (r). B, femur (l). C, tibia (l). For all samples, the bone tissue types are indicated to the left, and the number and patterns of the visible growth cycles are indicated to the right. Abbreviations; E: Bone tissue type E, EFS: External fundamental system, F: Bone tissue type F, G: Bone tissue type G, MC: Medullary cavity, RA: Remodeled area.
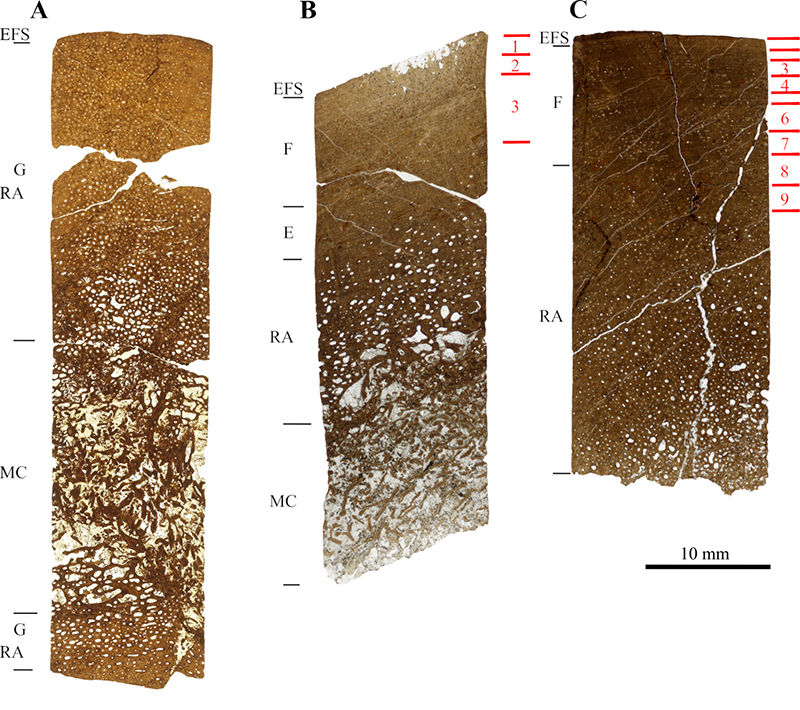
FIGURE 6. Images of all samples taken from from SMA 0007 “XL”. A, humerus (r). B, ulna (l). C, tibia (?). For all samples, the bone tissue types are indicated to the left, and the number and patterns of the visible growth cycles are indicated to the right. Abbreviations; E: Bone tissue type E, EFS: External fundamental system, F: Bone tissue type F, MC: Medullary cavity, RA: Remodeled area.
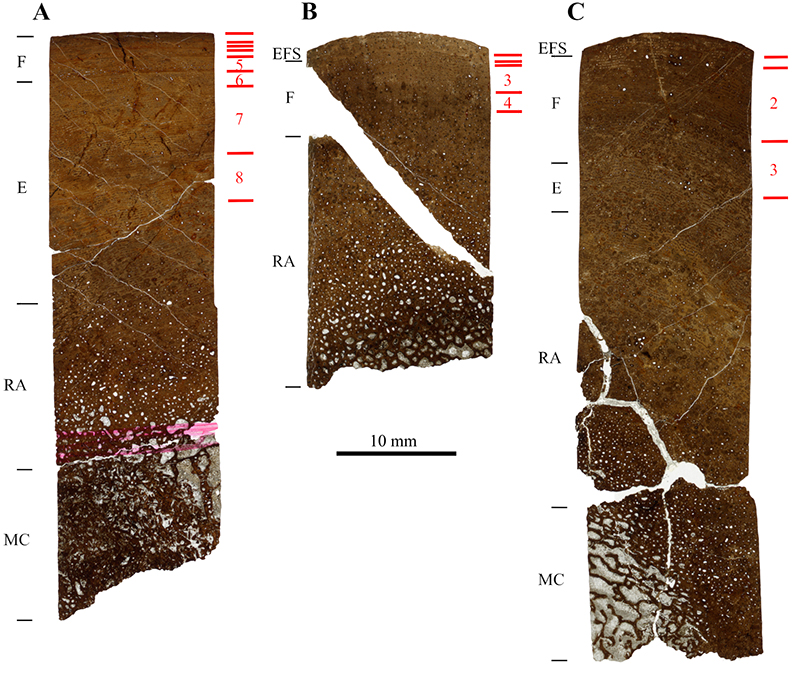
FIGURE 7. Images of all samples taken from SMA 0015 “David”. A, femur (l). B, tibia (l). C, fibula (l). For all samples, the bone tissue types are indicated to the left, and the number and patterns of the visible growth cycles are indicated to the right. Abbreviations; E: Bone tissue type E, EFS: External fundamental system, F: Bone tissue type F, MC: Medullary cavity, RA: Remodeled area.
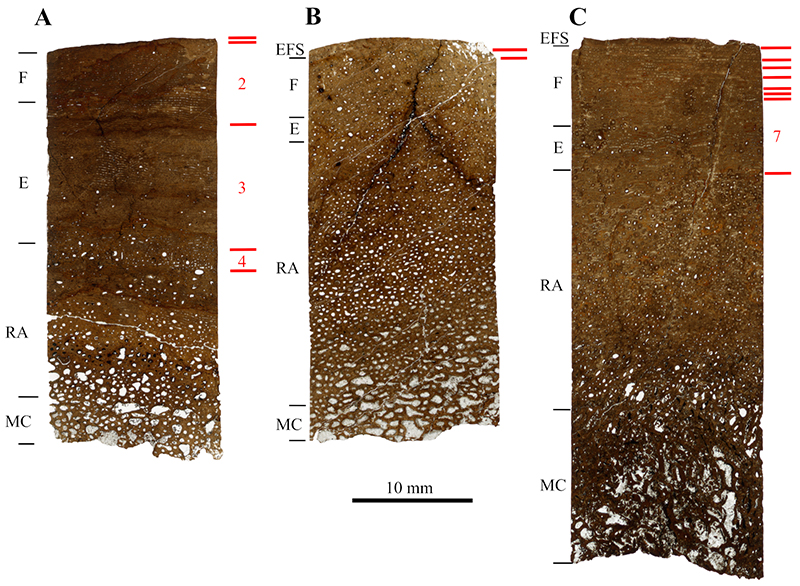
FIGURE 8. View of outer cortex of SMA 0015 “David” femur with the characteristic orange, diagenetic coloration which can be observed in all the SMA 0015 “David” samples. This image was taken from the outer cortex of SMA 0015 “David” femur.
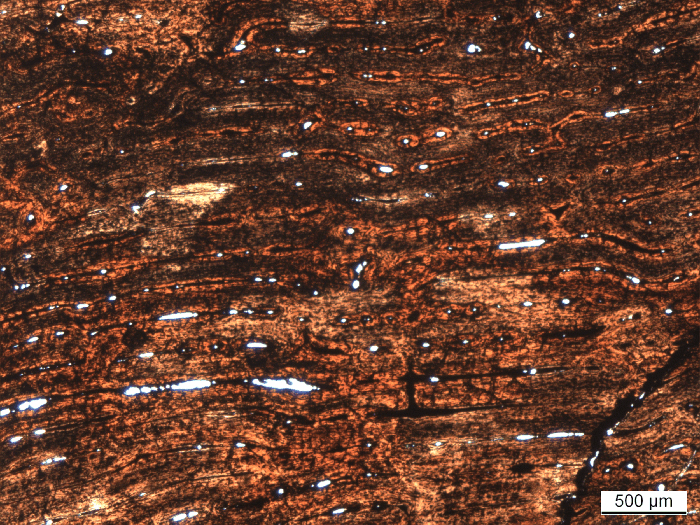
FIGURE 9. Images of all samples taken from the isolated bones SMA G47/87-1, G47/87-1 and G50/91-1. A, SMA G46/87-1 humerus (l). B, SMA G50/91-1 humerus (r). C, SMA G47/87-1 femur (l). For all samples, the bone tissue types are indicated to the left, and the number and patterns of the visible growth cycles are indicated to the right. Abbreviations; D: Bone tissue type D, E: Bone tissue type E, MC: Medullary cavity, RA: Remodeled area.
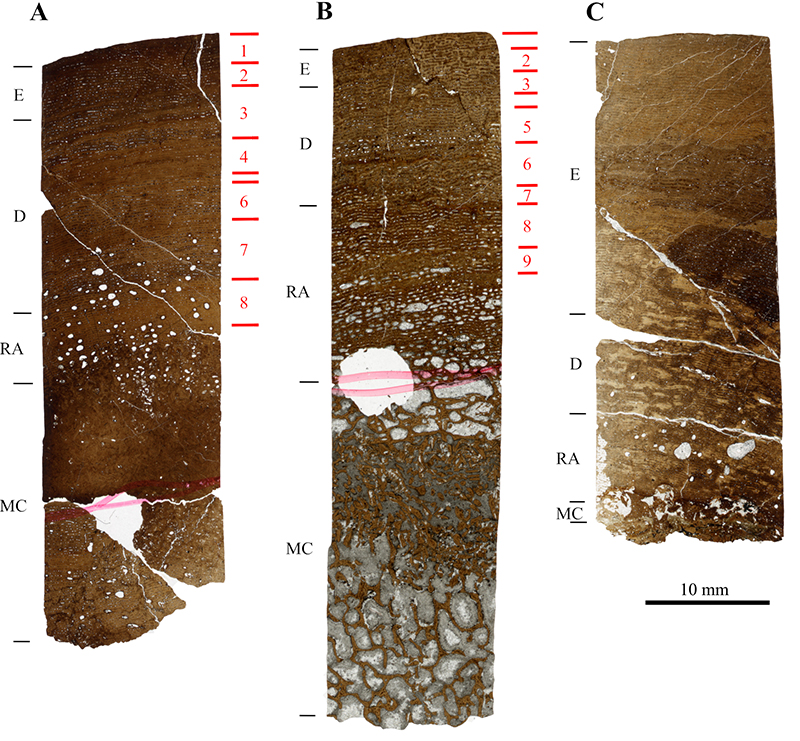
FIGURE 10. Band of secondary osteons in humerus SMA G50/91-1. The band of secondary osteons is located between the red lines. The area above the band of secondary osteons, marked by the dashed red line, consists of mainly primary bone with some isolated secondary osteons. In this area however, the density of secondary osteons is much lower than that seen in the secondary osteon band. Abbreviations; MC: Medullary cavity, RA: Remodeled area, SOB: Secondary osteon band.
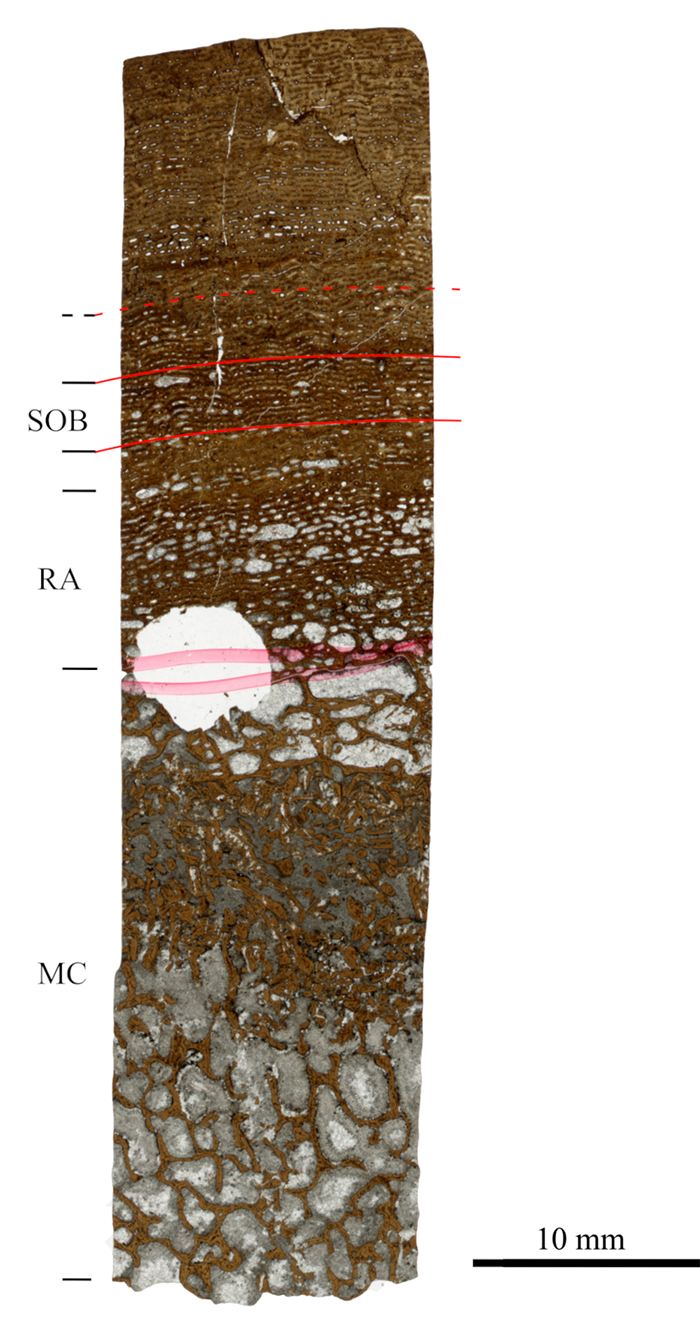
FIGURE 11. Images of all samples taken from SMA 0014 “Jacques”. A, femur (r), drilled on the anterior side. B, femur (r), drilled on the posterior side. C, tibia (r). For all samples, the bone tissue types are indicated to the left, and the number and patterns of the visible growth cycles are indicated to the right. Abbreviations; D: Bone tissue type D, E: Bone tissue type E, F: Bone tissue type F, MC: Medullary cavity, RA: Remodeled area.
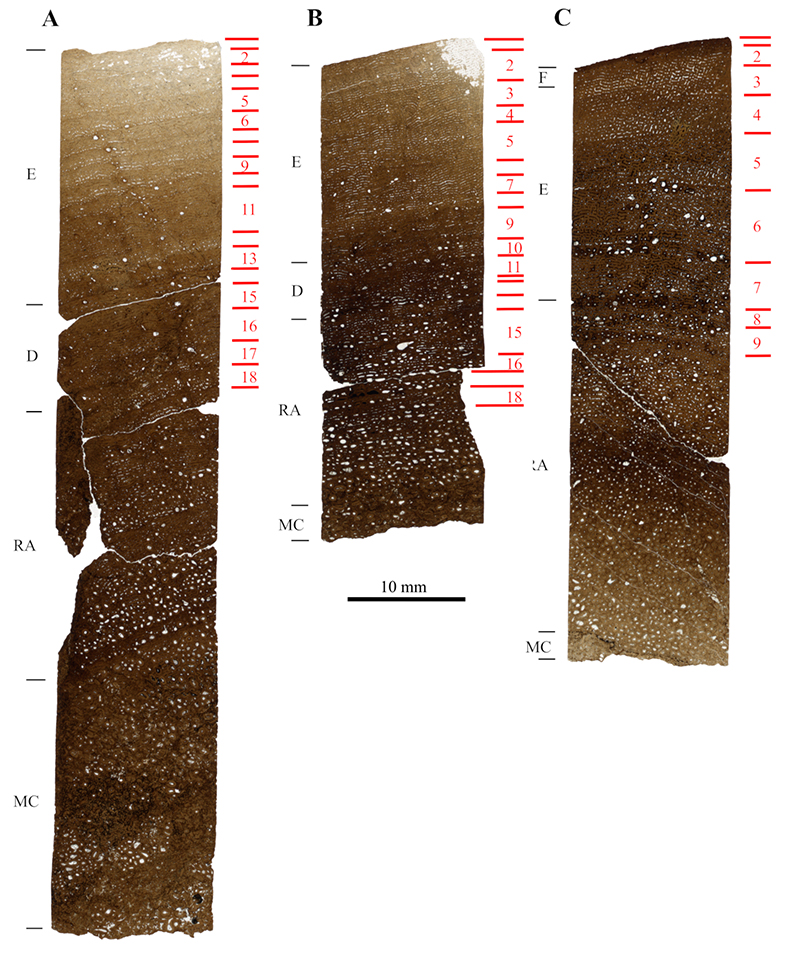
FIGURE 12. Several histological structures observed in the anterior section of the femur of SMA 0014 “Jacques”. A, Large circular structure, which possesses clear circumferentially orientated vascular canals. B, Close-up of the circular structure and the vascular canals. C, D, F, Cycles which show unorganized bone tissue, and varying vascular canal orientations. E, Close-up of unorganized bone tissue cycle. Images taken under plane-polarized light.
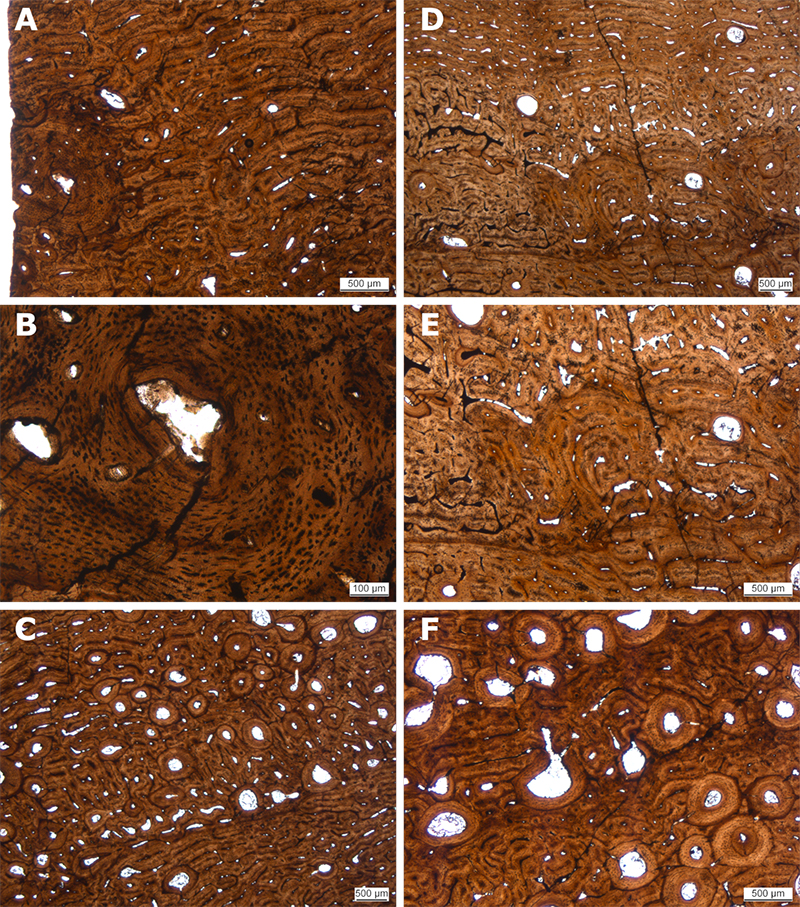
FIGURE 13. Images of all forelimb samples taken from SMA 0011 “Max”. A, humerus (r). B, humerus (l). C, ulna (l). D, radius (l). For all samples, the bone tissue types are indicated to the left, and the number and patterns of the visible growth cycles are indicated to the right. Abbreviations; D: Bone tissue type D, E: Bone tissue type E, F: Bone tissue type F, MC: Medullary cavity, RA: Remodeled area.
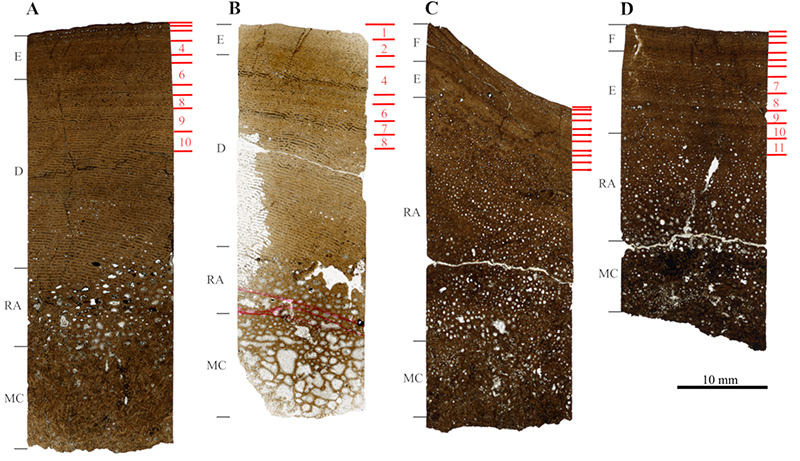
FIGURE 14. Images of all hindlimb samples taken from SMA 0011 “Max”. A, femur (l), drilled on the anterior side. B, femur (l), drilled on the posterior side. C, tibia (l). D, fibula (l). E, SMA M16/12-3 femur (l). For all samples, the bone tissue types are indicated to the left, and the number and patterns of the visible growth cycles are indicated to the right. Abbreviations; D: Bone tissue type D, E: Bone tissue type E, EFS: External fundamental system, F: Bone tissue type F, MC: Medullary cavity, RA: Remodeled area.
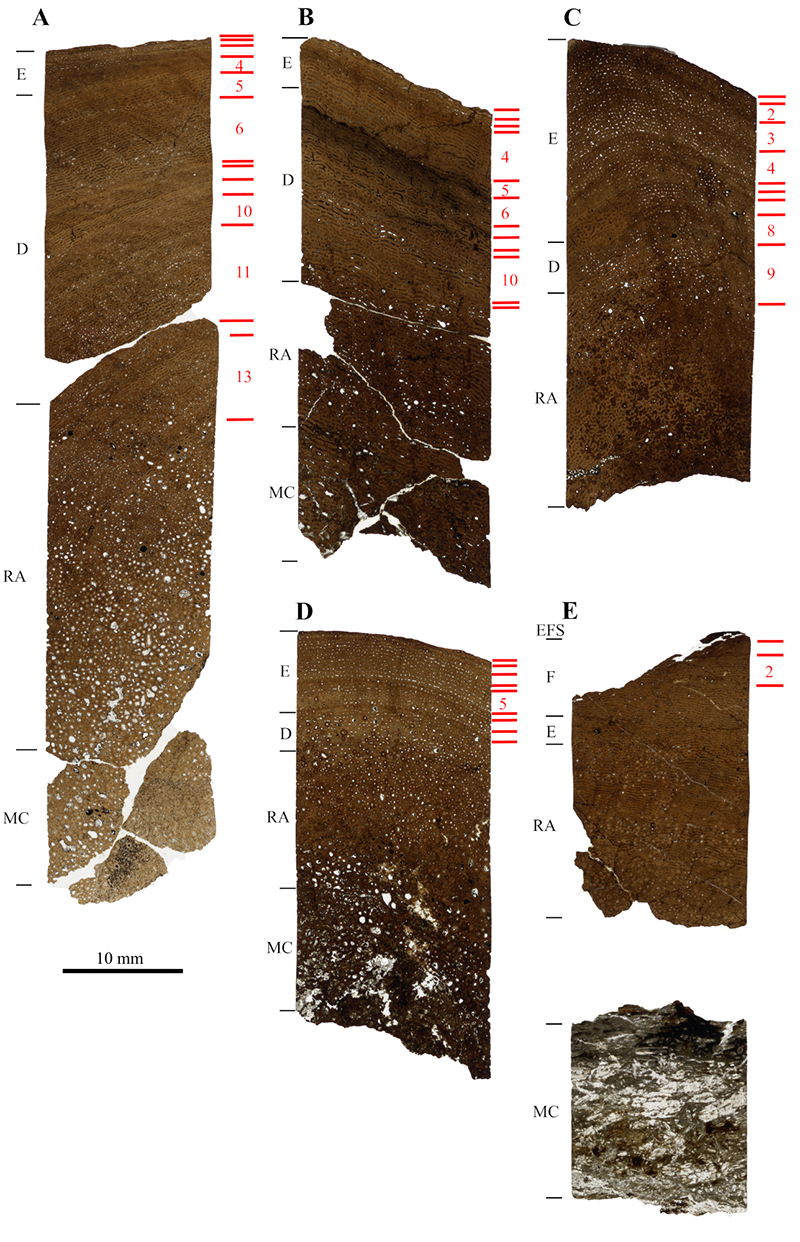
FIGURE 15. Images of both samples taken from SMA 0084 “Rich”. A, tibia (l). B, fibula (l). For all samples, the bone tissue types are indicated to the left, and the number and patterns of the visible growth cycles are indicated to the right. Abbreviations; EFS: External fundamental system, MC: Medullary cavity, RA: Remodeled area.
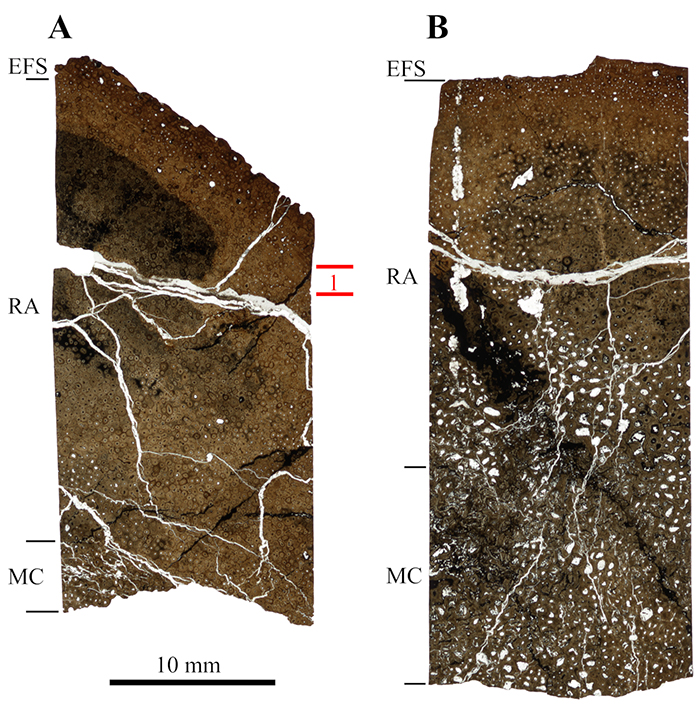
FIGURE 16. Detailed images of the EFS of both the SMA 0084 “Rich” samples. A, EFS of SMA 0084 “Rich” tibia, in which a cycle of faster growth is included (indicated by arrow). B, EFS of SMA 0084 “Rich” fibula, which also shows a cycle of faster growth (indicated by arrow). Images taken under plane-polarized light.
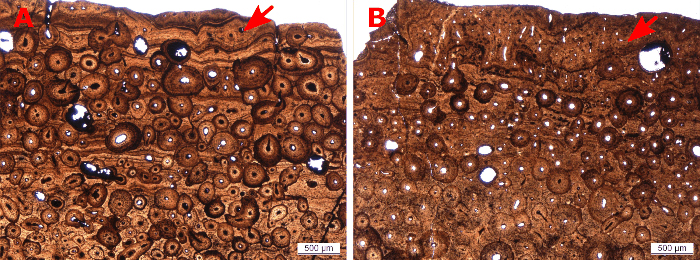
FIGURE 17. Images of all samples taken from SMA 0087 “Chris”. A, femur (r). B, tibia (r). C, fibula (r). For all samples, the bone tissue types are indicated to the left, and the number and patterns of the visible growth cycles are indicated to the right. Abbreviations; E: Bone tissue type E, EFS: External fundamental system, F: Bone tissue type F, MC: Medullary cavity, RA: Remodeled area.
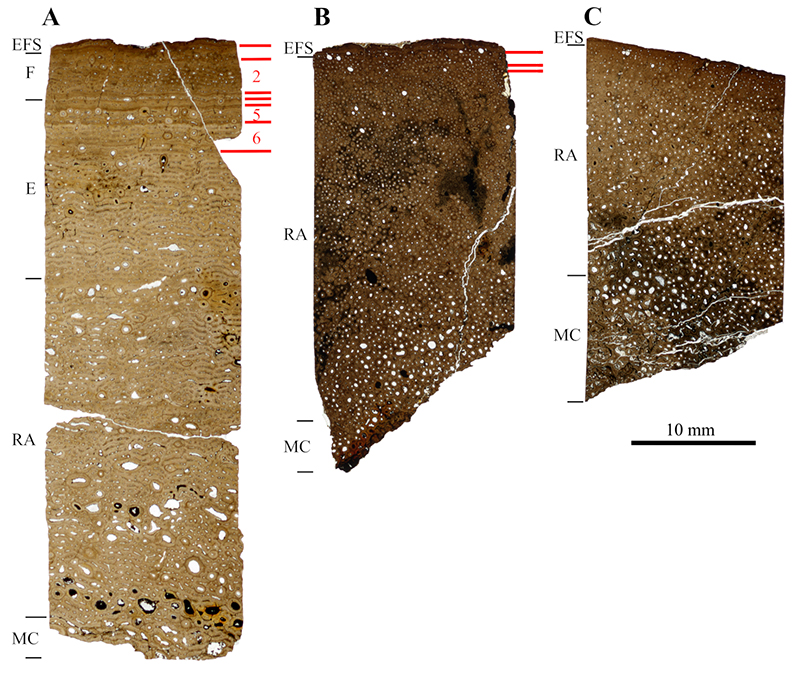
FIGURE 18. Detailed images of the EFS of the SMA 0087 “Chris” samples. A, EFS of SMA0087 “Chris” femur (r), in which a cycle of faster growth is included (indicated by arrow). B, EFS of SMA 0087 “Chris” tibia (r), in which a cycle of faster growth is present (indicated by arrow). C, EFS of SMA 0087 “Chris” fibula (r), which possesses a cycle of faster growth (indicated by arrow). Images taken under plane-polarized light.
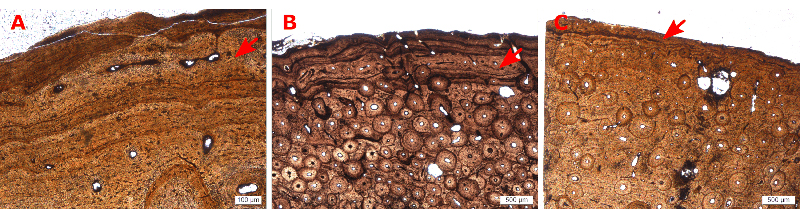
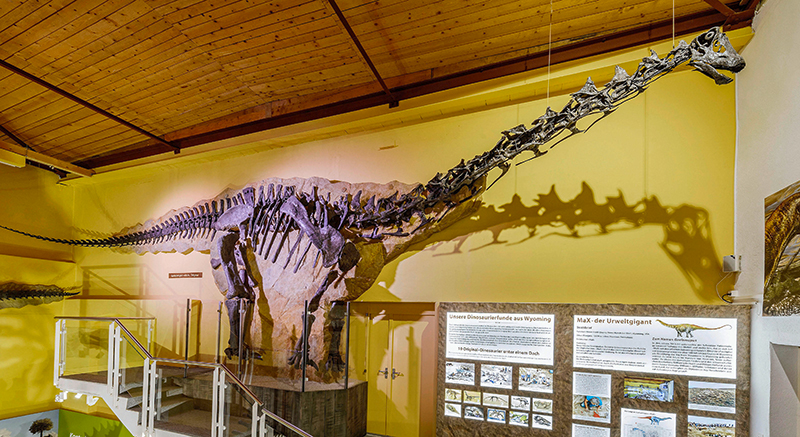
FIGURE 19. Mounted skeleton of Galeamopus sp. SMA 0011 “Max” from Howe Scott Quarry (Howe Ranch, Wyoming, USA) on display at Sauriermuseum Aathal, Switzerland. Length of femur is 1490 mm. Image credit: Urs Möckli, Sauriermuseum Aathal.