FIGURE 1. Geographical location of the Tehuacán Fm. in the state of Puebla, Mexico.

FIGURE 2. Morpho-anatomic diversity of the paleoflora of the Tehuacán Fm. - A: Morphotype 2. Diffuse porosity with solitary and aggregates of vessels (2-3) with tylosis (TS). - B: Morphotype 16. Diffuse porosity with solitary and aggregate vessels (2), vasicentric and banded parenchyma bands (white arrows) (TS). - C: Morphotype 6. Detail of solitary and aggregate vessel elements with dark contents, thick walls and parenchyma bands (TS). - D: Morphotype 12. Long and wide vessel elements and multiseriate rays (RSL). - E: Morphotype 1. Vessel elements with alternate intervascular pits (RSL). - F: Morphotype 4. Short and wide vessel elements with alternating intervascular pits (TSL). - G: Morphotype 3. Biseriate rays (TSL). -H: Morphotype 19. Multiseriate rays and abundant axial parenchyma (TSL). - I: Morphotype 14. Rays mostly biseriate, some uniseriate (white arrows). Scale bar: 250 µm in A, B; 100 µm in C, D, E, G, H, I; 50 µm in F.

FIGURE 3. Distance dendogram showing the anatomical similarity between extant communities, fossil ones and the Tehuacán Fm. paleoflora. *Fossil paleofloras.

FIGURE 4. Projection of the first two principal components displaying the contribution (contrib) and spatial position of each community within the PCA.
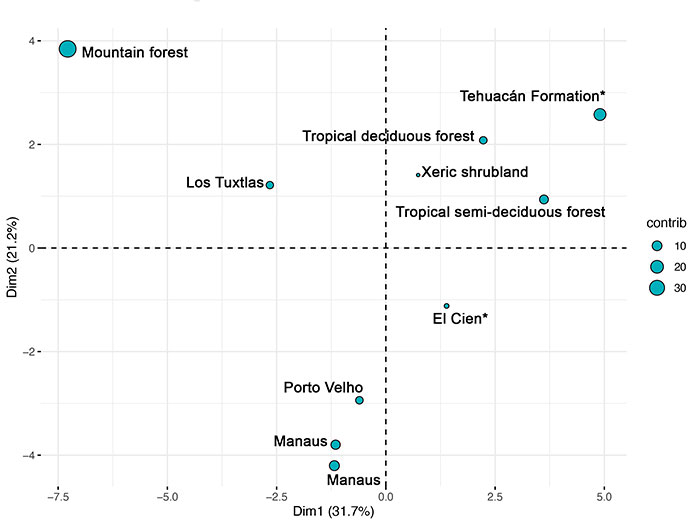
FIGURE 5. Projection of the first two principal components displaying the contribution (cos2) of each anatomical character. (X1) Growth rings, (X2) Vessel grouping, (X3) Vessel frequency, (X4) Vessel diameter, (X5) Vessel wall thickness, (X6) Helical sculpture, (X7) Intervascular pit aperture diameter, (X8) Alternate intervessel pits, (X9) Opposite intervessel pits, (X10) Scalariform intervessel pits, (X11) Simple perforation plates, (X12) Scalariform perforation plates, (X13) Fibre Wall thickness, (X14) Fibre lumen diameter, (X15) Tracheids, (X16) Fibrotracheids, (X17) Libriform fibres, (X18) Parenchyma diffuse in aggregates, (X19) Vasicentric parenchyma, (X20) Aliform parenchyma, (X21) Apotracheal parenchyma bands, (X22) Concentric parenchyma bands, (X23) Marginal parenchyma, (X24) Height of uniseriate ray (μm), (X25) Height of uniseriate ray (Nº cells), (X26) Percentage of uniseriate rays, (X27) Exclusively uniseriate rays, (X28) Width of multiseriate ray (μm), (X29) Width of multiseriate ray (Nº cells), (X30) Length of uniseriate extensions (μm), (X31) Length of uniseriate extensions (Nº cells), (X32) Storied structure, (X33) Heterocellular rays, (X34) Homocellular rays.
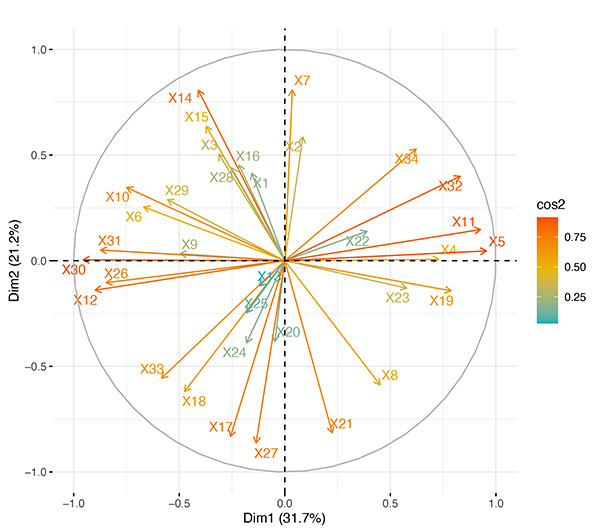
FIGURE 6. Distance dendogram displaying the comparison of the tracheal elements of the Tehuacán Fm. paleoflora with extant communities, fossil ones and Southern California ecological categories in the tracheal elements comparison. *Fossil paleofloras.
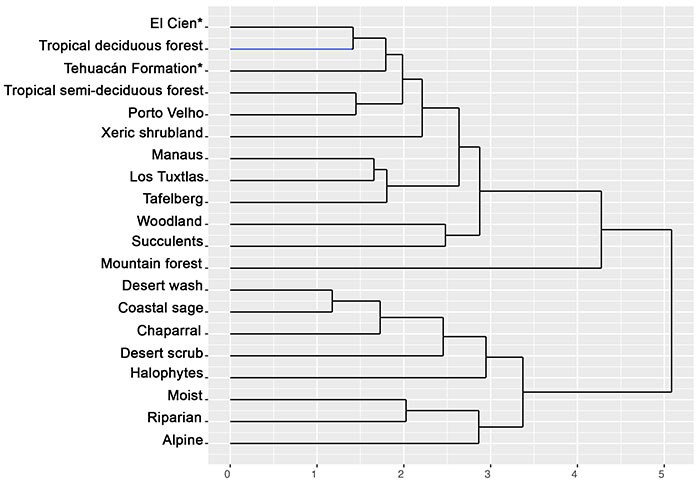
FIGURE 7. Projection of the first two principal components that displays the contribution (contrib) and spatial position of each communities within the PCA.
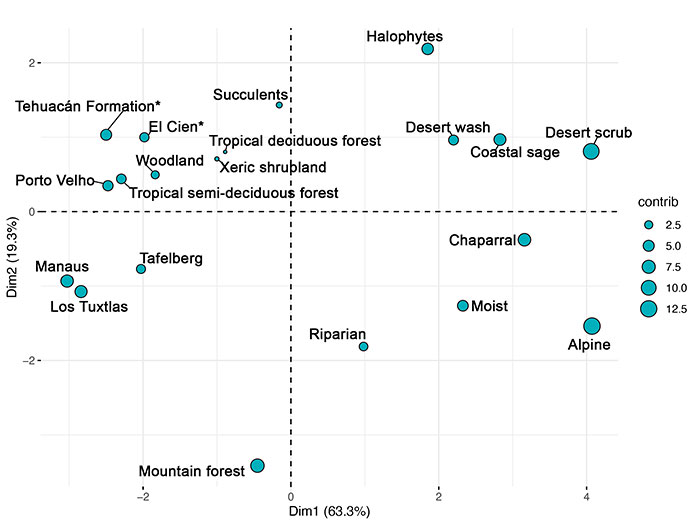
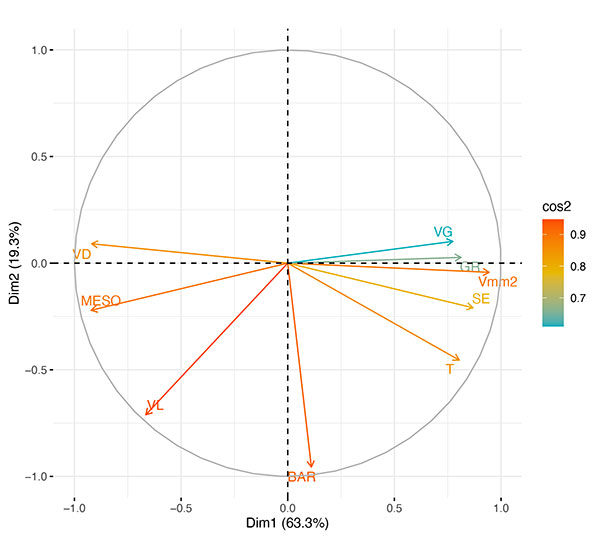
FIGURE 8. Projection of the first two principal components displaying the contribution (cos2) of each tracheal characteristic. Vmm 2 = vessels per square millimeter; VD= mean vessel diameter; VL= mean vessel length; VG= mean vessel grouping; BAR= mean number of bars per perforation plate; T= tracheid proportion; SE= proportion of helical sculpture (latewood+early wood proportions); GR= growing rings; MESO= mesomorphy index.
