FIGURE 1. Index maps showing the geographic position of the study area in the USA (A) and on a generalized geologic map of east-central Arizona (B) showing the most prolific Triassic localities in east-central Arizona, including the Blue Hills (BH), Big Hollow Wash (BHW) and Blue Mesa (BM) in the Petrified Forest National Park (PFNP). The specimen described here probably came from the Blue Hills but may have come from Big Hollow Wash. The modern administrative boundary of the PFNP is in black, the approximate outline of the smaller monument in 1948 is marked by the white inset. Arizona Maps modified from Richard et al., 2002, Arizona Geological Survey publication DGM-17 (http://data.azgs.az.gov/geologic-map-of-arizona)
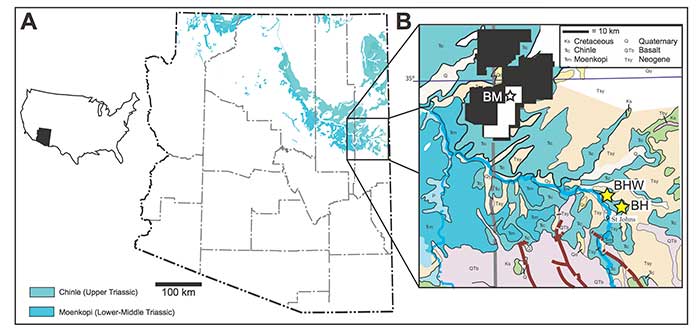
FIGURE 2. Stratigraphy of the lower Chinle in the vicinity of St. Johns, Arizona. Blue Hills and St. Johns Landfill sections from Heckert and Lucas (2003), St. Johns South section is new to this study and described in Appendix 2.
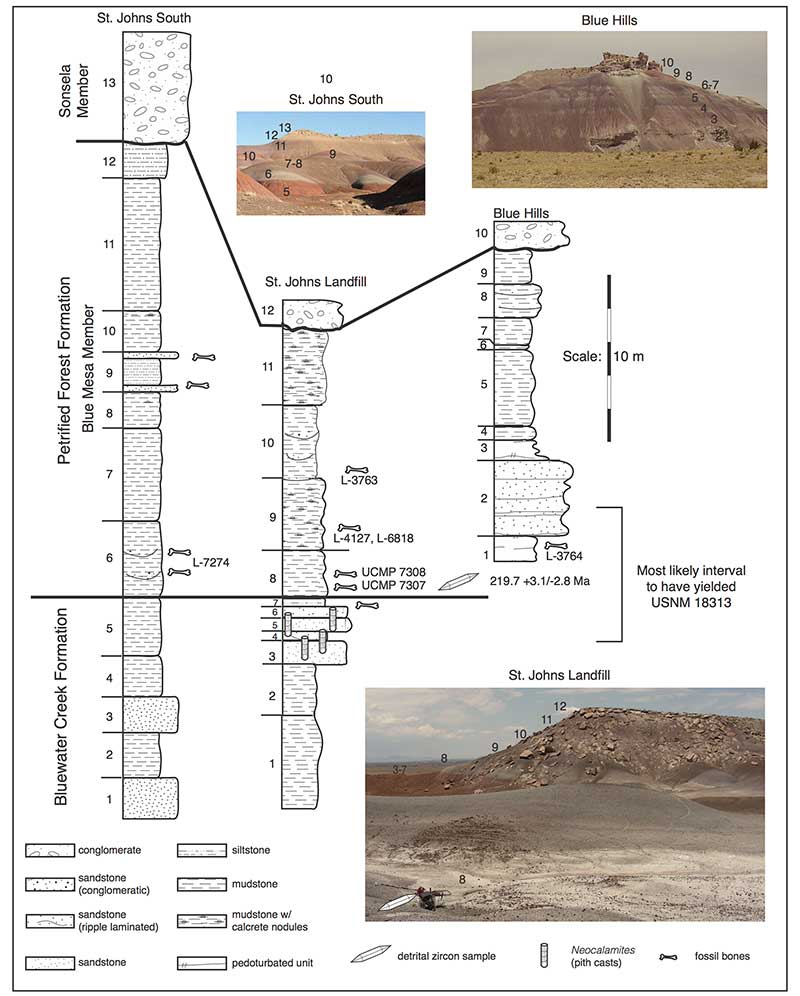
FIGURE 3. Nearly complete skull of USNM 18313 showing taxonomically relevant morphological details. (A) Stereopair of nearly complete skull in right dorsolateral view. (B) Stereopair of skull in posterior view. (C) Posterior portion of skull in dorsal view, with yellow line indicating ODCL. (D) Close-up of right squamosal region in posterior view. Abbeviations: aofe = antorbital fenestra; en = external naris; dps = descending process of squamosal; ltf = lateral temporal fenestra; lfm = lateral flare of maxilla; lfpm = lateral flare of premaxilla; nc = narial crest; ODCL = orbito-dorsal cranial length (after Hurlburt et al., 2003); o = orbit; rs = ridge on squamosal. Scale bars equal 5 cm.
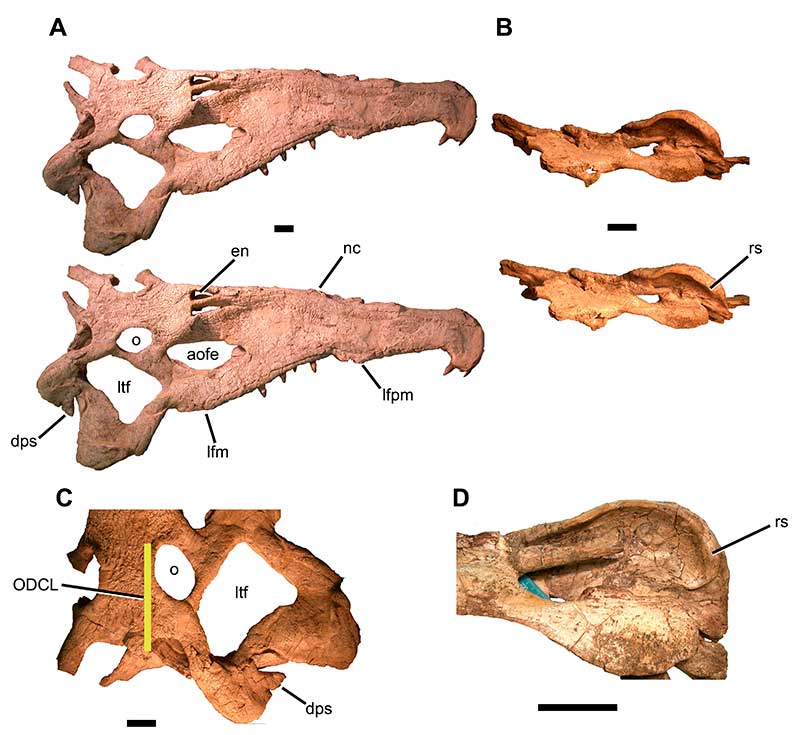
FIGURE 4. Reconstruction of the skeleton of USNM 18313 in left lateral view. Preserved bones are in white, bones that were not preserved are in gray, and pathological elements are in yellow.
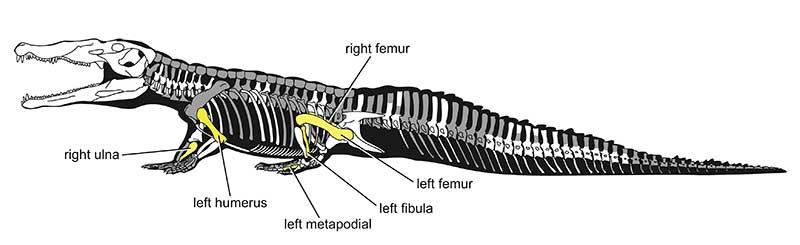
FIGURE 5. Right (A, B) and incomplete left (C, D) humeri of USNM 18313 in dorsal/lateral (A, C) and ventral/medial (B, D) views. Abbreviations: ect = ectepicondyle; eg = entepicondylar groove; ent = entepicondyle; hh = humeral head; pb = pathological bone; x-x’ = location of histological thin-section shown in Figure 5. Scale bar equals 5 cm.
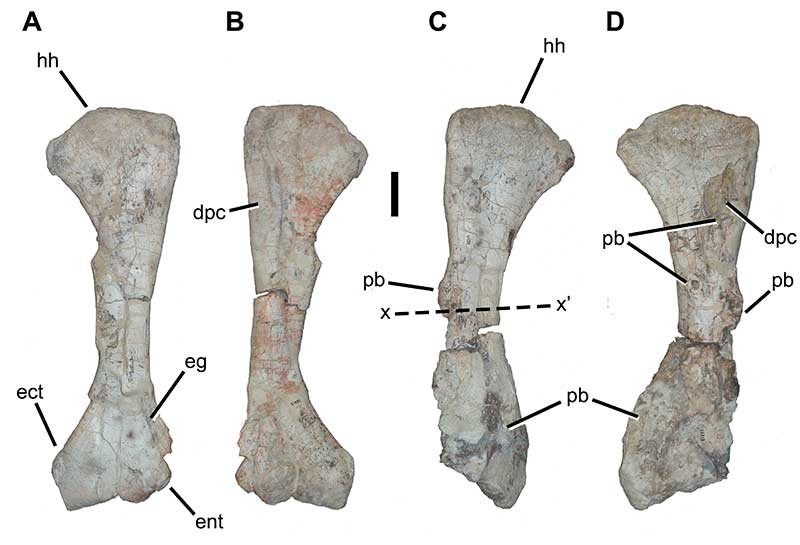
FIGURE 6. Movie showing rendered CT-scan of humeri of USNM 18313. Pathological bone on the left humerus is highlighted in yellow. Click here to download Quicktime movie.
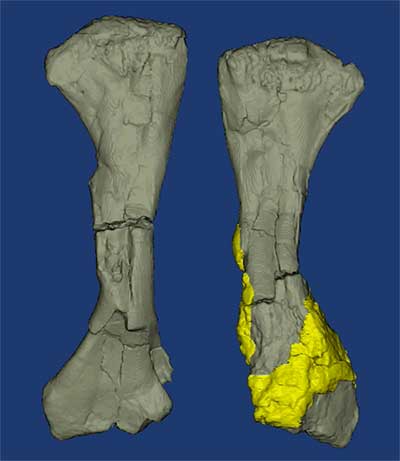
FIGURE 7. Histological section of left humerus of USNM 18313 in distal view (A-B) Overview of complete section showing regions highlighted in C-D, with color-added version (B) to highlight different tissues. (C) Normal lamellar cortical bone (top) transitions into the woven bone of the medullary cavity (bottom); (D) Periosteal new bone formation composed of woven bone arranged nearly perpendicularly to the eroded lamellar cortical surface; fragments of normal cortical bone and remodeled bone are taphonomically juxtaposed. Abbreviations: ecb = eroded cortical bone; LAGs = lines of arrested growth; lcb = lamellar cortical bone; mc, medullary cavity; pnb = new periosteal bone (pathological); rb = remodeled bone. Colors: red = spongy bone of medullary region; yellow = lamellar cortical bone; blue, periosteal new bone (pathological); green = remodeled bone (pathological). Scale bars equal 1 cm (a-b) and 5 mm (c-d).
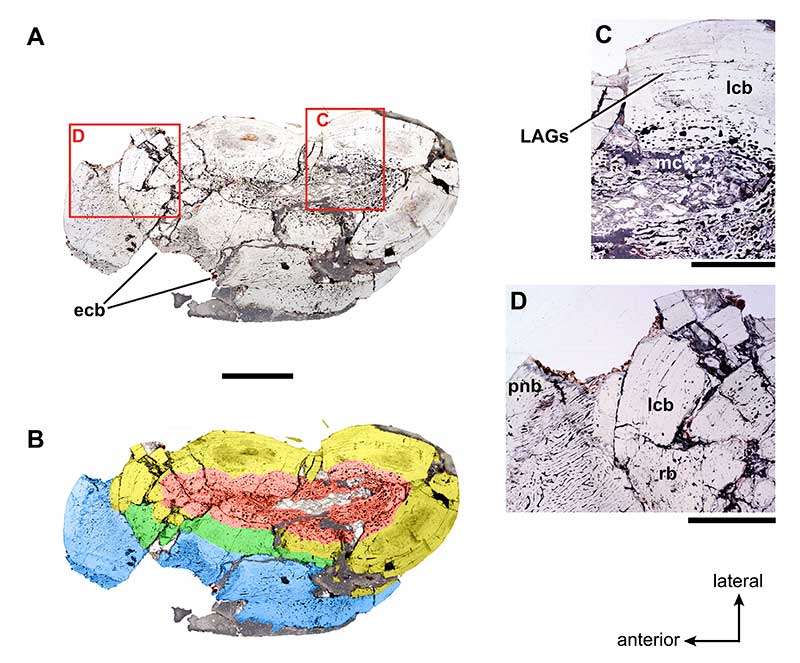
FIGURE 8. Left (A, B) and right (C, D) ulnae of USNM 18313 in medial (A, D) and lateral (B, C) views. Abbreviations: op = olecranon process; pb = pathological bone; pbl = pathological bone lesion; ra = radial articulation. Scale bar equals 5 cm.
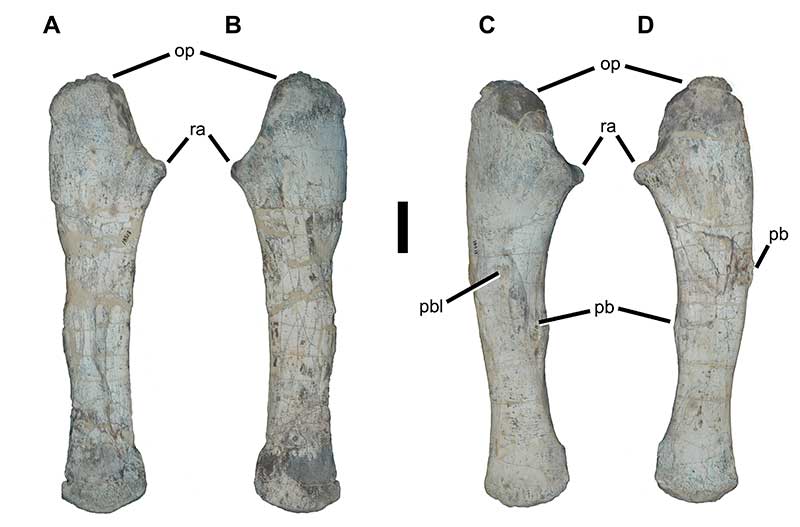
FIGURE 9. Movie showing rendered CT-scan of right ulna of USNM 18313. Pathological bone is highlighted in yellow. Click here to download Quicktime movie.
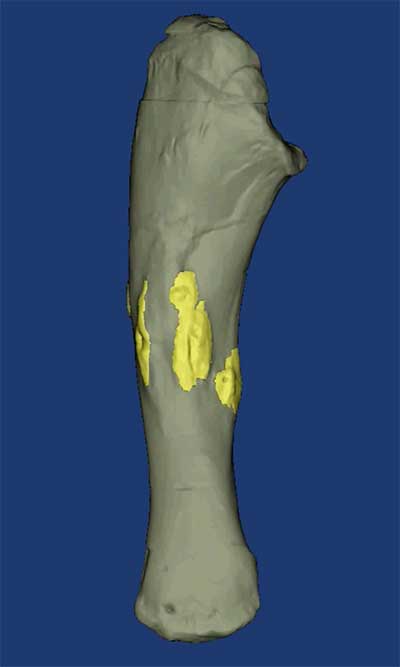
FIGURE 10. Left (A, B) and right (C, D) femora of USNM 18313 in ventral (A, C) and dorsal (B, D) views. Note that the right femur is distorted such that (C) is closer to anteroventral. Note that the right femur is distorted such that (C) is closer to posterolateral. Abbreviations: fc = fibular distal condyle; fh = femoral head; ft = fourth trochanter; gt = greater trochanter; pb = pathological bone; tc = tibial distal condyle. Scale bar equals 5 cm.
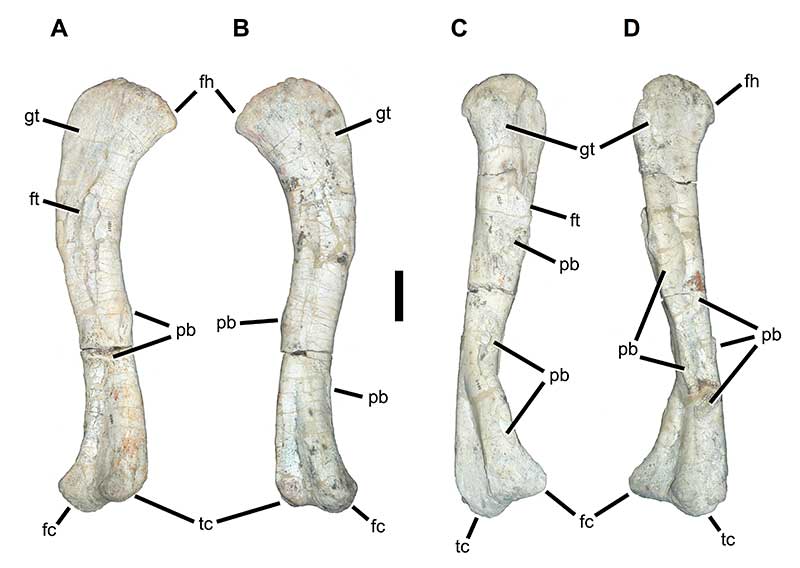
FIGURE 11. Movie showing rendered CT-scan of distal (top) and proximal (bottom) halves of right femur of USNM 18313. Pathological bone is highlighted in yellow. Click here to download Quicktime movie.
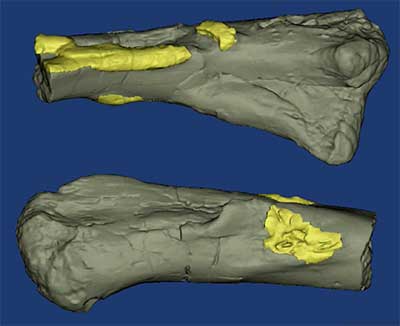
FIGURE 12. Left fibula of USNM 18313 in anterior (A), lateral (B), posterior (C), and medial (D) views. Abbreviations: ifp = iliofibularis process; pb = pathological bone; pbl = pathological bone lesion. Scale bar equals 5 cm.
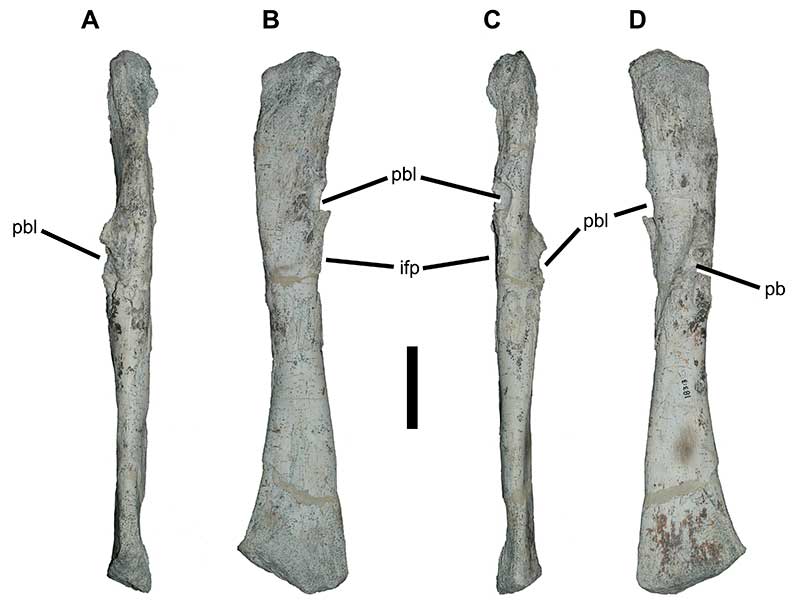
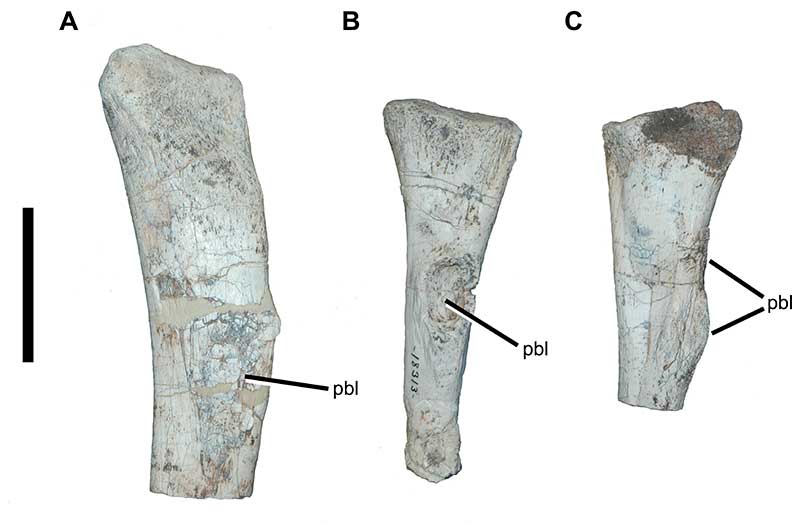
FIGURE 13. Additional pathological elements of USNM 18313. (A) Probable right fibula, proximal end in lateral view. (B) Left metapodial. (C) Metapodial. Abbreviation: pbl = pathological bone lesion. Scale bar equals 5 cm.