FIGURE 1. Example of background and foreground automatic detection in (A) Erinaceus europaeus femur, and (B) Eryops megacephalus femur. Centers were automatically detected in (A) and manually positioned in (B). Here, sections are segmented in 100 concentric circles and 60 slices for measures of global and radial compactness. Details on bone section preparation can be found in Laurin et al. (2004) and Quémeneur et al. (2013).
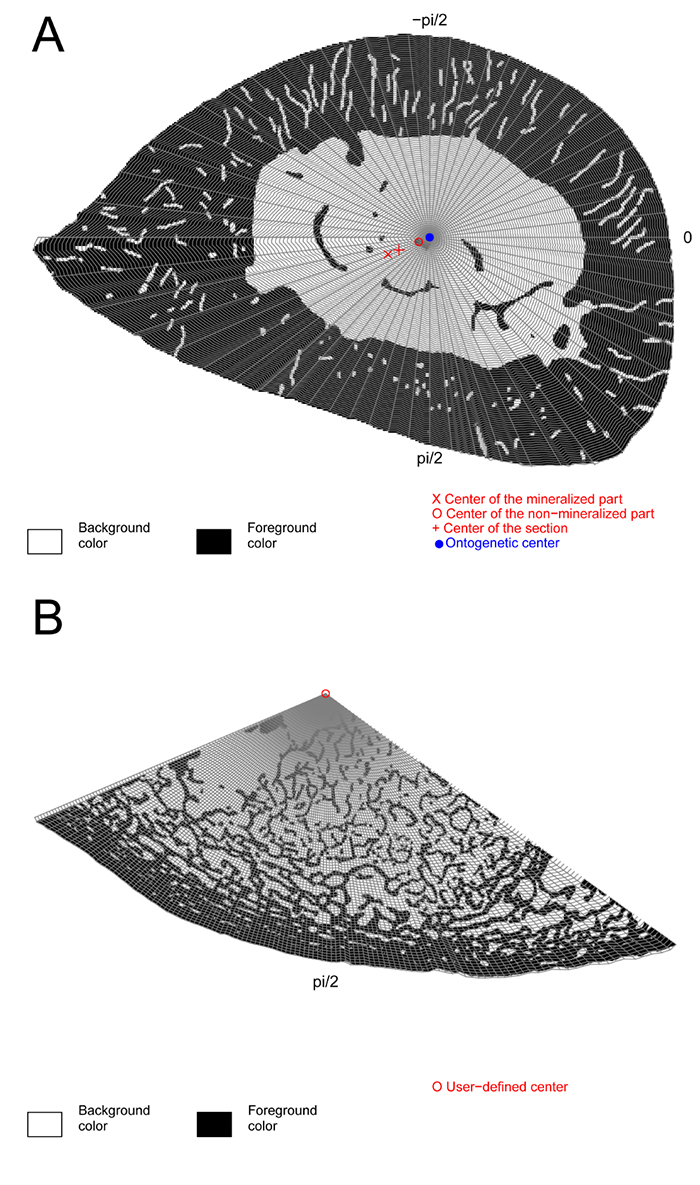
FIGURE 2. Comparison of logistic and flexit fits (A, B) of the Erinaceus europaeus femur shown in Figure 1A and (C, D) of the Eryops megacephalus femur shown in Figure 1B. Table 1 shows the AIC and Akaike weight values for these models.
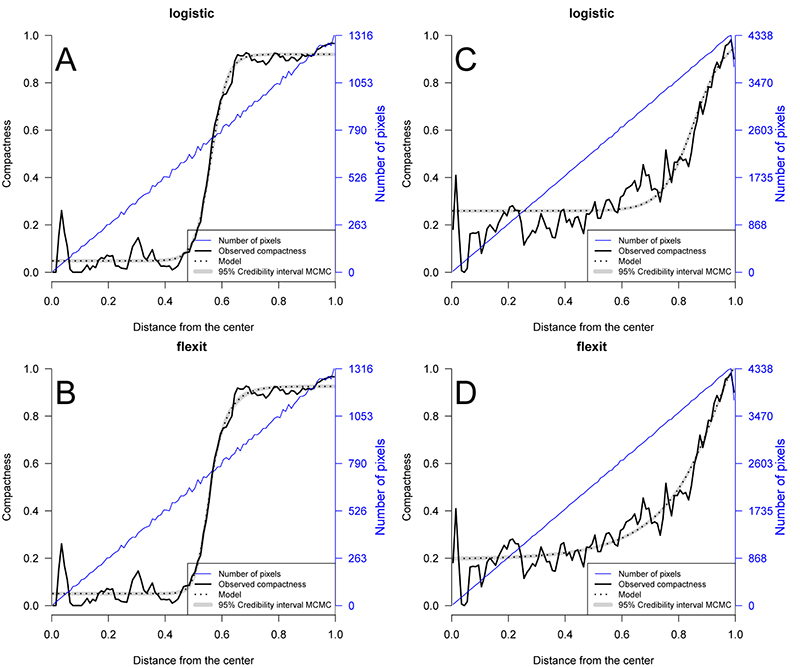
FIGURE 3. Posterior distribution of K 1 and K 2 parameters of the flexit model applied on Erinaceus europaeus femur (A, B) and on Eryops megacephalus femur (C, D). A -1000 to +1000 uniform prior distribution was used. K 1 = K 2 = 1 shown in interrupted line is the logistic equation.
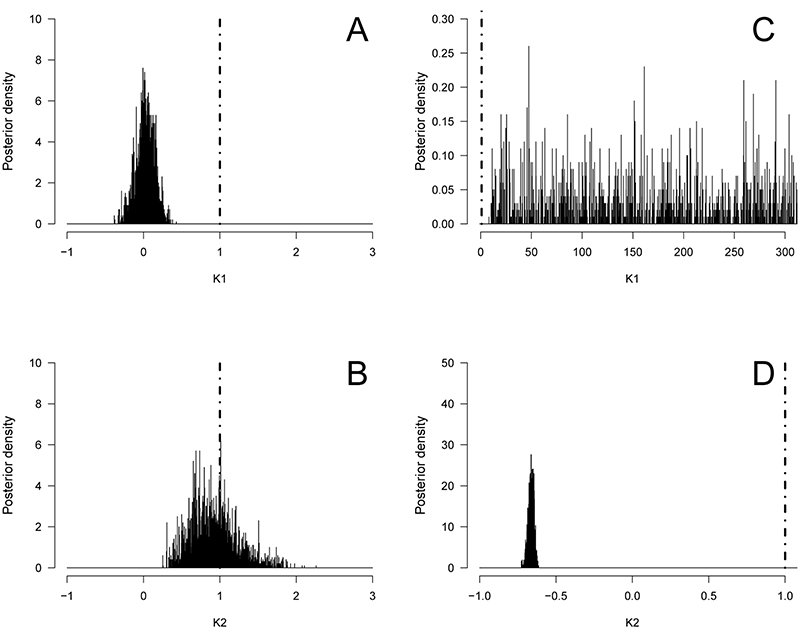
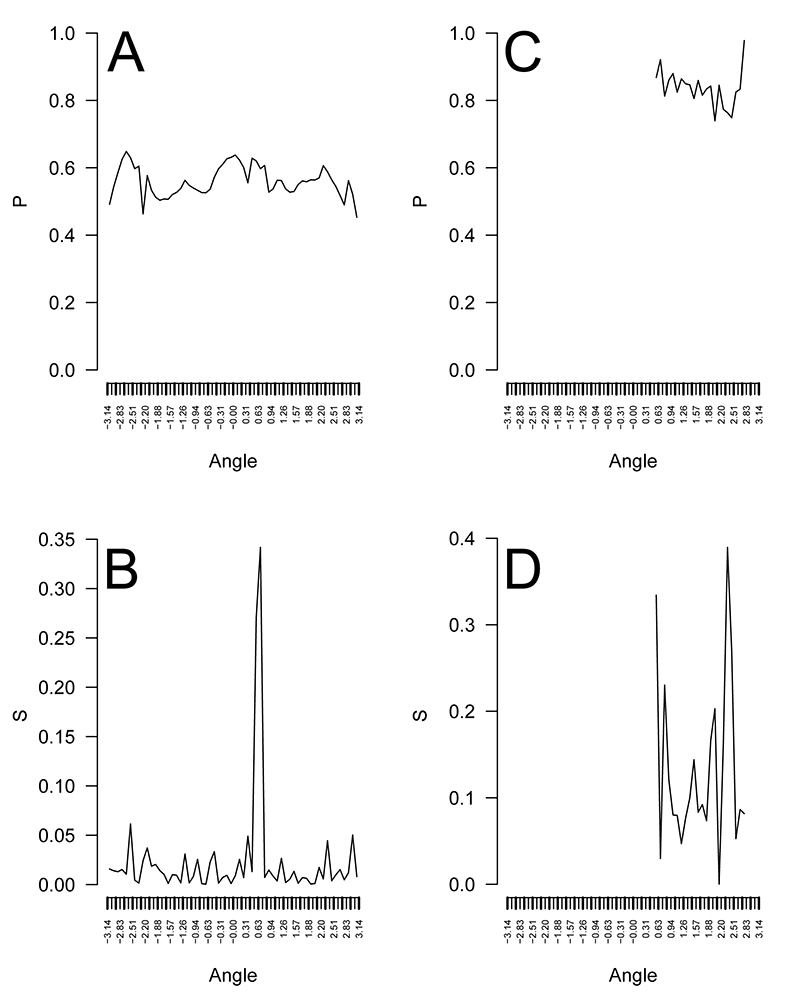
FIGURE 4. P and S for radial compactness analysis of (A, B) Erinaceus europaeus and (C, D) Eryops megacephalus femur using the flexit model.