FIGURE 1. Geographic distribution of the localities from western Mediterranean (circles), Balkans (stars), and western Anatolian (squares) basins. Dashed contours depicting the areas with Vallesian localities sampled. 1. Vallès-Penedès Basin (Santiga, Can Llobateres, Can Poncic); 2. Teruel Basin (Concud, El Arquillo); 3. Cabriel Basin (Venta del Moro); 4. Axios Valley (Pentalophos, Ravin de la Pluie, Ravin des Zouaves-5 and Dytiko sites); 5. Thessaly (Perivolaki); 6. Mesta Valley (Hadjidimovo); 7. Chalkidiki Peninsula (Nikiti-1 and Nikiti-2); 8. Biga Peninsula (Gülpınar); 9. Muğla Yatağan Basin (Şerefköy-2); 10. Samos Island (Mytilinii-A, Mytilinii-B).
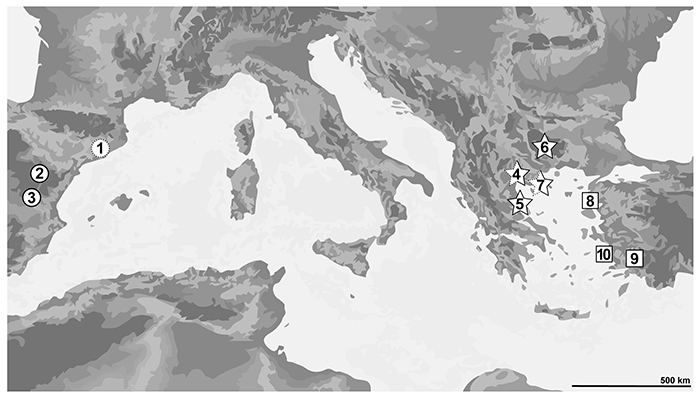
FIGURE 2. Bivariate plot showing the mean and the standard error of the mean for the complexity (Asfc) and anisotropy (epLsar) variables. The symbol type (circle/square) represents the region, the filling of the symbol differentiates between hipparionin size types, and the color if they are from Vallesian (grey) or Turolian (black) assemblages. Extant wild Equus africanus asinus (A) and Equus quagga burchelli (B) are included for comparison.
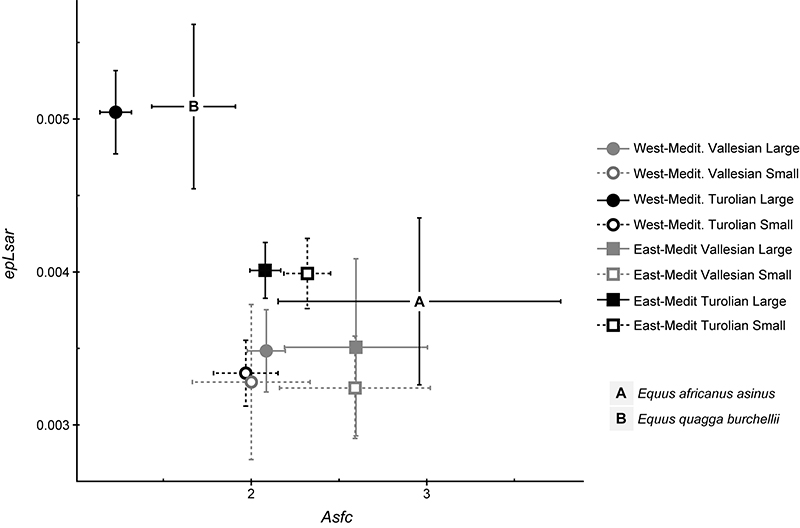
FIGURE 3. Bar charts with the mean and the standard error of the mean of the four DMT parameters for each hipparionin group. Small-sized forms shown in light grey, larger ones in dark grey. A: Asfc. B: epLsar. C: HAsfc. D: Tfv
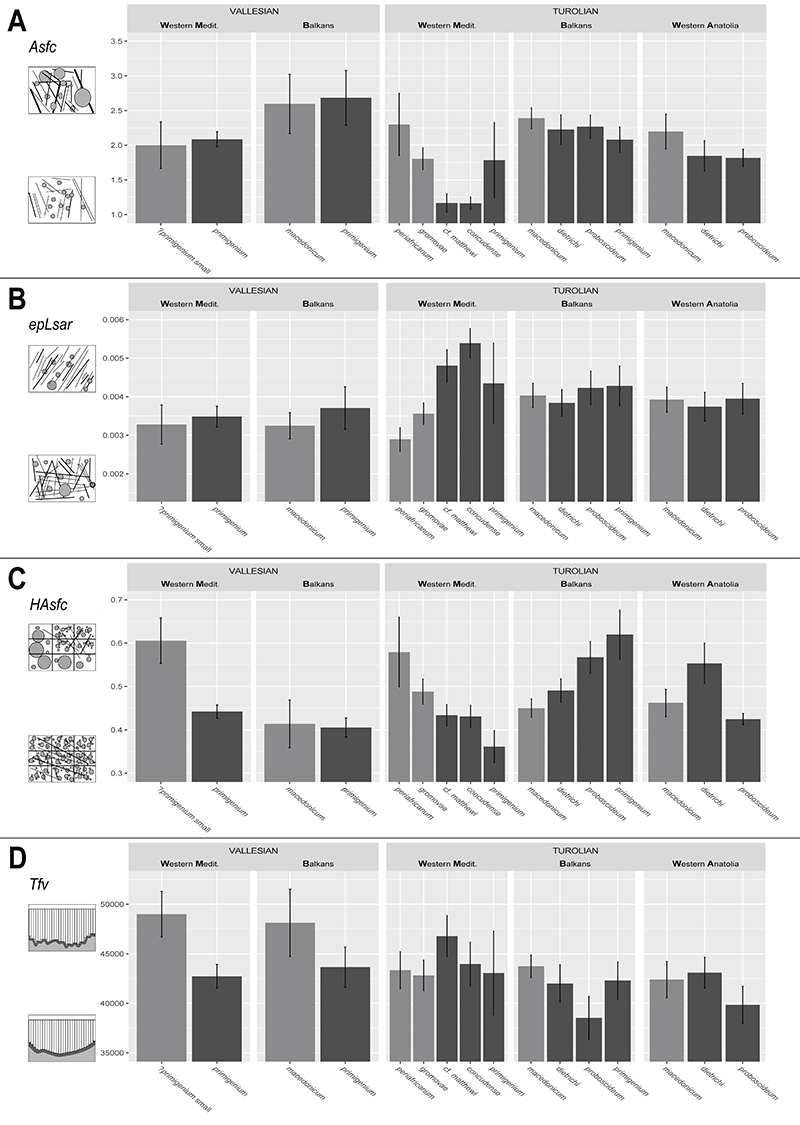
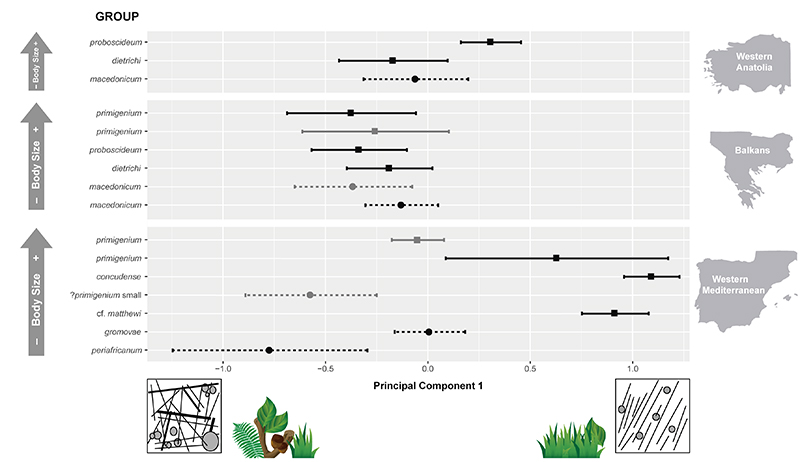
FIGURE 4. Mean values and confidence intervals (2× standard error of the mean) of the microwear Principal Component 1 for each hipparionin group. Dashed lines used for small-sized groups and continuous for large-sized. Grey color represents Vallesian hipparionins and black color the Turolian hipparionins.