FIGURE 1. Chronology of lion lineages based on the data from the fossil record and molecular and paleogenetic researches, referred in the “State of art” section. The grey color in the Panthera spelaea lineage suggests questionable evolutionary position of these lion forms. American lions probably represent a separate lineage. The Quaternary chronostratigraphy system is created with the TimeScale Creator software, v. 8.0 (2021).
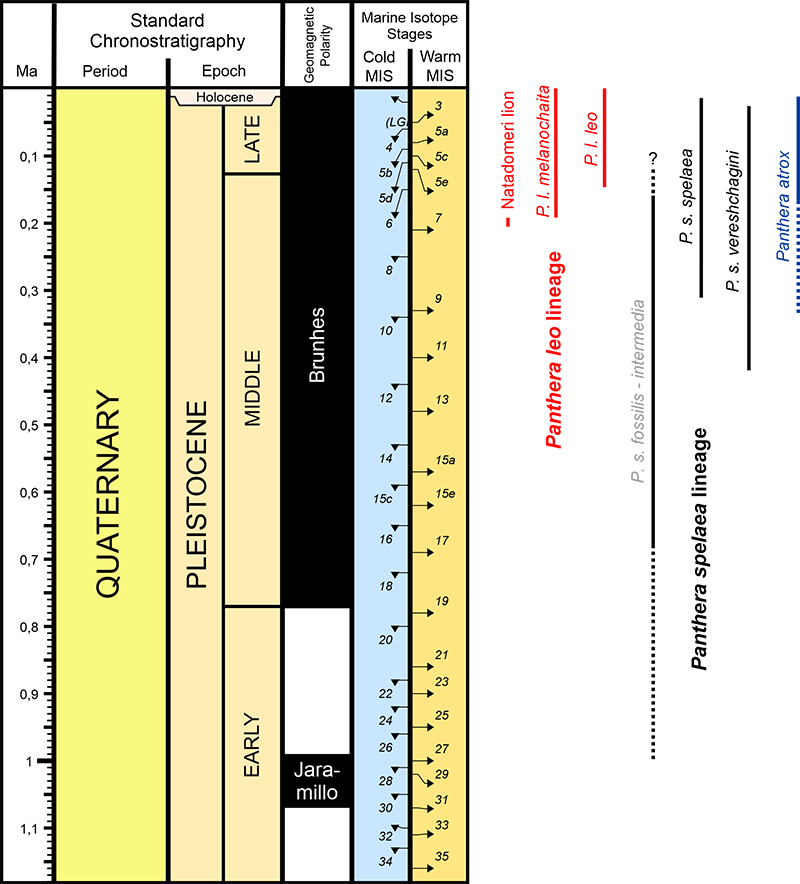
FIGURE 2. The 12 linear cranial characters measured on lion crania. 1: greatest cranial length (L, measured as the distance between the prosthion and the acrocranion), 2: palatal length (LP, measured parasagittally as the distance between the prosthion and the staphylion), 3: medial length of nasals (LMN, measured parasagittally as the distance between the naso-frontal suture and the dorsal margin of the external narial opening), 4: lateral length of nasals (LLN, measured as the distance between the naso-frontal suture and the anteriormost tip of the nasal), 5: greatest nasal width (BN, measured at rostral projection of nasals), 6: the snout width (BS, measured at the level of upper canines), 7: interorbital width (IOB, distance between orbits), 8: maximum cranial width across zygomatic arches (BZ), 9: width across postorbital constriction (POC), 10: greatest neurocranial width (BNC, greatest distance between lateral margins of braincase: euryon-euryon), 11: mastoid width (BM, measured across mastoid processes), and 12: greatest diameter of the auditory bullae (LAB). Cranium drawing modified according to Argant (1991).
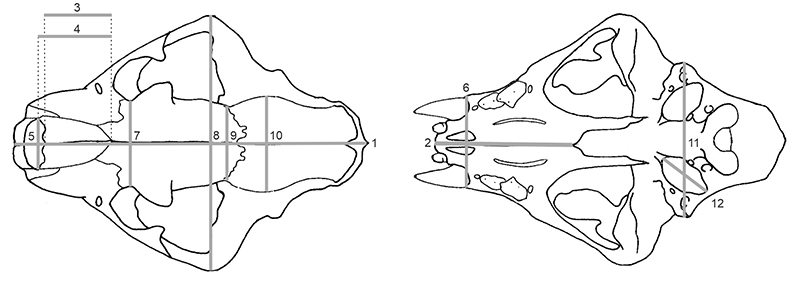
FIGURE 3. Profile depths (blue) and angular variables (red) measured on lion crania. Angle A: the cranial profile angle (nasale-frontale angularity), angle B: the angle between narial aperture and nasofrontal profile (premaxillary-nasofrontale angularity), and angle C: the angle between alveolar margin and postorbital process (maxillary-frontale angularity). Cranium drawing modified according to Argant (1991).
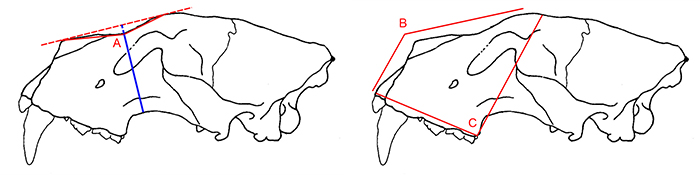
FIGURE 4. The types of lion crania distinguished based on cranial profile with the assumed life reconstruction. A: cranium with the straight nasofrontal profile (0)-cranium of Panthera spelaea from the Medvedia jaskyňa Cave in the Západné Tatry Mts. in Slovakia (Last Glacial), B: cranium with the intermediate profile between type 0 and type 2 (1)-cranium of Panthera spelaea from the Zoolithenhöhle Cave in Germany (Last Glacial), C: cranium with the concave nasofrontal profile (2)-cranium of Panthera fossilis from Azé in France (Holsteinian). © J. Gullár, 2011-2021. The crania are not scaled. Author of illustrations is J. Gullár (please, cite it as: J. Gullár in Sabol et al., 2022).
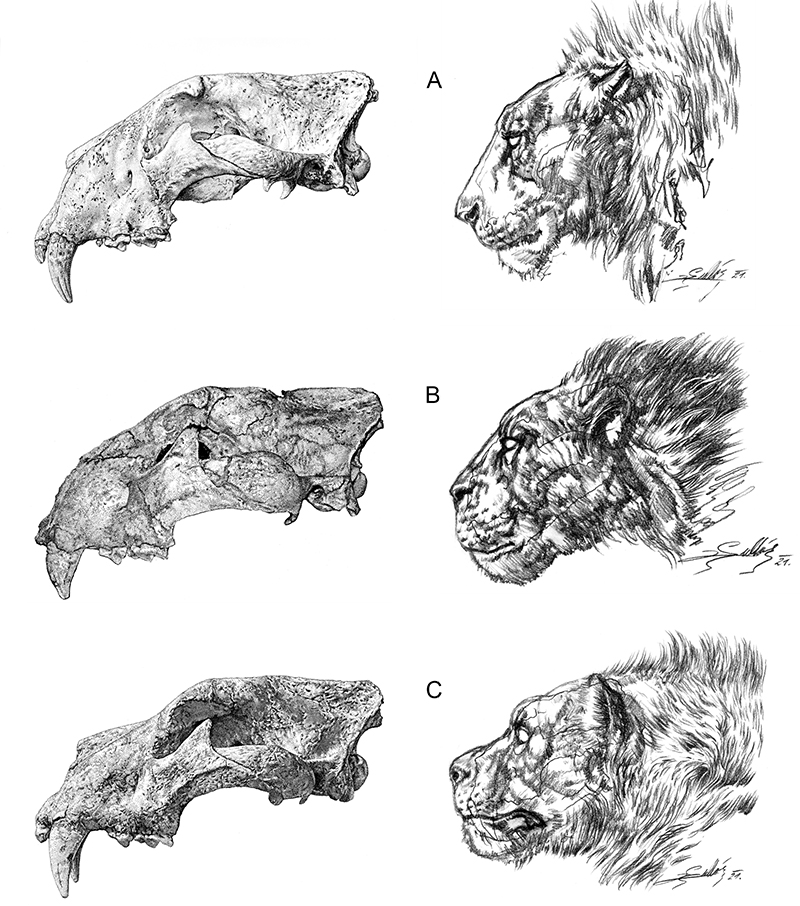
FIGURE 5. Boxplots showing differences in cranial length and in the POC/IOB ratio. The horizontal dashed lines approximately span the minima and maxima in P. leo from Mazák (2010).
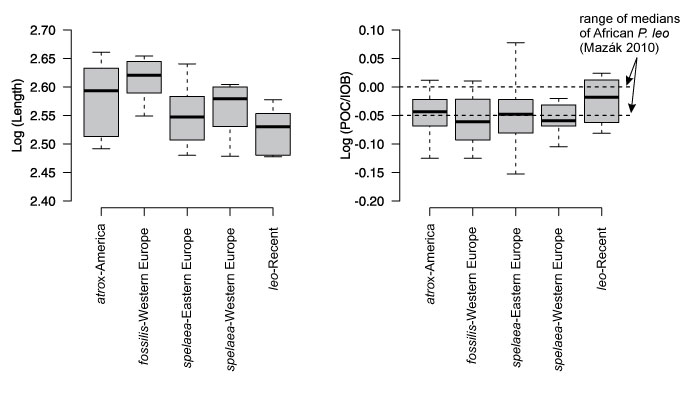
FIGURE 6. Different types of lion heads in Paleolithic art, maybe indicating the cranial profile type 2 (A), probably the cranial profile type 1 (B), and the cranial profile type 0 (C-F). A: a lion head sculpture from Kostenki near Voronezh, Russia (ca. 23 ka BP, redrawn from Efimenko 1958); B: a lion head sculpture from Vogelherd, Germany (ca. 38-33 ka BP, redrawn from Koenigswald and Schmitt 1987); C: a lion head sculpture from Dolní Věstonice, Moravia-Czech Republic (ca. 27-29 ka BP, redrawn from Jelínek 1972); D: a cave lion depicted in La Marche, France (Magdalenian); E: cave lion pair depicted in Chauvet, France (˂ 26 ka BP); F: cave lions depicted in Chauvet, France (˂ 26 ka BP, redrawn from Clottes 2001). © J. Gullár, 2009-2014 (A-C, F) and the archive of M. Sabol (D and E). Author of illustrations A–C and F is J. Gullár (please, cite it as: J. Gullár in Sabol et al., 2022); D and E are from the archive of M. Sabol.
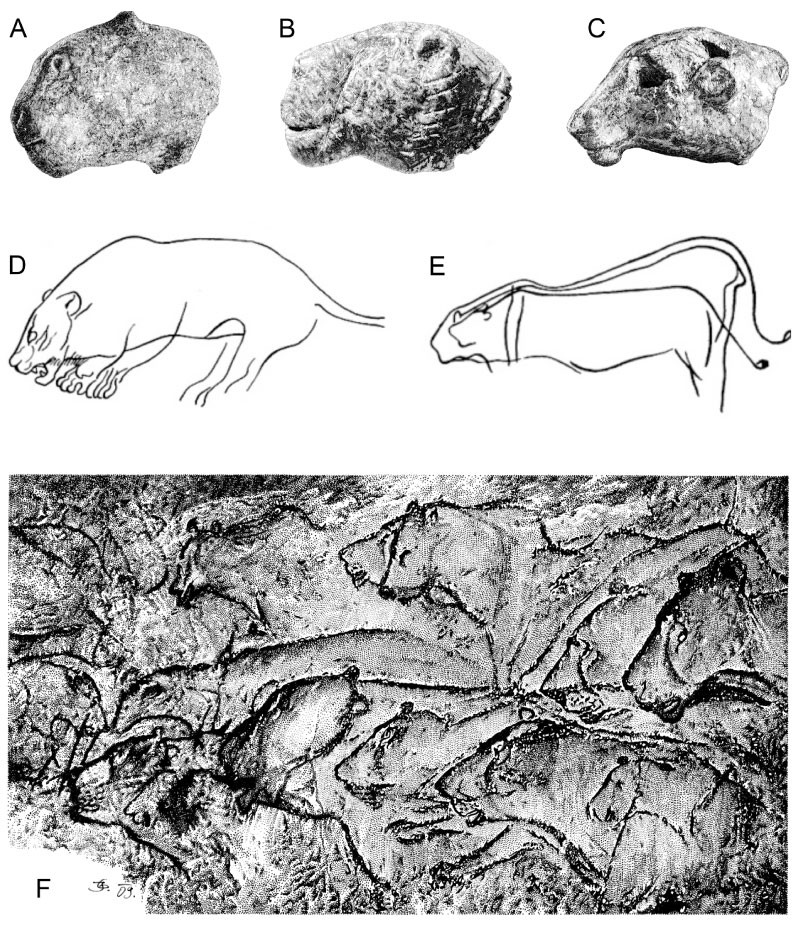
FIGURE 7. Boxplots (median values and the 25th and 75th quantiles, with whiskers showing extreme values) showing that the profile angle and the angle B discriminate between P. fossilis on one hand and other groups of taxa on the other hand. P. leo has higher median angle B than other extinct species of the genus Panthera.
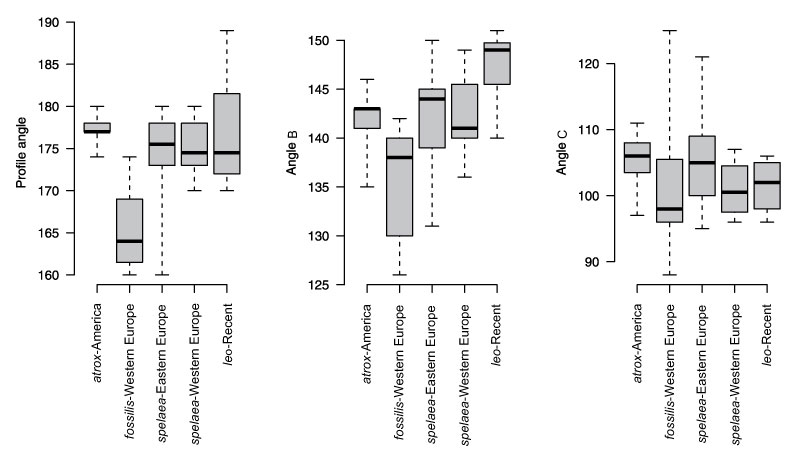
FIGURE 8. Bivariate relationships between the cranial length and nine morphological variables. The lines represent slopes of the relationship between the log-transformed cranial length and nine variables fitted by reduced major axis regression separately for P. fossilis , P. spelaea , and P. leo. Axes are logged.
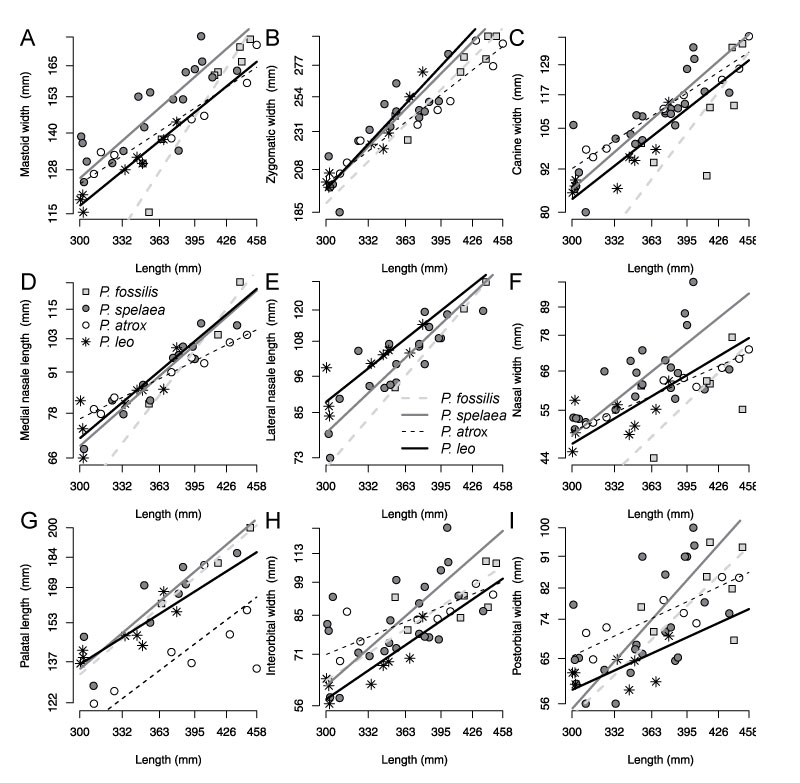
FIGURE 9. The summary of mean allometric coefficients (slopes of the relationship between the log-transformed cranial length and nine variables fitted by reduced major axis regression) with 95% bootstrapped confidence intervals. They show more positive allometry for mastoid width, canine width, medial nasale length, and lateral nasal length in P. fossilis relative to other three species (although 95% confidence intervals are broad). The postorbital width shows negative allometry in P. leo whereas it shows positive allometry in P. spelaea and P. fossilis. The missing values in P. atrox did not allow to measure its allometric coefficients for lateral nasal length.
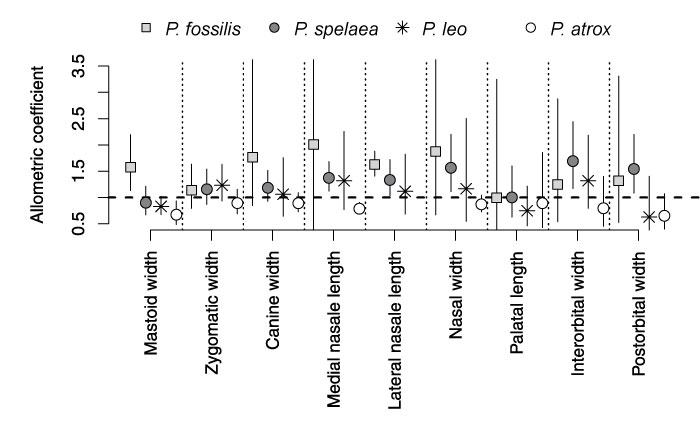
FIGURE 10. A: Principal coordinate analyses based on 14 log-transformed morphometric variables. The first axis is parallel with an overall increase in cranial length. Across its whole range, P. spelaea differs from P. fossilis , and P. fossilis is clearly distinct from P. leo. However, P. spelaea from the Western Europe alone does not differ from P. fossilis. B: Principal coordinate analyses based on 14 log-transformed morphometric variables, excluding P. atrox. This analysis shows that P. spelaea from the Western Europe and the Eastern Europe-Asia do not fully overlap in morphospace. The first PCO axis in both analyses correlates strongly positively with all variables and thus reflects the size axis. Specimen numbers: P. atrox (North America): 1-Ichetucknee, 2-Natural Trap Cave, 3-9-Rancho la Brea; P. fossilis: 10-Mauer (Germany), 11-Azé I-3 (France); P. intermedia: 12-Romain-la-Roche (France), 13-Vence (France), 14-Edingen (Germany), 15-Niedźwiedzia Cave (Poland), 16-San (Poland); P. spelaea: 17-Bottrop (Germany), 18-Huttenheim (Germany), 19-Perickhöhlen (Germany), 20-Siegsdorf (Germany), 21-Zoolithenhöhle (holotype; Germany), 22-24-Zoolithenhöhle (Germany), 25-Zandobbio (Italy), 26-Brno (Czech R.), 27-Sloup (Vienna specimen; Czech R.), 28-Sloup (OK 130570, Czech R.), 29-Srbsko-Chlum Komín Cave (Czech R.), 30-Výpustek 1 (Czech R.), 31-Výpustek 3 (Czech R.), 32-Igrita (Croatia), 33-Ursilor (Romania), 34-Binagady (Caucasus, Georgia), 35-Desna (Russia), 36-37-Isa River (South Ural, Russia), 38-Kondakovka (Russia), 39-Mokhokho (Russia), 40-Uzhur (Central Siberia), 41-42-Medvedia Cave (Slovakia); P. leo (Africa and India): 43-50.
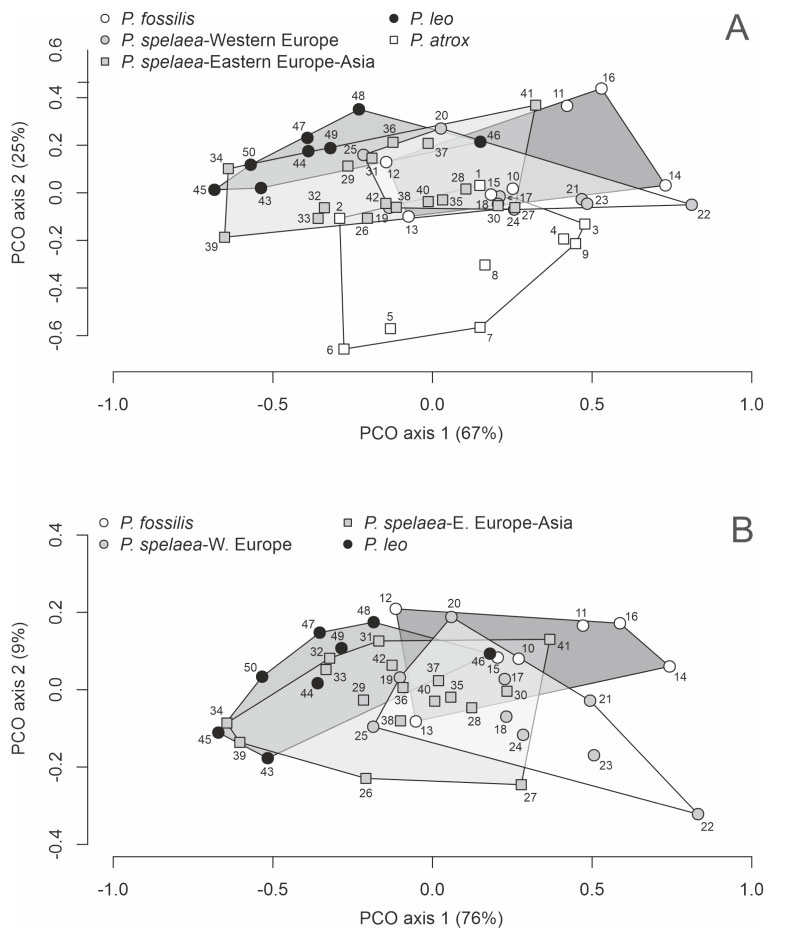
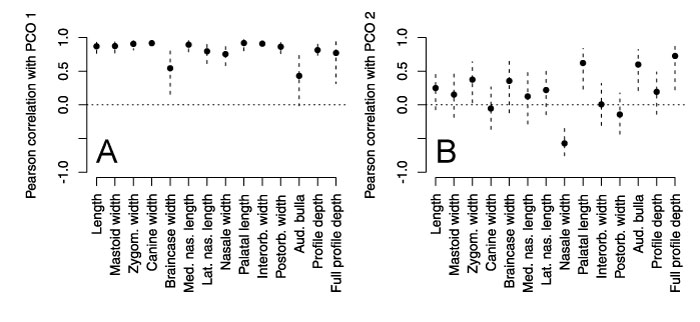
FIGURE 11. A-B: Pearson correlations between the 14 variables and the two PCO axes based on P. leo, P. spelaea, and P. fossilis (thus excluding P. atrox , corresponding to Figure 10B).