FIGURE 1. Simplified phylogeny showing the current understanding of ornithischian relationships, based on Butler et al. (2008). Silhouettes from Phylopic.org. Daspletosaurus by Tasman Dixon, Brachiosaurus by Michael P. Taylor, Lambeosaurus by Craig Dylke (all public domain). Triceratops by Raven Amos, Heterodontosaurus by Jaime Headden, Stegosaurus by Andrew A. Farke, Hypsilophodon by Mathew Wedel (https://creativecommons.org/licenses/by/3.0/). Stegoceras by Caleb M. Brown (http://creativecommons.org/licenses/by-sa/3.0/).
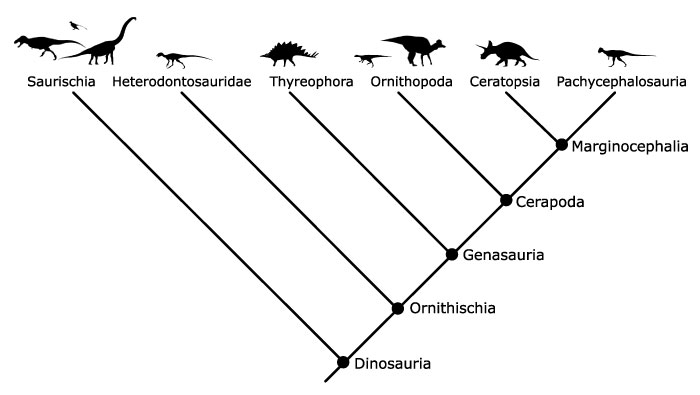
FIGURE 2. Early cladistic analyses of ornithischian phylogeny found by (A) Norman, 1984, and (B) Sereno, 1984. H1 and H2 indicate alternate positions for Heterodontosauridae, and P1 and P2 indicate alternate positions for Pachycephalosauridae.
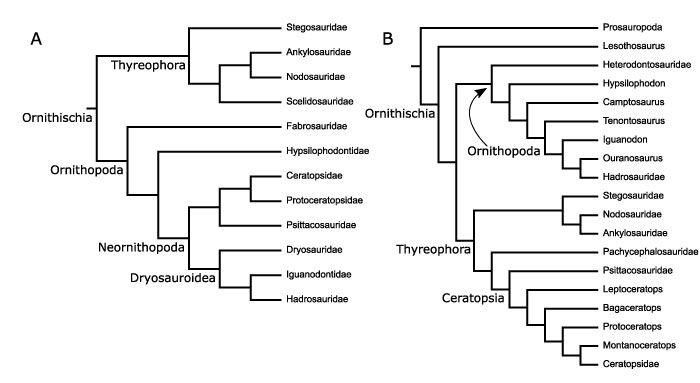
FIGURE 3. Iguanodontian phylogeny as presented by McDonald (2012a). This is an Adam’s consensus tree of 24,460 MPTs, with terminology for higher taxa following Sereno (2005).
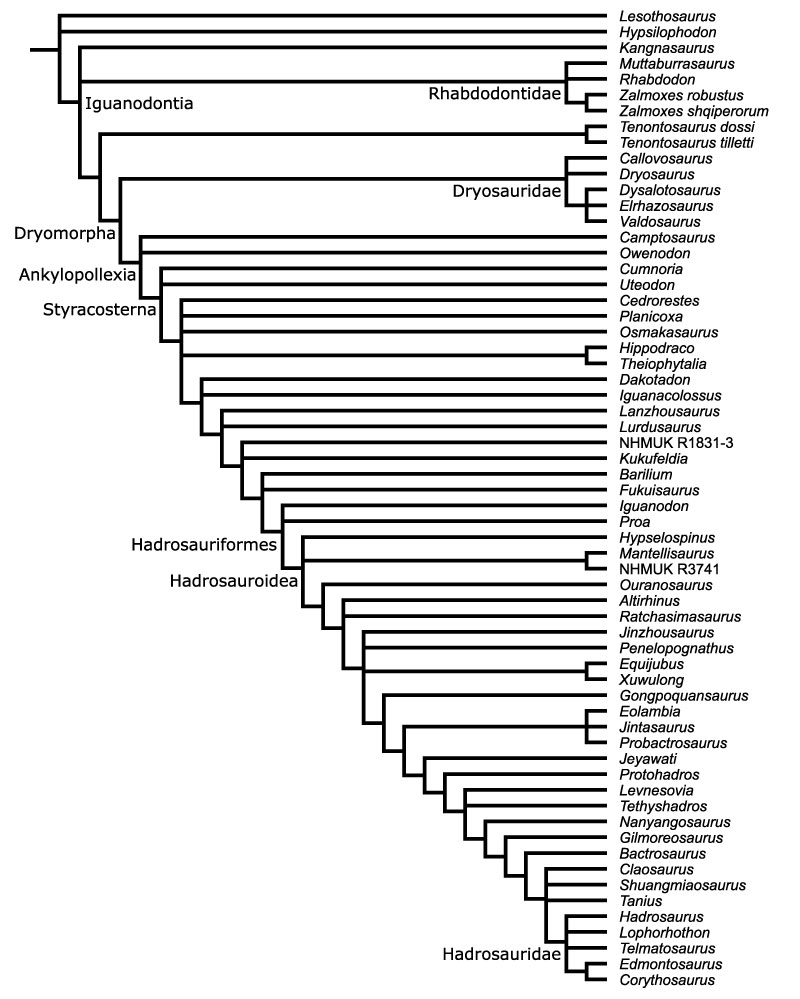
FIGURE 4. Iguanodontian phylogeny presented by Norman (2015). Consensus of three MPTs.
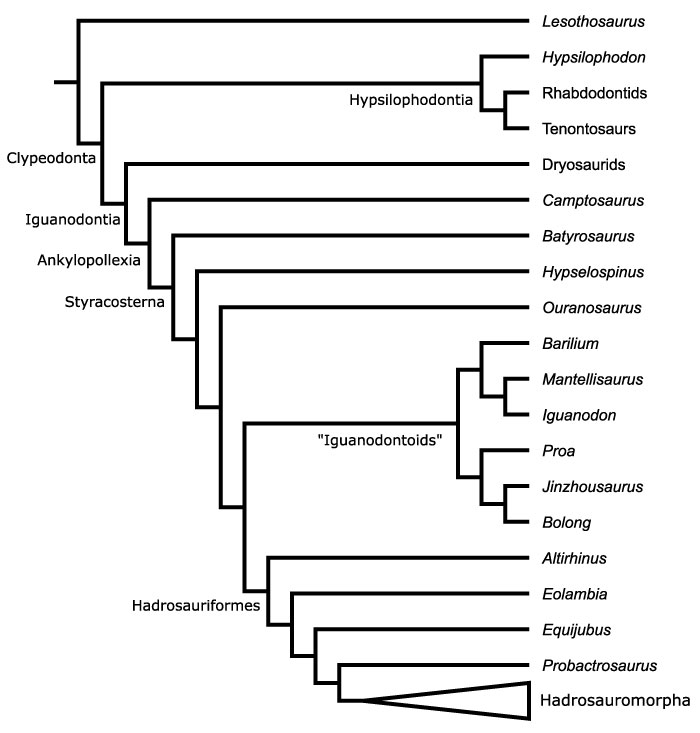
FIGURE 5. Phylogeny of Boyd (2012), cropped to relevant portion with collapsed clades. Note that Thescelosauridae, composed of many taxa previously regarded as basally branching ornithopods, lies outside of both Ornithopoda and Cerapoda. Strict consensus of 36 MPTs.
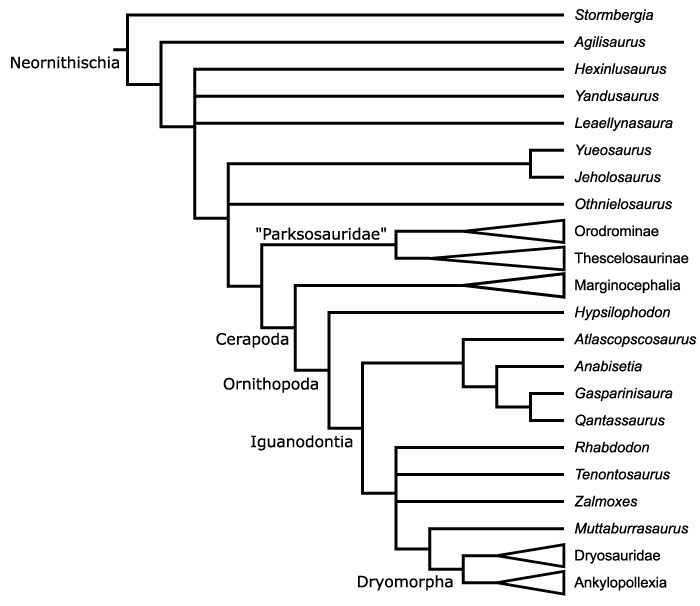
FIGURE 6. Parsimony (left) and Bayesian (right) trees plotted together. Strict consensus of 84 MPTs after pruning Oryctodromeus, Atlascopscosaurus, Planicoxa, Cumnoria, Cedrorestes, and NHMUK R28860. Jackknife values above 20 (with 10% chance of character removal) are shown above and to the left of their respective nodes. Bremer supports above one are shown below and to the left of their respective nodes, and bolded. CI=0.272, RI=0.634. Maximum clade credibility tree produced by Bayesian analysis showing posterior probabilities below and to the right of their respective node.
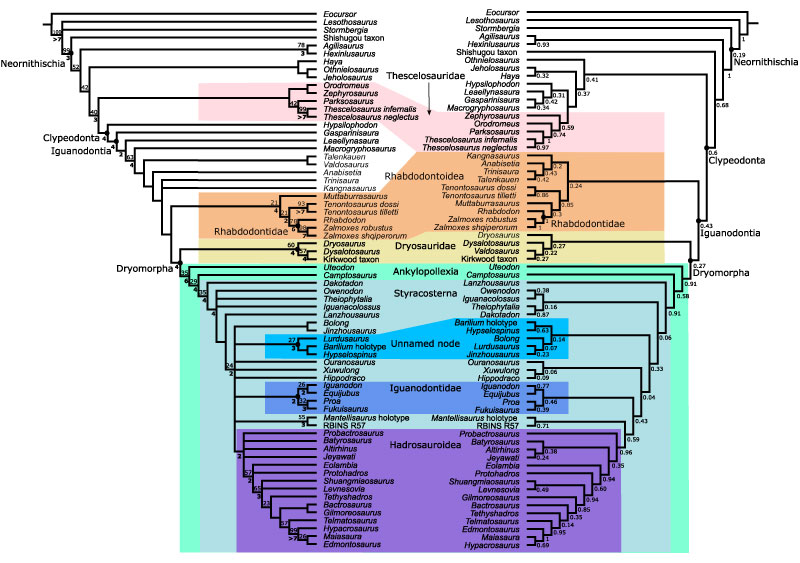
FIGURE 7. Time scaled parsimony tree, showing assigned age ranges and broad-scale geographic data. Jackknife values above 20 (with 10% chance of character removal) are shown above and to the left of their respective nodes. Bremer supports above one are shown below and to the left of their respective nodes, and bolded.
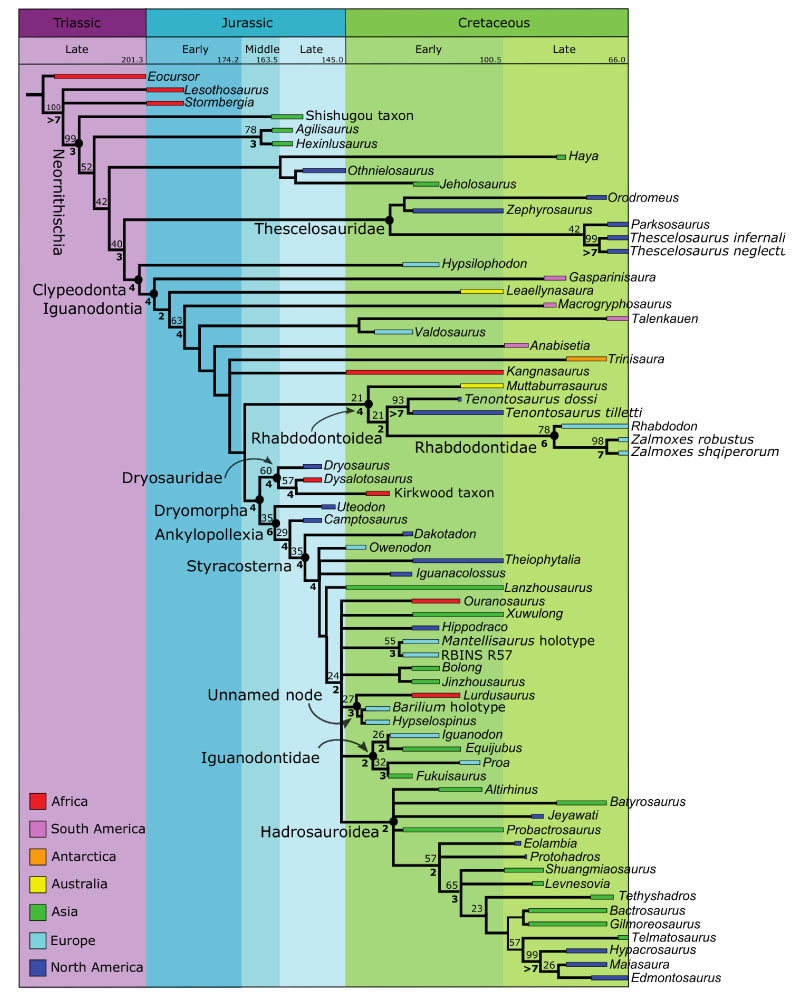
FIGURE 8. Maximum Clade Credibility tree produced by Bayesian analysis. Posterior probabilities are shown to the left of their nodes. The geologic timescale is shown across the top. Tips represent the average age found for each OTU across all sampled trees.
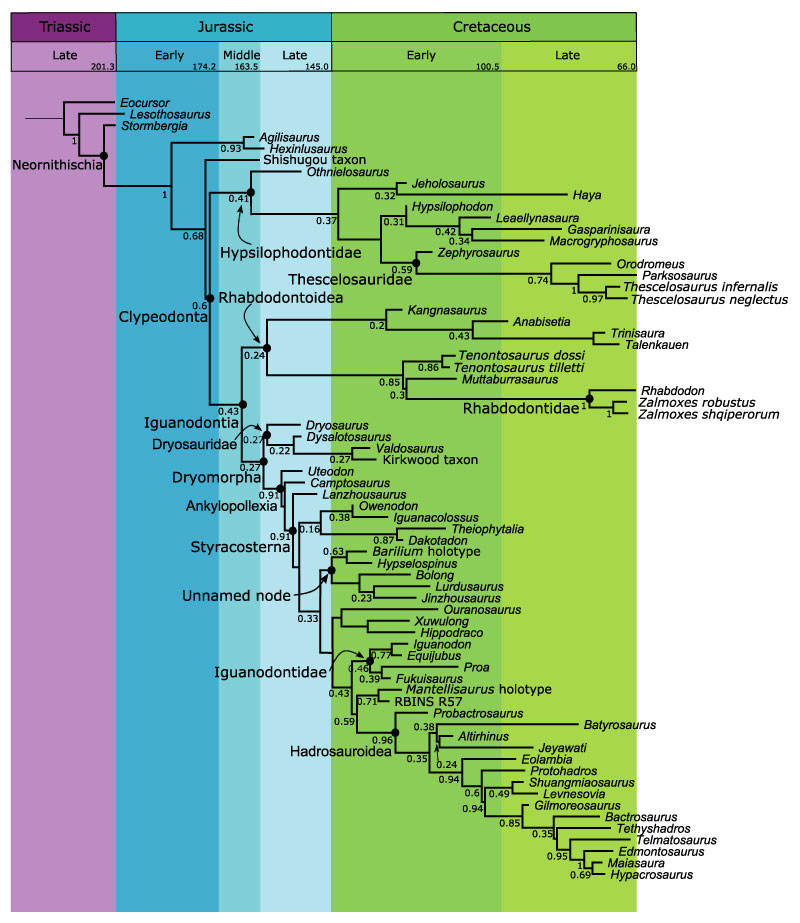
FIGURE 9. Ancestral Area Reconstruction on MCC tree from Bayesian analysis. Squares at tips show taxon ranges, pie charts at nodes show likelihoods of ancestral ranges. Key shows colors corresponding to modern continents; blended colors (e.g., the orange wedge in the node leading to Leaellynasaura and Gasparinisaura) indicate an ancestral range in both descendant ranges.
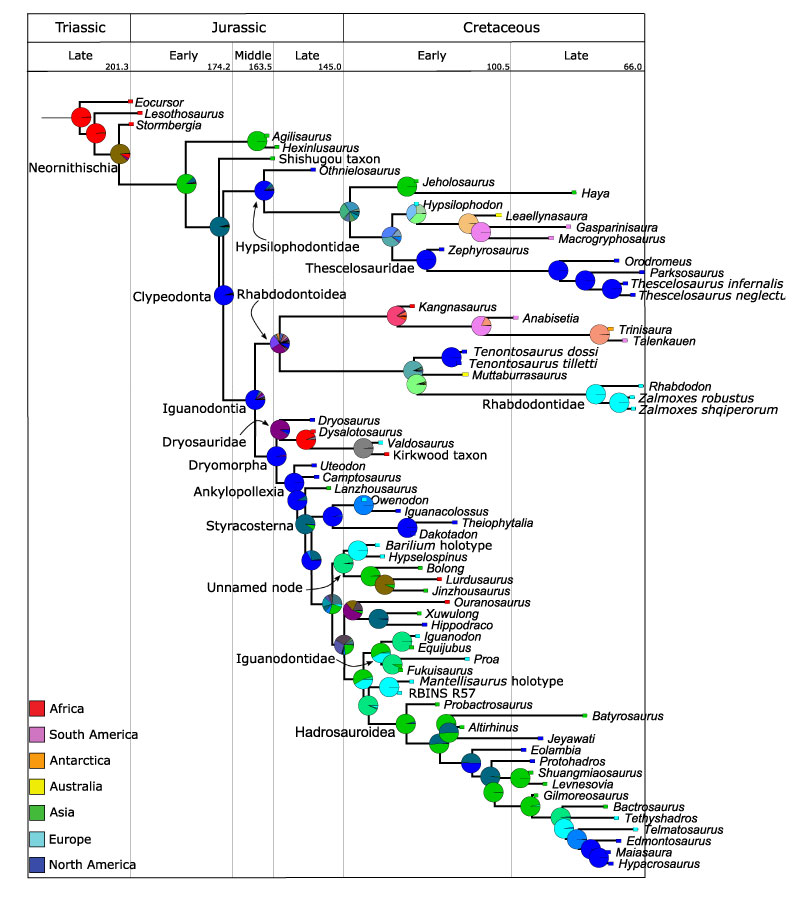
FIGURE 10. Strict consensus of 3,086 MPTs produced from a parsimony analysis excluding the 80 novel postcranial characters used in this analysis. Styracosterna is composed of a large polytomy, and smaller polytomies are found outside Rhabdodontoidea and Thescelosauridae.
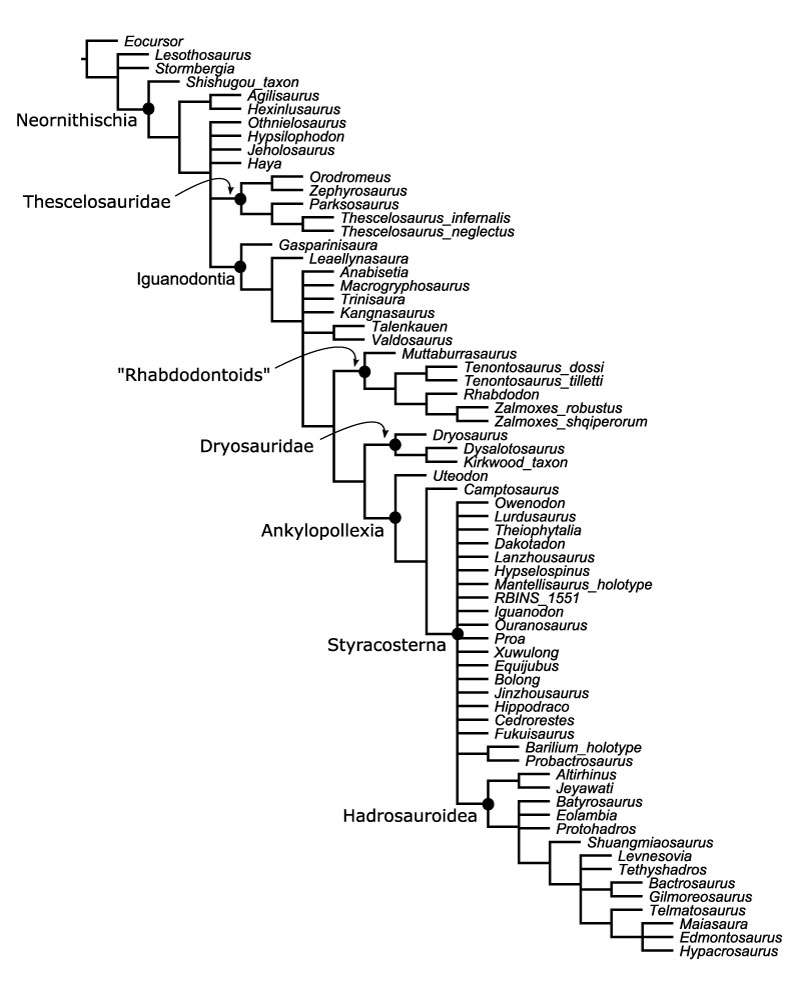
FIGURE 11. Silhouettes showing the radius, ulna and manus of A, Iguanodon (from RBINS 1534 and 1558) and B, Lurdusaurus (from MNHN.F.GDF 1700).
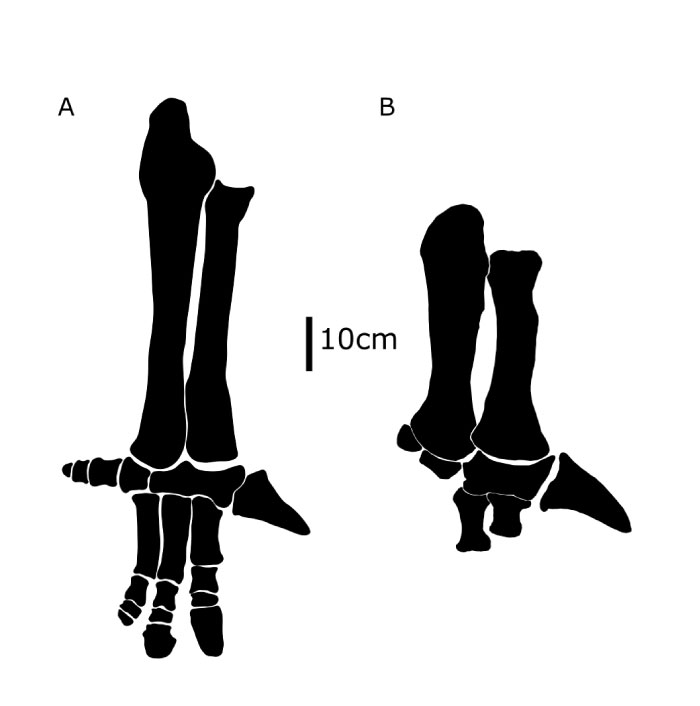
FIGURE 12. Sternals of A, Tenontosaurus (YPM 5456); B, the Kirkwood taxon (AM 6067); C, Macrogryphosaurus (MUCPv 321); D, Hypselospinus (NHMUK R1885). A and B are right sternals in ventrolateral view, C and D are coosified left and right sternals, C in caudodorsal view and D in cranioventral view, including the midline intersternal ossification. Abbreviations: cl, caudolateral process; cm, caudomedial process; iso, intersternal ossification. Scale bar equals 10 cm in A, C, and D, and 1 cm in B.
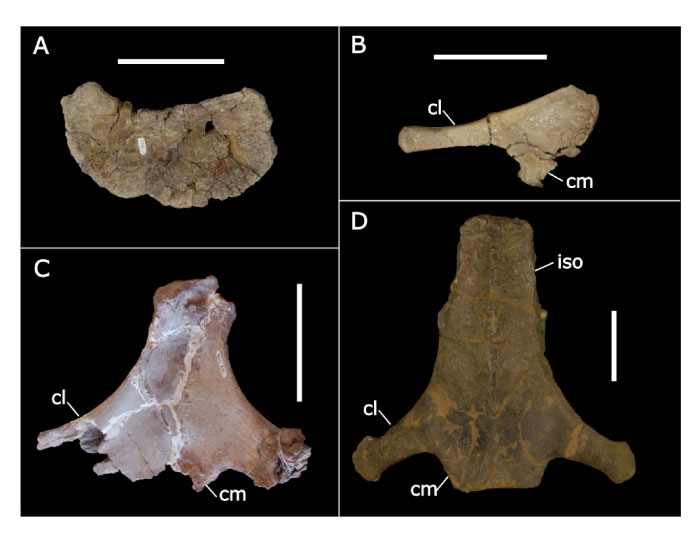
FIGURE 13. Dentary teeth in labial view of A, Thescelosaurus infernalis (SDSM 7210); B, Rhabdodon (MC.CY.QR1); C, Tenontosaurus tilletti (AMNH 3034); and D, Owenodon (NHMUK R2998). Abbreviations: c, cingulum; pr, primary ridge; sr, secondary ridge. Scale bars equal 5 mm.
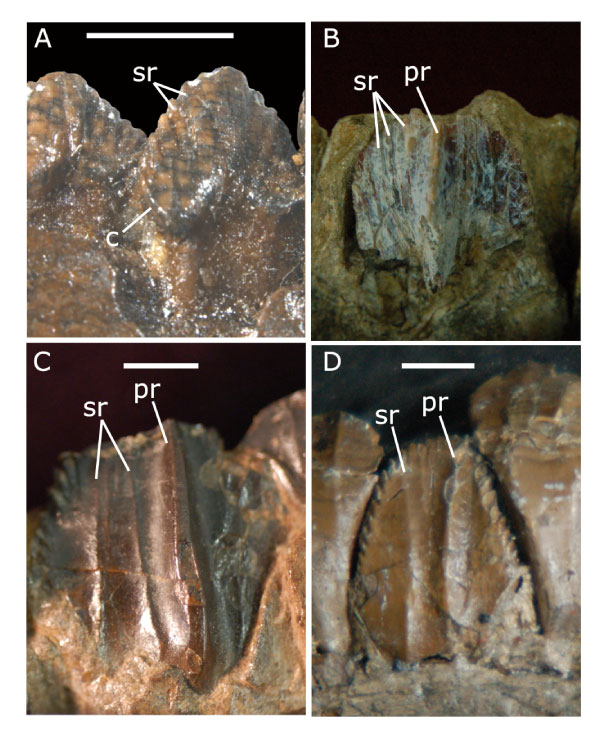
FIGURE 14. Time-calibrated Bayesian MCC tree, showing character state changes for osteological correlates of quadrupedality. Light red, femur longer than tibia; yellow, proximal ulnar flange present; green, tab-shaped fourth trochanter; blue, rounded manual unguals. Note that some posterior probabilities and labels for Ankylopollexia and Styracosterna have been removed for clarity; the groups are still indicated by closed circles at their respective nodes.