FIGURE 1. Linear measurements used for morphological comparison. B-L - buccolingual width; upper teeth - posterior-most tip of the metastyle to the lingual margin of the protocone; lower teeth - lingual-most tip of the metaconid to the buccal margin of the talonid. A-P - anteroposterior length; upper teeth - posterior-most tip of the metastyle to the anterior-most tip of the parastyle; lower teeth - anterior tip of the trigonid (paraconid) to the posterior end of the talonid (entostylid). TRI - width of the trigonid. TAL - width of the taloned basin. HL - total humerus length; proximal-most tip of greater tuberosity to distal-most point on capitulum. PW - width of the proximal end of the humerus: lateral most extent of the lesser tuberosity to the medial most aspect of the greater tuberosity. GT - length of the greater tuberosity. LT - length of the lesser tuberosity. DW - width of the distal end of the humerus: lateral most extent (entepicondylar process) to the medial most extent (ectepicondylar process). RL - total radius length: proximal-most tip of capitular process to distal-most tip of lunar articular facet. DL - length of the diaphysis. UF - length of the lunar articular facet. TUL - total ulna length; proximal-most tip of olecranon process to distal-most tip of terminal process. UL - ulna length without the olecranon fossa. Elements not to scale.
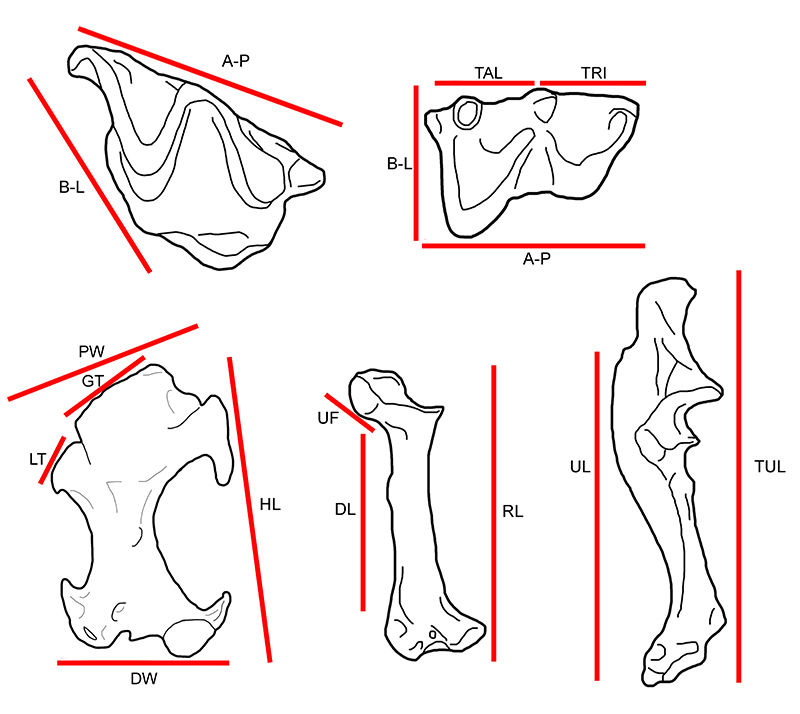
FIGURE 2. Number and position of humerus landmarks. Line drawing showing landmarks positions with labels on the anterior view of a left humerus of Condylura cristata (Star-nosed mole). Scale bar equals 1 mm.
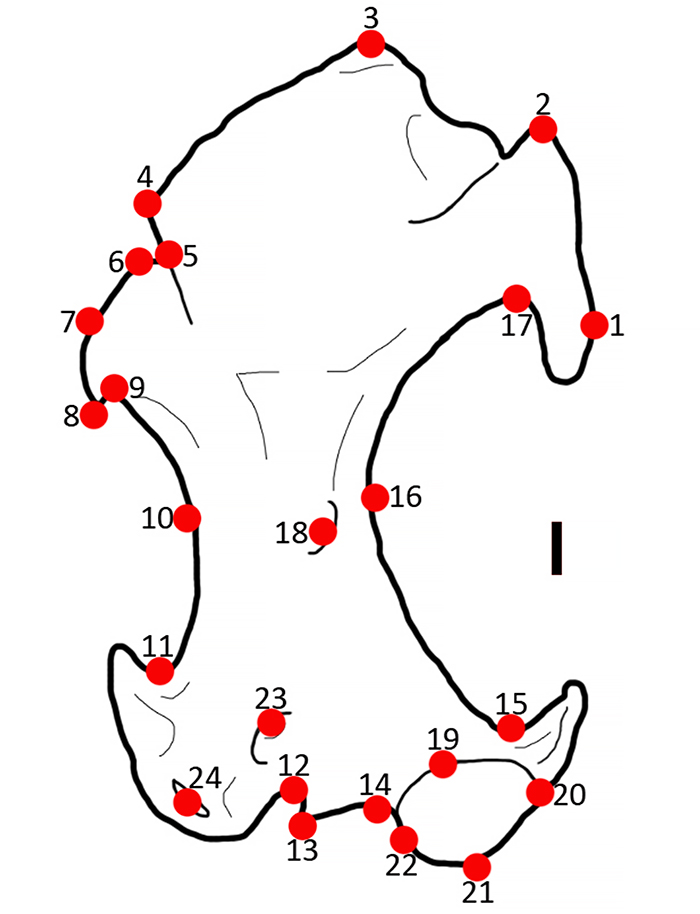
FIGURE 3. Magnatalpa fumamons gen. et sp. nov. dental material. ETMNH 9664, right m2 - A) occlusal, B) labial, and C) lingual views. ETMNH 20747, left M1 - D) occlusal view. ETMNH 20779, right M1 - E) occlusal, F) lingual, and G) labial views. ETMNH 21077, edentulous dentary - H) lingual, I) labial, and J) occlusal views. Scale bars equal 1 mm.
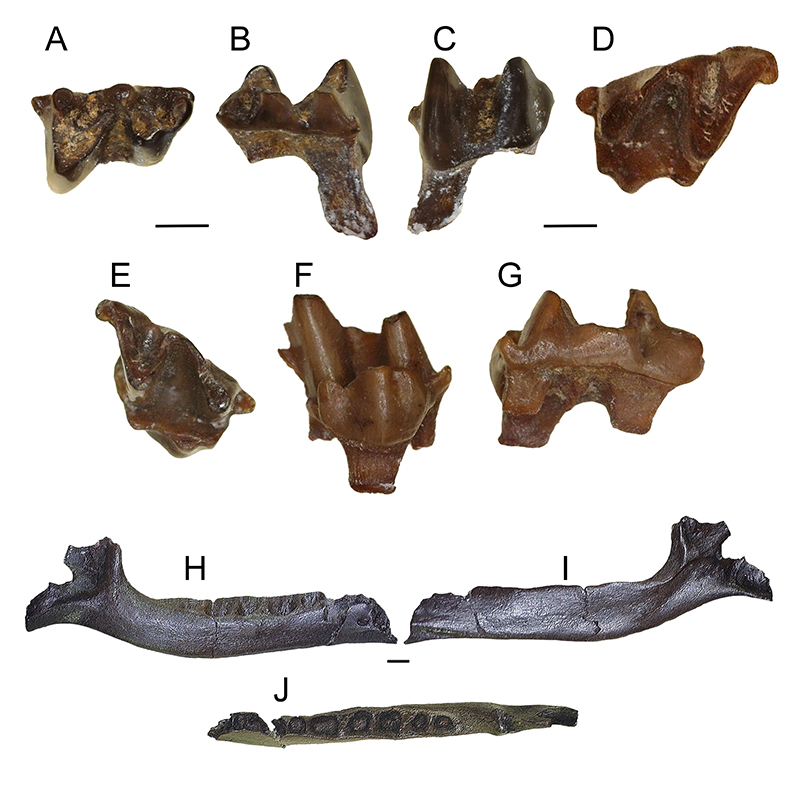
FIGURE 4. M1 (ETMNH 20779) super-positioned on top of m2 (ETMNH 6994). Scale bar equals 1 mm.
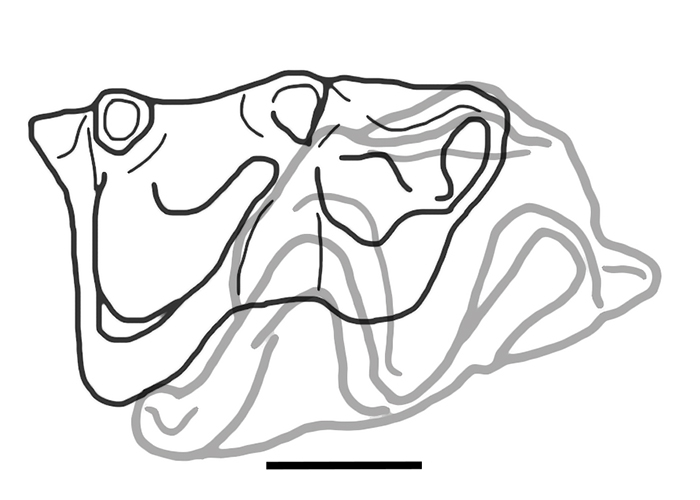
FIGURE 5. Parascalops grayensis sp. nov. material. ETMNH 6939, left humerus - A) posterior and B) anterior views. ETMNH 14849, right radius - C) medial view. ETMNH 20748, right ulna - D) medial, E) anterior, and F) lateral views.
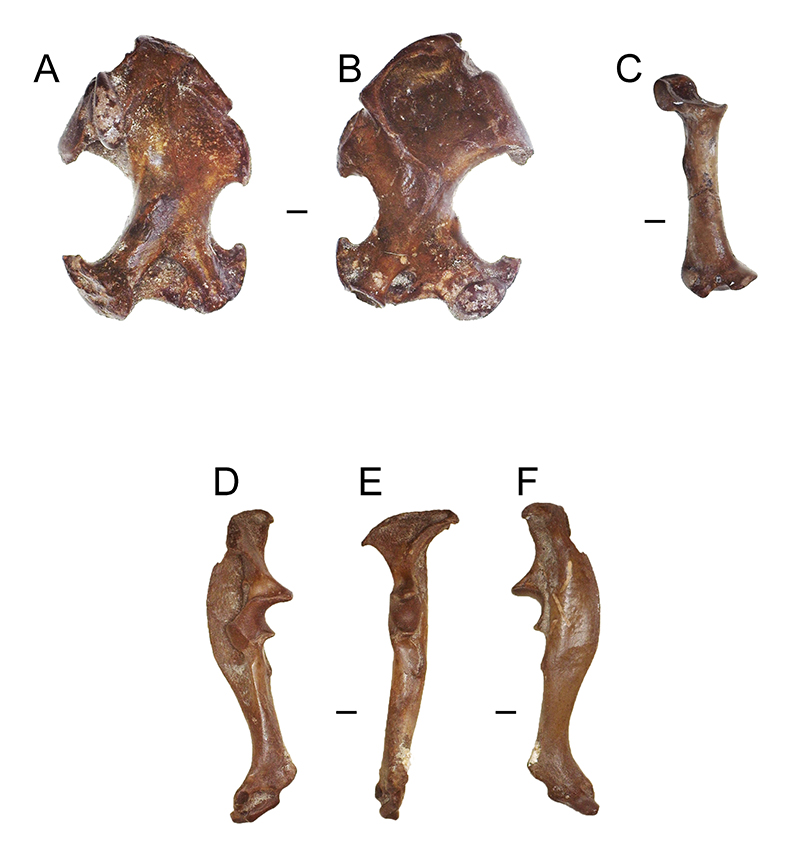
FIGURE 6. Parascalops grayensis sp. nov. material. ETMNH 20748, nearly complete disarticulated manus parts in dorsal view, A) articulated phalanges with claw cores (digits V - I), B) right trapezium, C) right capitate, D) right ulnar sesamoid, E) left scaphoid, F) left lunar, G) left triquetrum, H) left capitate, and I) left trapezium. ETMNH 24662, left M3 - J) occlusal view. Scale bars equal 1 mm.
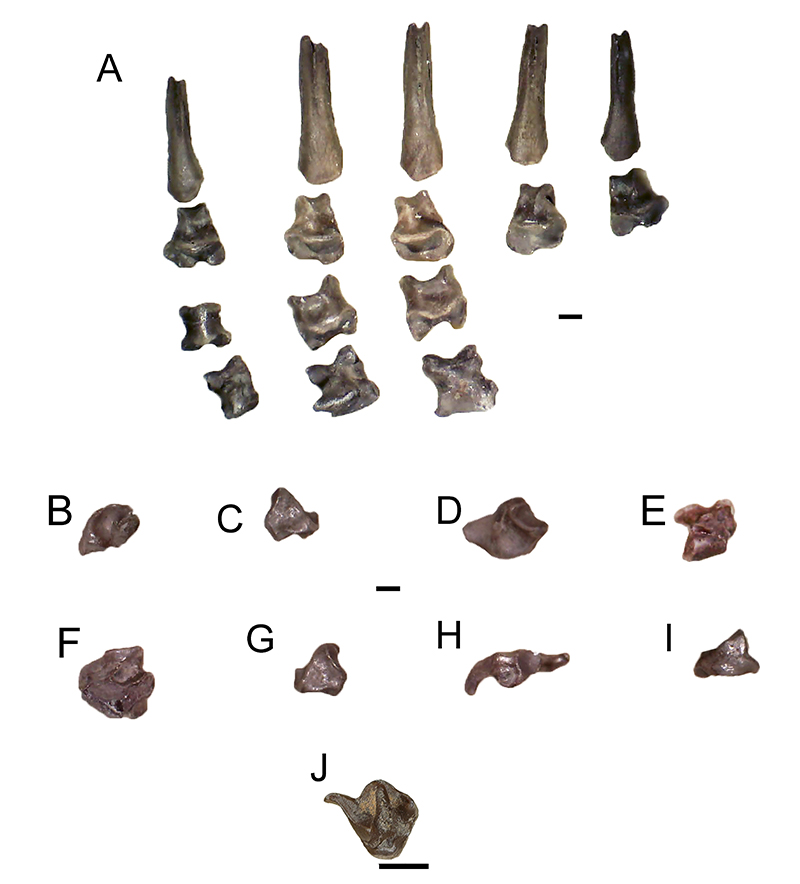
FIGURE 7. Mioscalops sp. skeletal material. ETMNH 6942, left humerus - A) posterior and B) anterior views. ETMNH 20738, right ulna - C) medial view. Scale bar equal 1 mm.
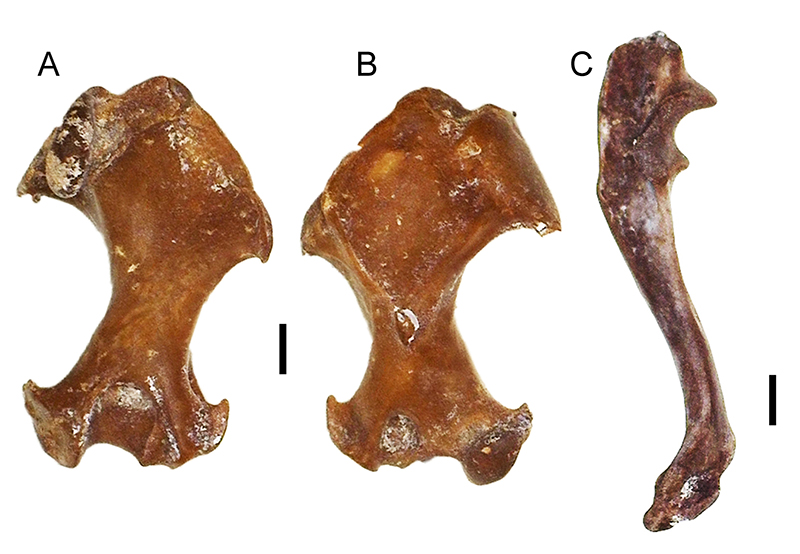
FIGURE 8. Neurotrichus sp. skeletal material ETMNH 20737, right dentary with m1-3 - A) lingual and B) occlusal views. ETMNH 4915, left humerus - C) posterior and D) anterior views. Scale bars equal 1 mm.
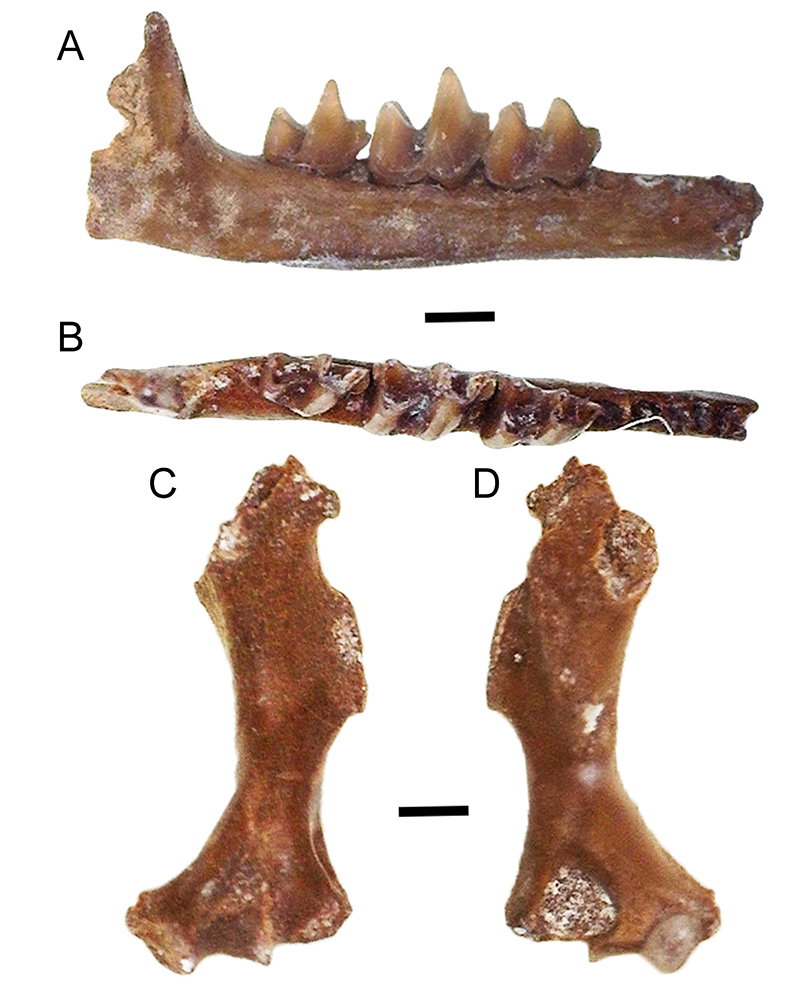
FIGURE 9. Relative warps analysis thin plate splines showing grid deformation in positive and negative directions to achieve change in humerus shape per relative warp. The consensus shape per relative warp is shown in the center.
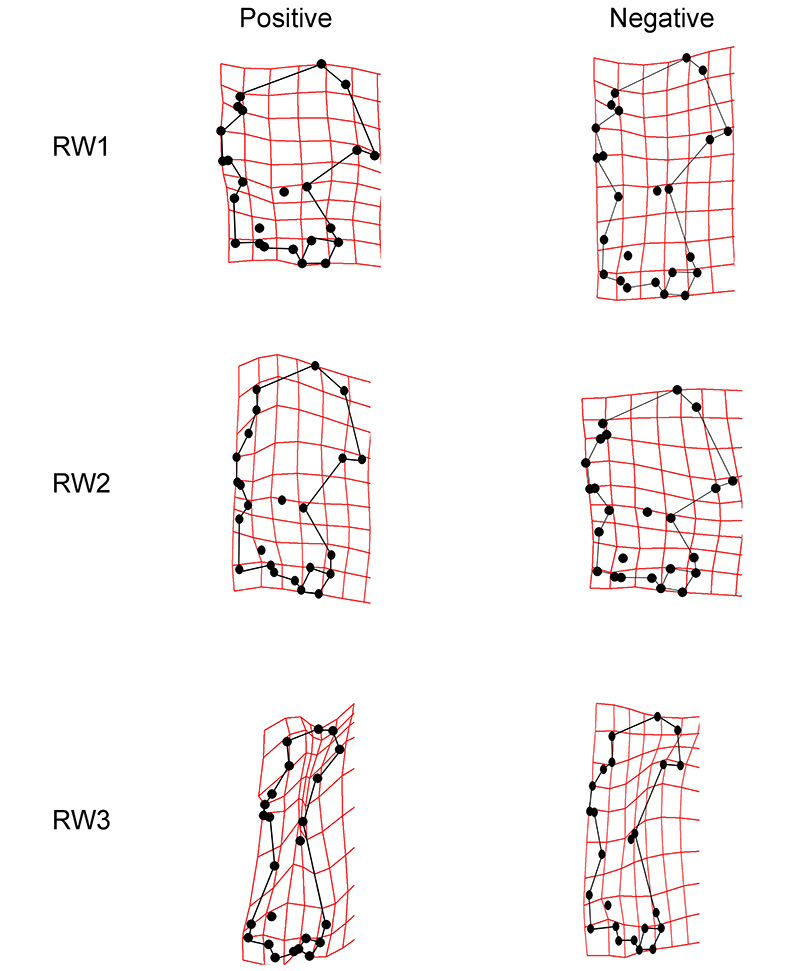
FIGURE 10. Plot of humerus shape based on canonical variates one (CV1) and two (CV2). Deformation grids show change in shape along each axis in positive and negative directions. Fossils taxa have a purple square in the center. GFS taxa are labeled.
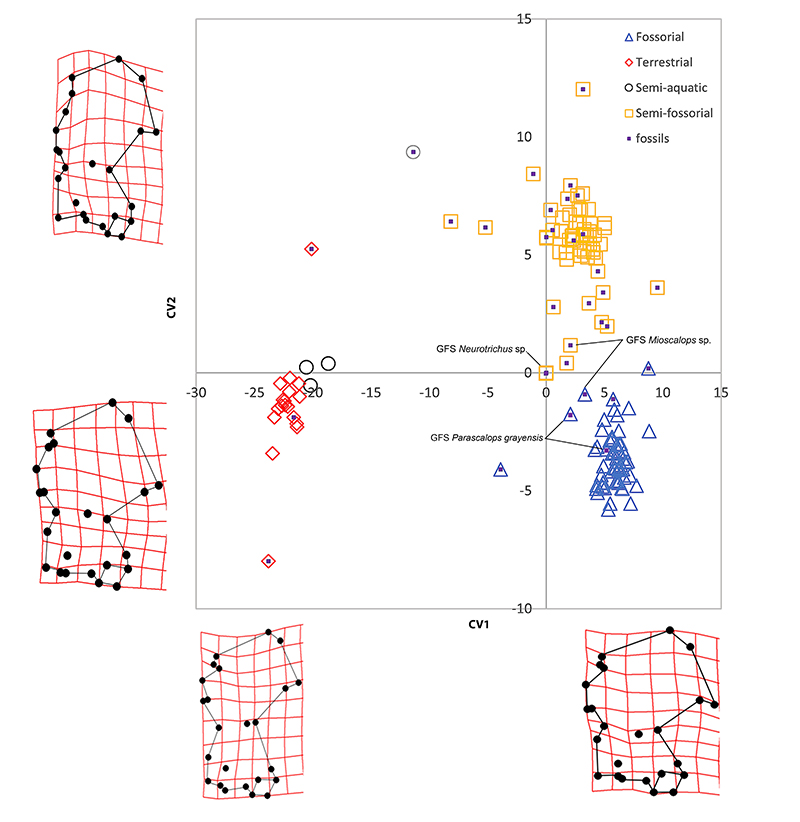
FIGURE 11. Plot of humerus shape based on canonical variates one (CV1) and three (CV3). Deformation grids show change in shape along each axis in positive and negative directions. Fossils taxa have a purple square in the center. GFS taxa are labeled.
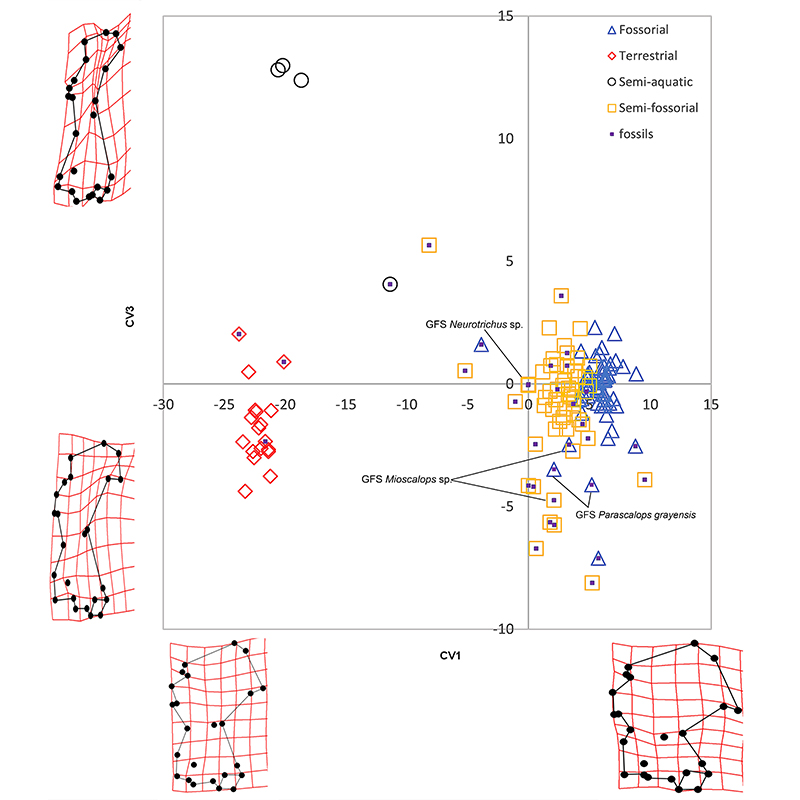
FIGURE 12. Individual taxon phenogram based on squared Euclidean distance. Fossil taxa are in blue. Gray Fossil Site taxa are in red.
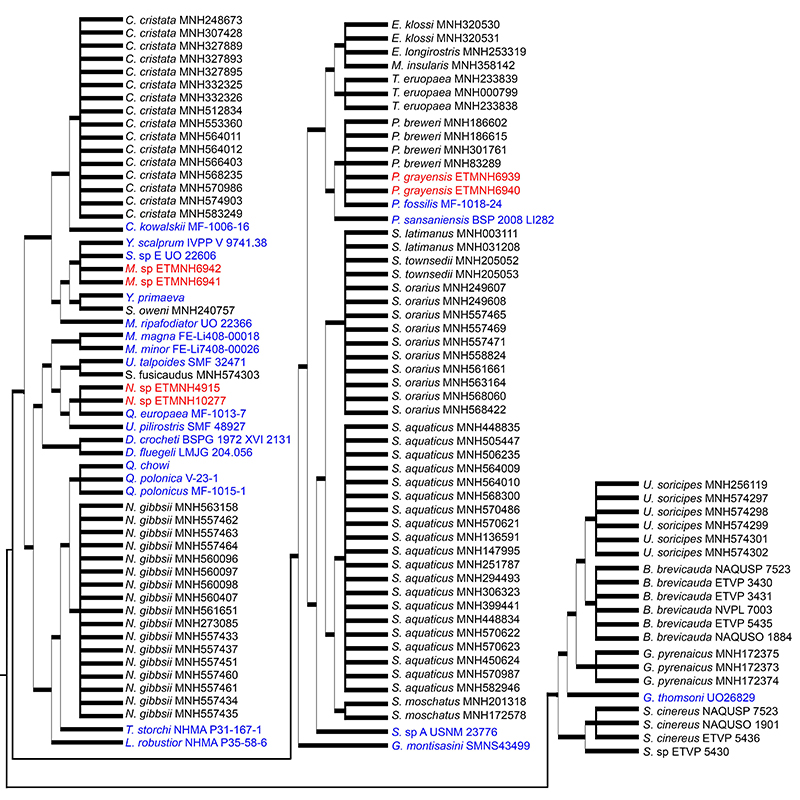
FIGURE 13. Average position phenogram. Major clusters color-coded to match He et al. (2016). GFS taxa in blue. * indicates fossil taxa.
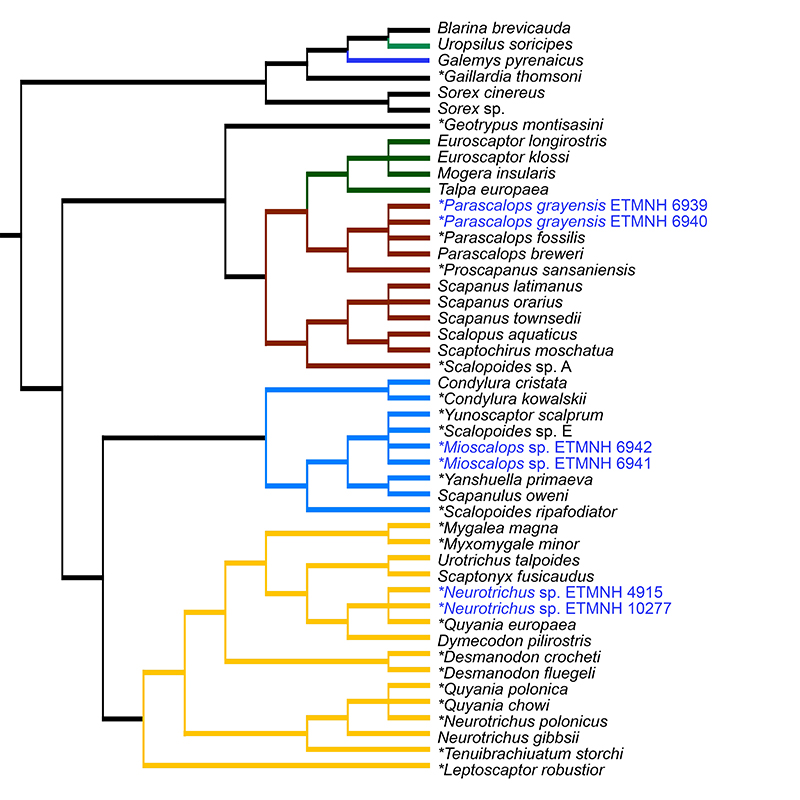
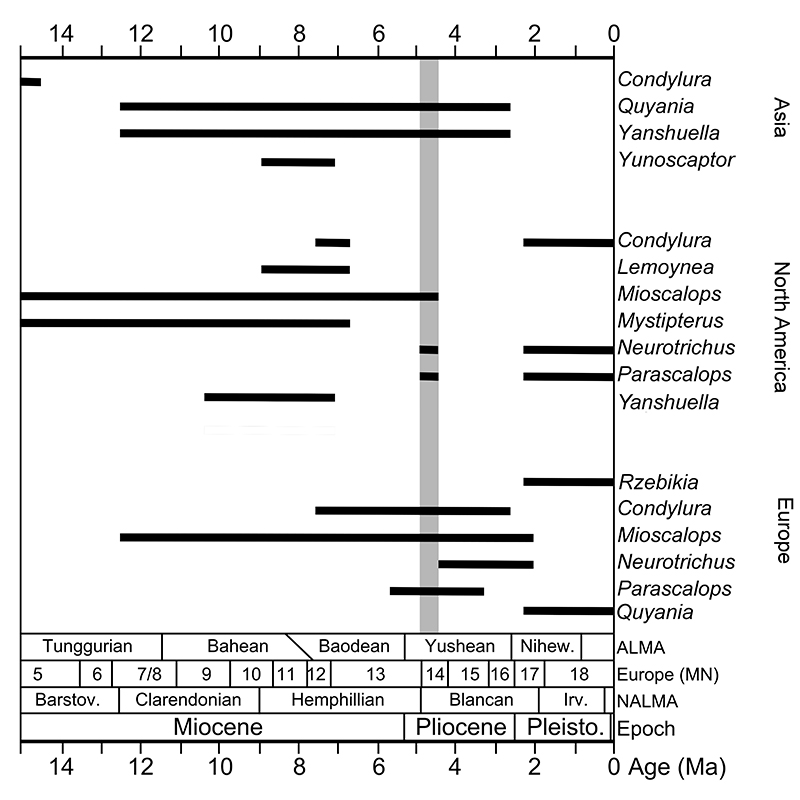
FIGURE 14. Biostratigraphic ranges of GFS taxa and morphologically similar talpids. Age of the Gray Fossil Site in gray. ALMA = Asian Land Mammal Ages, Europe MN = European Mammal Neogene zones, and NALMA = North American Land Mammal Ages.