FIGURE 1. Images from the original publication by Georg August Goldfuß (1831). Main slab (1A) and counter slab (1B) of the holotype of Scaphognathus crassirostris IGPB Goldfuß 1304a (main slab) and 1304b (counter slab). 1C, Skeletal reconstruction of Scaphognathus crassirostris, including palaeobiological life reconstruction of two Scaphognathus crassirostris specimens in their presumed marginal marine habitat. However, the skeletal reconstruction contains two major errors: firstly, four instead of three clawed fingers are to be seen on the hand, and secondly, the long tail characteristic of most non-pterodactyloid pterosaurs is missing.
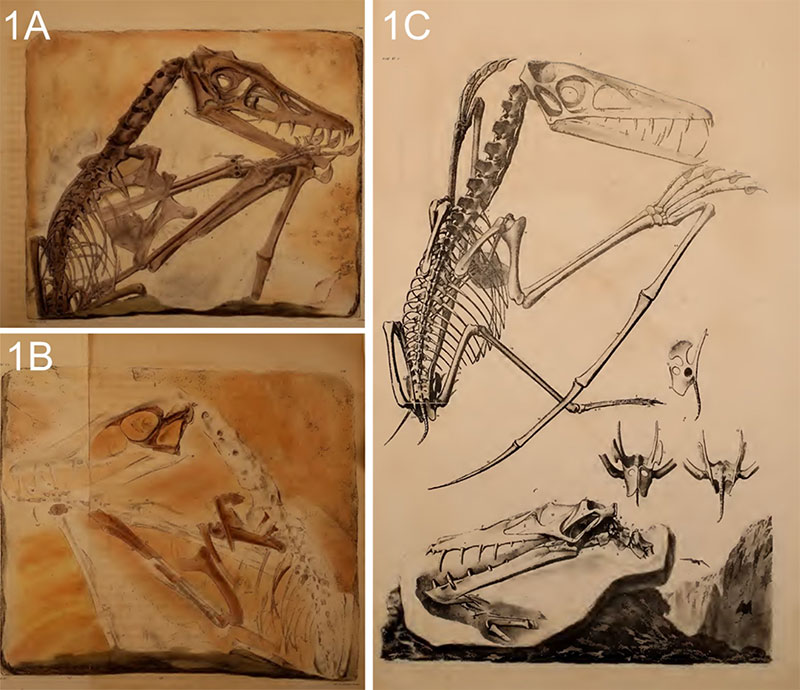
FIGURE 2. Main slab (2A) and counter slab (2B) of the Scaphognathus crassirostris holotype, IGPB Goldfuß 1304a and b. Black rectangles and triangles illustrate the four different body regions in which soft part preservation is present: dorsal to the dorsal vertebral column until the base of the cervical vertebral column (1), ventral to the zeugopodial bones and next to the first and second phalanx of the fourth wing finger of the right wing (2), ventral to the cervical vertebral column (3), and the region enclosed by the zeugopodial and stylopodial bones of both wings (4). Images adapted from Jäger et al. (2018).
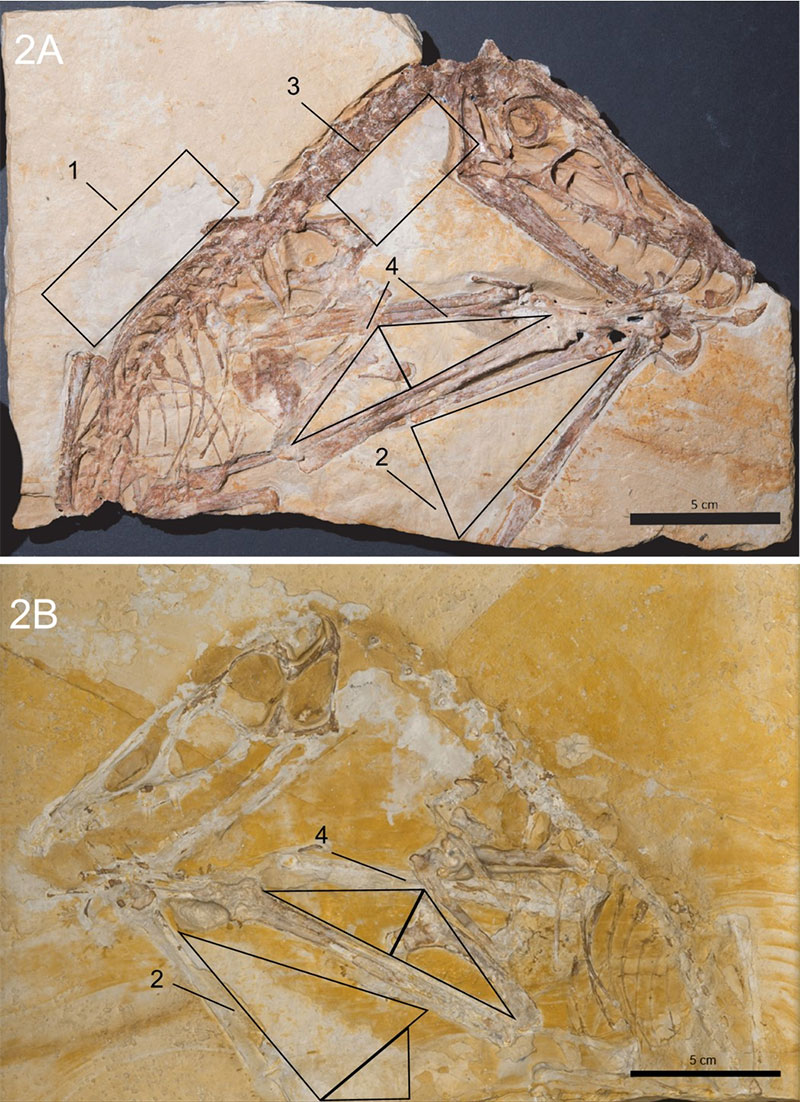
FIGURE 3. Close-ups of two different regions on the main slab demonstrating the optical difference between unprepared regions associated with soft parts (green arrow) and the surfaces prepared by Goldfuß (red arrow), without being processed with the specular enhancement mode. 3A. The sharp border between the unprepared ochre- and beige-coloured limestone surface and the homogenous, striated surface directly ventral to the above-mentioned bones, which underwent preparation. 3B. The striations created by Goldfuß are more clearly discernible dorsal to the cervical vertebral column (red arrow). Scale bar in both illustrations equals 10 mm.
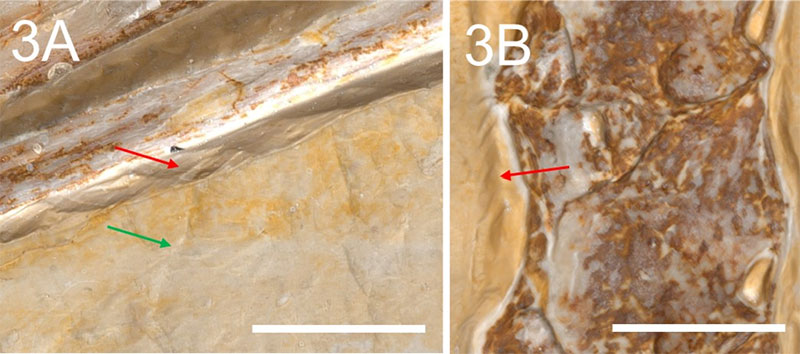
FIGURE 4. Close-up RTIViewer snapshots of the region dorsal to the dorsal vertebral column on the main slab, taken under different lighting conditions but all processed using the specular enhancement mode (except for Figure 4A). Scale bar for all illustrations equals 10 mm.
Comment on the settings in the RTIViewer software as visualised in the figures.
A green sphere symbolises the direction of the incident light (upper right corner), a text box in the upper image margin contains the respective x- and y-coordinates of the incident light direction (the first value contains the x-coordinate, while the second one contains the y-coordinate), the zoom factor is given in brackets. A second text box contains the individual values of the specular enhancement mode (lower left corner). The first value stands for the parameter “specularity”, the second one indicates the parameter “highlight size”. The line drawings were sometimes made based on several RTI images with different settings to illustrate an individual impression more clearly. As far as the figures themselves are concerned, the interpretative drawings have tried to come as close as possible to the appearance and arrangement of the structures observed in the RTIViewer. However, some drawings, such as Figure 4B, represent rather idealised illustrations of the general pattern and arrangement of individual pycnofibre impressions in a given area. For this reason, the interpretative drawings may differ in detail from the respective RTI images to which they refer. In all figures, the orientation of the pycnofibres is marked by red arrows; the whitish semicircular indent, the starting point of most of the pycnofibres in the caudal region of the dorsal vertebrae, is symbolised by a red arc throughout Figure 4 and 5, the single occurrence of Type 2 pycnofibres is circled in red in the aforementioned figures.
4A. Overview of the pycnofibre impressions in the area dorsal to the dorsal vertebral column associated with the whitish amorphous rock surface under normal light. 4B. Interpretative drawing of Figure 4A (dorsal ribs in the lower right corner of the image) under normal light, idealised to give an overview of the spatial orientation of the pycnofibre impressions and therefore not reflecting the exact path of individual impressions. Thicker lines indicate better observable impressions. 4C. The same area as in 4A, seen under the specular enhancement mode. 4D. Pycnofibres of the caudalmost part of the area dorsal to the dorsal vertebral column (lower right corner). Note the pycnofibres showing a distinctive cross-over (red circle in 4D and 4E), representing Type 2. 4E. The same area as in 4D under other lighting conditions to highlight the overlapping impressions.
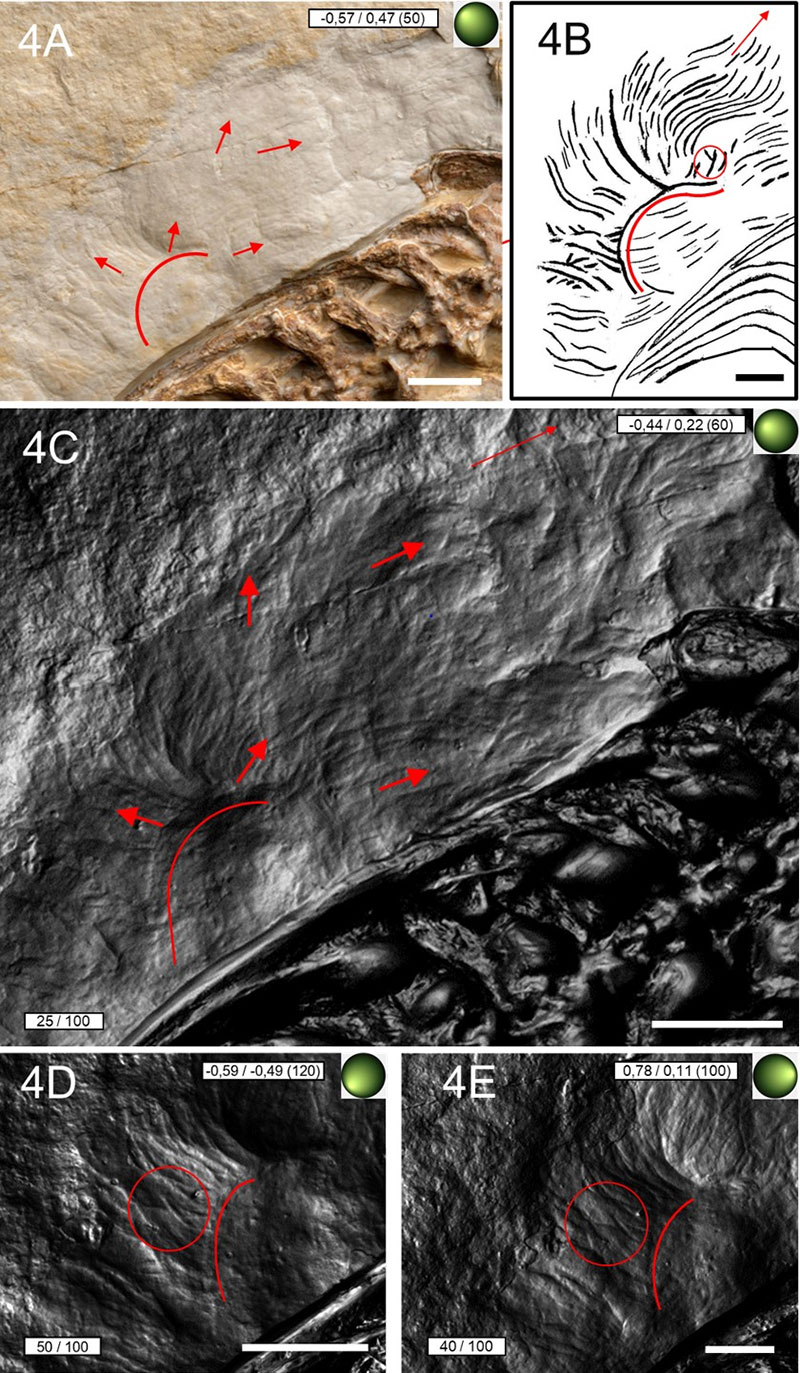
FIGURE 5. Close-up RTIViewer snapshots of the region dorsal to the dorsal vertebral column on the main slab, taken under different lighting conditions, but all processed using the specular enhancement mode (except for Figure 5D). Scale bar for all illustrations equals 10 mm. 5A-5B. Caudal region dorsal to the dorsal vertebral column (lower right corner of both images) and next to the semi-circular indent, illustrated under different lighting conditions. 5C. Sketch of Figure 5A and 5B showing the appearance and the orientation of the pycnofibres under normal light. 5D-5E. Pycnofibres dorsal to the first anterior dorsal vertebrae (lower right corner), showing a striking pycnofibre accumulation under normal light (5D) as well as under the specular enhancement mode (5E). Note the spreading of pycnofibres in a radially symmetrical pattern from an arc-like starting point (red arrows, starting point marked by a red arc in 5E-5F). Also, note the branching in the dorsalmost part of the whitish limestone surface (orange circle in 5D-5F). 5F. Interpretative drawing of 5D and 5E, illustrating the arrangement of the pycnofibre impressions under normal light.
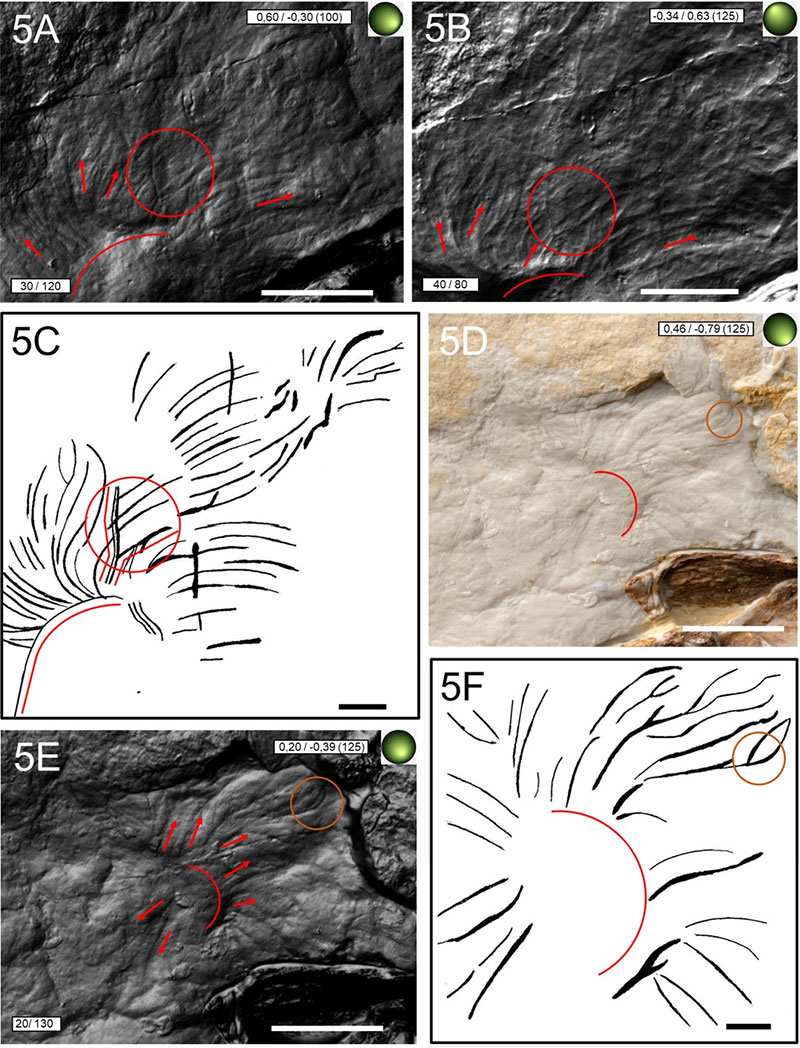
FIGURE 6. Close-ups of RTIViewer snapshots of the region ventral to the zeugopodial bones of the right wing on the main slab, taken under different lighting conditions, but all processed using the specular enhancement mode (except for 6A and 6H). Scale bar for all illustrations equals 10 mm, except for 6G and 6H (one millimetre). Markings for various pycnofibre types used throughout this Figure: Type 2 (bifurcated; yellow circle), Type 3 (trident-like; orange circle), Type 5 (tuft, red circle), and Type 6 (symmetrical “feather”, green circle). The path of individual pycnofibre impressions, and the path of individual side branches of single impressions are illustrated by red markings (either by straight lines or by curved arcs as in 6D, 6E, and 6H). 6A, 6C. Overview of the area with the pycnofibres ventral to the zeugopodial bones of the right wing (upper left corner of both images) and the phalanges of the right wing finger (near the right image margin) under normal light (6A) as well as under the specular enhancement mode (6C). 6B. Schematic sketch of Figure 6C, showing the appearance of the pycnofibre impressions under normal light. 6D-6E. Close-ups of 6C. Note the parallel to subparallel alignment of several pycnofibre impressions (red vertical lines in 6D and 6E) and the easily detected caudally curved side branches of the Type 4 pycnofibre (red rectangle in 6F). The complex structure with several putative side branches at the right image margin between Type 2 and 3 pycnofibres (red arrow) is more likely to represent an arrangement of overlapping impressions of individual pycnofibres. 6F. Sketch of the RTI images 6D and 6E. 6G. Detailed close-up of the Type 2 pycnofibre, outlined by red markings. 6H. Detailed close-up of the Type 5 pycnofibre. The longest branch in the middle has a distinctive bifurcation (red circle).
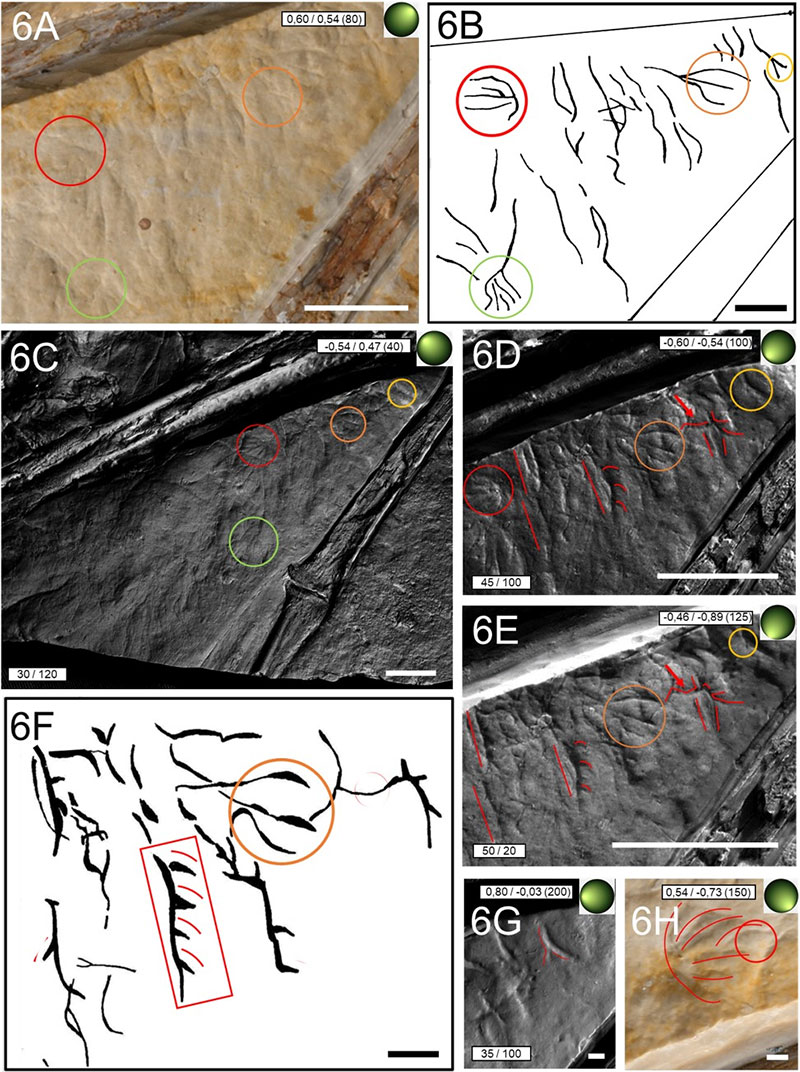
FIGURE 7. Close-ups of RTIViewer snapshots of the region ventral to the zeugopodial bones of the right wing on the main slab, taken under different lighting conditions, but all processed using the specular enhancement mode (except for 7D and 7G). Scale bar for all illustrations equals 10 mm, except for Figure 7A (1 mm). Markings for various pycnofibre types used throughout this figure: red circle illustrating Type 5 (the tuft); red arrows highlighting the main branch and several side branches of Type 6 (feather-like) as well as the individual path of single pycnofibre impressions at the lower margin of the main slab (Fig. 7C). For better comparability, the outermost (longest) side branches of the “feather” are highlighted by red markings (inclusive all terminal bifurcations). 7A. Type 5 pycnofibre. Some impressions suggest a connection between the Type 5 and 6 pycnofibres, but are not consistent in their appearance. 7B. Schematic drawing of Figure 7A, showing possible connections between the tuft and neighbouring grooves (see red arrows, although not entirely confirmable by the RTI images). 7C. The accumulation of Type 1 pycnofibres at the edge of the main slab near the articulation of the first with the second phalanx of the right wing finger (towards the lower right corner). Red arrows indicate the opposing directions of the impressions. Note in the upper right image corner the sixth pycnofibre type of Figure 7D-7I (green circle). 7D. Type 6 pycnofibre, dorsal to the articulation of the first with the second phalanx of the right wing finger (lower right image corner). Some side branches bear even smaller ones (red parabola-like upside-down markings in Figure 7D, 7E and 7H). 7E. Specular enhancement image of the sixth type. 7F. Interpretative sketch of 7E, highlighting the similarity with a feather as Goldfuß (1831) previously pointed out. The extent, length and number of several side branches are difficult to determine. Therefore, the drawing may differ in some details from the structure visible in the RTI images. 7G-7H. The feather-like pycnofibre impression from a greater distance under normal light (7G) and processed by using the specular enhancement mode (7H). 7I. Sketch of Figure 7G and 7H, suggesting no real connection between the Type 5 (tuft) and Type 6 (feather) pycnofibres.
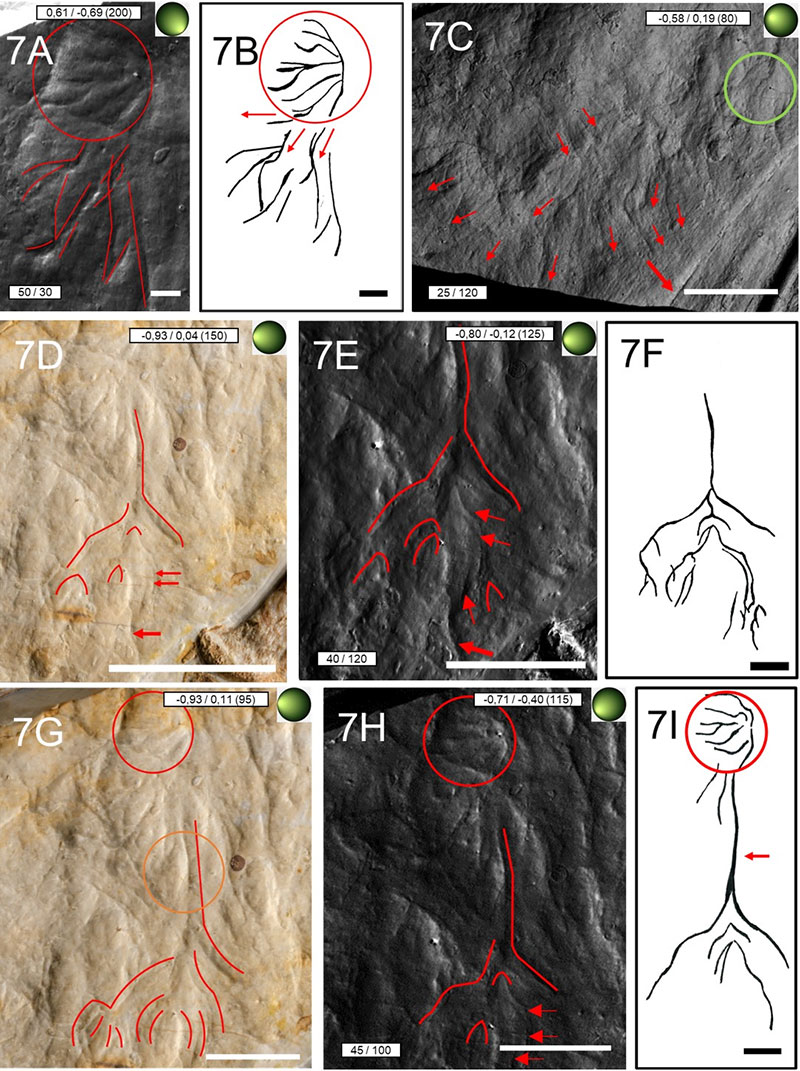
FIGURE 8. Close-up RTIViewer snapshots of the region ventral to the zeugopodial bones of the right wing on the counter slab, taken under different lighting conditions, but all processed using the specular enhancement mode (except for 8A). Scale bar for all illustrations equals 10 mm, except for 8E (1 mm). Markings for various pycnofibre types used throughout this Figure: the location of aktinofibrils impressions is marked by a red rectangle, the direction in which pycnofibre impressions point is highlighted by red arrows, the Type 2 pycnofibre is illustrated by a red circle. 8A. The whitish amorphous rock surface with pycnofibres between the zeugopodial bones of the right wing (upper right corner) and the first two phalanges of the right wing finger (lower left corner). Note first type pycnofibre impressions (red lines). The locality of overlapping impressions is marked by an orange circle in 8A and 8B (although not well visible in the image). 8B. Idealised sketch of Figure 8A after comparing several RTI images with each other to better visualise the trend of the decreasing abundance of crossing/ overlapping pycnofibres. Note that a trend of opposing impression directions seems to exist in this area of the counter slab (see the two red arrows). 8C. Specular enhancement image depicting the lower image part of 8A encompassing a wider field of vision. Aktinofibrils-like impressions heading for the lower right edge of the image (red arrows within the orange rectangle). 8D. Sketch of 8C. 8E. Enlarged close-up of the Type 2 pycnofibre. A much smaller terminal bifurcation is indicated (red arrow), suggesting that it might even be another type of bifurcated pycnofibre. 8F. Sketch of 8E, illustrating the smaller terminal bifurcation (yellow circle). 8G, 8I. The inconsistent appearance of the pycnofibres directly ventral to the articulation of the metacarpal bones with the phalanges of the right wing finger, taking on interesting shapes depending on the direction of incident light (red oval in 8G and also indicated in 8H). At some places, the pycnofibre impressions cross each other at specific angles (marked by two red angles in 8G and 8I). 8H. Sketch of 8G to highlight the oval shape of an accumulation of impressions.
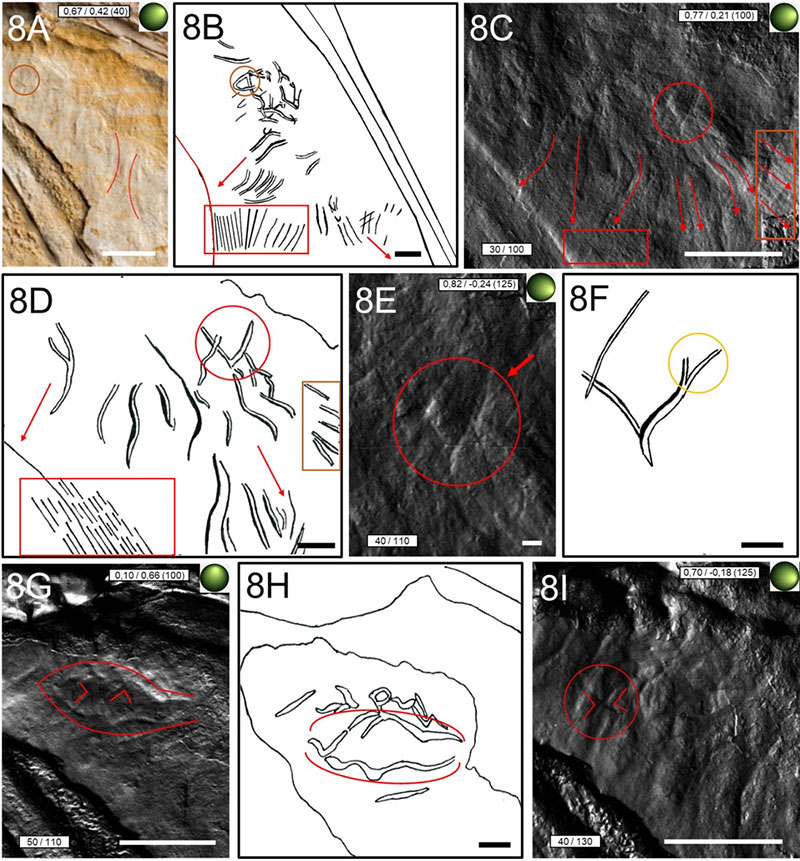
FIGURE 9. Close-ups of RTIViewer snapshots of the region ventral to the cervical vertebral column and at the articulation of the first with the second phalanx of the right wing finger on the main slab, processed without (9A and 9D) and with the specular enhancement mode (9B and 9E). Scale bar for all illustrations equals 10 mm. Markings for various pycnofibre types used throughout this Figure: The Type 2 (bifurcated) pycnofibre type is marked by a red rectangle, orange-brown sediment surfaces on which the aktinofibrils impressions are to be found are illustrated by a red rectangle and a red ellipse. The suggested border of the partly preserved wing membrane after Jäger et al. (2018) is also marked (red transversal line). 9A. The whitish amorphous rock surface ventral to the cervical vertebral column. 9B. Specular enhancement image of 9A. Frequent occurrence of pycnofibres marked by a red triangle. The pycnofibre accumulation within the red circle might represent closely spaced neighbouring bifurcated Type 2 pycnofibres (pointed out by a red arrow). 9C. Interpretative drawing of 9B. 9D. Aktinofibril impressions close to the articulation of the first with the second phalanx of the right wing finger, especially well preserved within two orange-brown sediment surfaces. Also note the presence of aktinofibrils on the surface of the phalanges, visible in 9D as well as in 9E (recognisable by a grooved bony surface). 9E. Specular enhancement image of 9D. Aktinofibrils beyond the patagium border (and therefore laying on the bone surface of the phalanges) indicate their taphonomical displacement. 9F. Interpretative drawing of 9E demonstrating the spatial arrangement of the aktinofibril impressions. Not shown are the aktinofibrils on the bone surface.
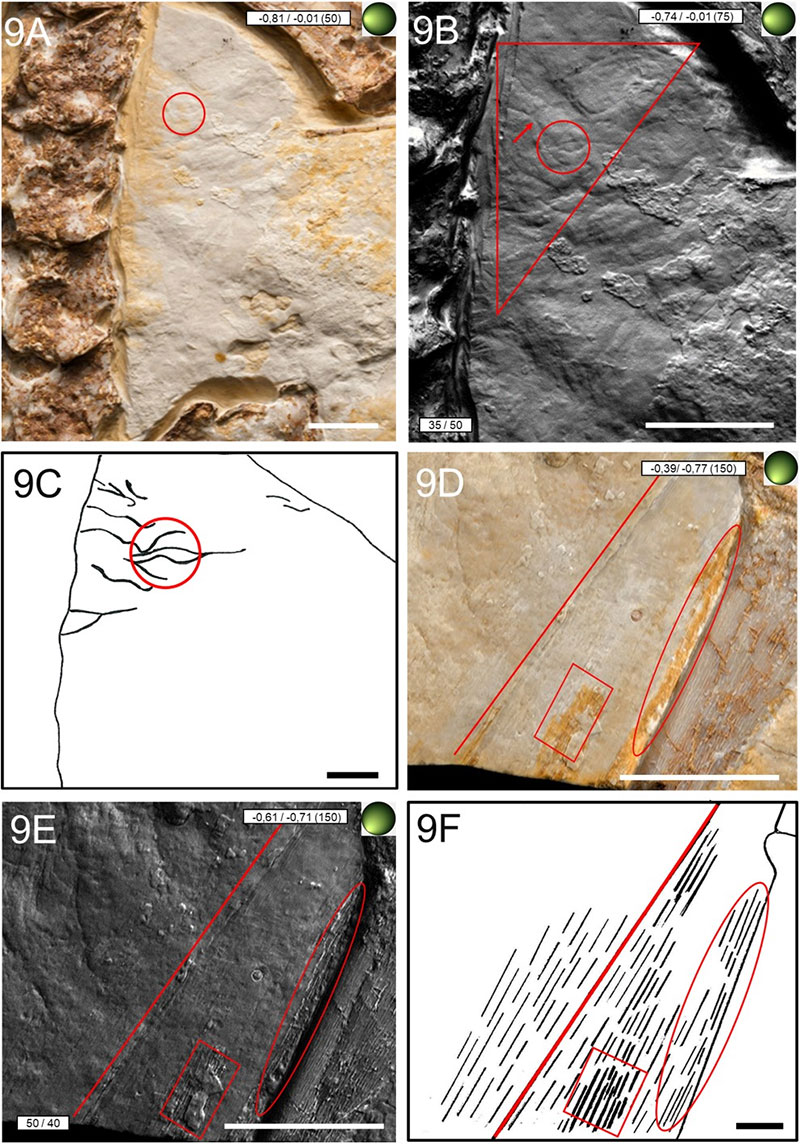
FIGURE 10. Close-up RTIViewer snapshots of the region enclosed by the articulation of the humerus with the zeugopodial bones of the right wing and the intersection point of the zeugopodial bones of both wings on the main slab, taken under different lighting conditions, but all processed using the specular enhancement mode (with the exception of 10A and 10B). Scale bar for all illustrations equals 10 mm. Markings for various soft part impressions used throughout this Figure: the longest soft part impression connecting the zeugopodial bones of the right wing with the humerus of the same wing is marked by a thick transversal red line, the other shorter ones running parallel to subparallel to each other by thin red lines, channel-like grooves on the bone surface are pointed out by a red rectangle. Dissolved limestone layer surfaces are pointed out by red rectangles. 10A. Overview over the area with the organic remains between the zeugopodial bones of both wings. The location of the most pronounced grooves is highlighted (yellow rectangle) as well as the blood vessels (orange rectangle). Image modified from the.rti file of Jäger et al. (2018). 10B. The impressions in this area do not share a common starting point. Note the parallel to subparallel arrangement of the shorter soft part impressions. Also, pay attention to the channel-like grooves on the bone surface and the whitish irregularly-shaped stains of the sediment layer between the zeugopodial bones, probably being the result of aqueous solutions, which might have occurred during fossilisation, and which might have dissolved the former uppermost sedimentary layer. Although speculative, such solutions might have been derived from escaping body fluids in the context of the taphonomy of the integumentary appendages (see Foth, 2012 for a detailed discussion). 10C-10D. Specular enhancement images of 10B, taken under different lighting conditions to highlight the parallel arrangement of the soft part-related impressions and the channel-like grooves on the bones. Note the oblong channel connecting individual shorter ones (thick green arrow) and especially the zigzag pattern of some shorter channels (brown ellipse in both figures). 10E. Interpretative drawing of Figure 10C and 10D. 10F. The blood vessels near the intersection point of the zeugopodial bones of both wings. The subparallel alignment of the vessels (red slightly curved lines in Figure 10F) might indicate a similarity with the blood vessel system in the Rhamphorhynchus specimen JME SOS 4784 (Tischlinger and Frey, 2002; Frey et al., 2003). Note the distinct bifurcation of the rightmost vessel (red circle). Image modified from the.rti file of Jäger et al. (2018). 10G. Detailed close-up of Figure 10F. Small pits (red circles) might be the result of degradation processes in the context of the decay of the pterosaur carcass, although the exact generic process is uncertain.
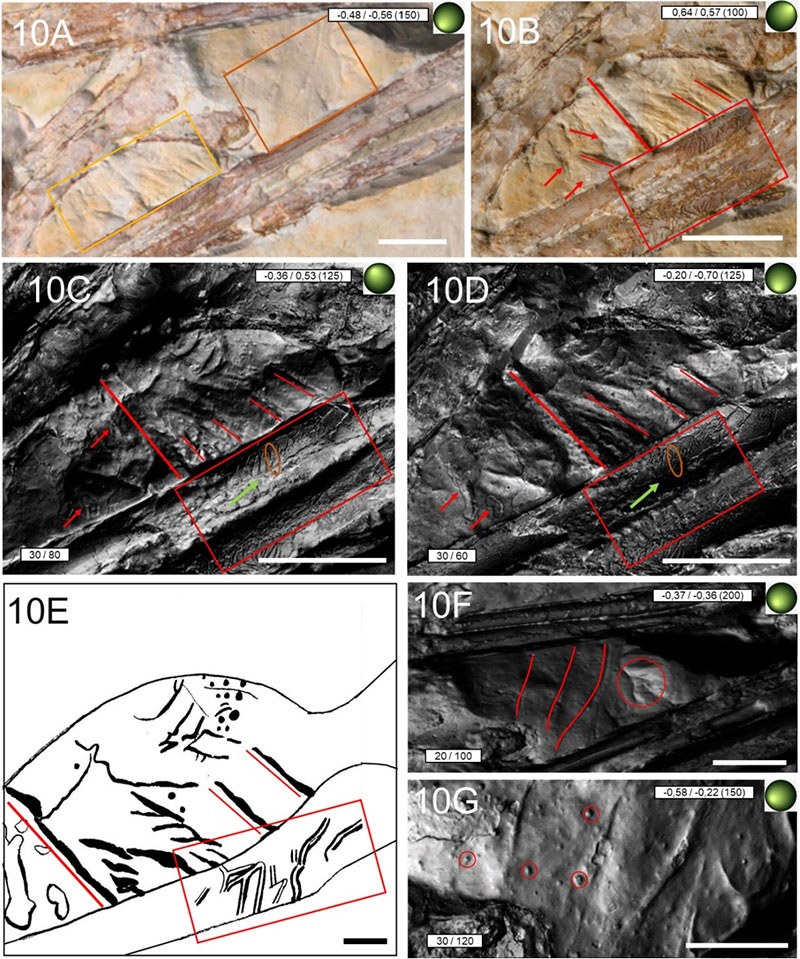
FIGURE 11. Close-up RTIViewer snapshots of the region enclosed by the articulation of the humerus with the zeugopodial bones of the right wing and the deltopectoral crest of the humerus on the counter slab, taken under different lighting conditions, but all processed using the specular enhancement mode (except 11A and 11E). Scale bar for all illustrations equals 10 mm. Markings for various soft part impressions used throughout this Figure: red lines illustrate the path of the impressions and their orientation to each other and a red ellipse marks the longest blood vessel. 11A. The geometrically organised soft parts ventral to the deltopectoral crest of the humerus (uppermost left corner) and the zeugopodial bones of the right wing (lower margin). Note the distinct crossing of the two thick main branches (red circle in 11A and 11B). The arrangement of these impressions of a soft tissue type that cannot be determined with absolute certainty, but very probably once belonging to the Patagium reminds of the arrangement of the main vessels in the complex vessel system in the Rhamphorhynchus specimen JME SOS 4784 (Tischlinger and Frey, 2002; Frey et al., 2003). In this specimen, a large main vessel serves as an attachment point for side channels branching off from it at more or less right angles. 11B. Interpretative drawing of 11A. 11C-11D. Specular enhancement images of Figure 11A under different lighting conditions. The soft part impressions likely representing former patagium vessels appear either as elevations (11C) or as grooves (11D). The parallel arrangement of some side branches is confirmed under all lighting conditions, suggesting its interpretation as part of the patagium. 11E. The longest, unbranched and strongly bifurcated blood vessel (red circle in 11E). 11F-11G. The appearance of the pit-like depressions already shown in Figure 10 associated with the blood vessels.
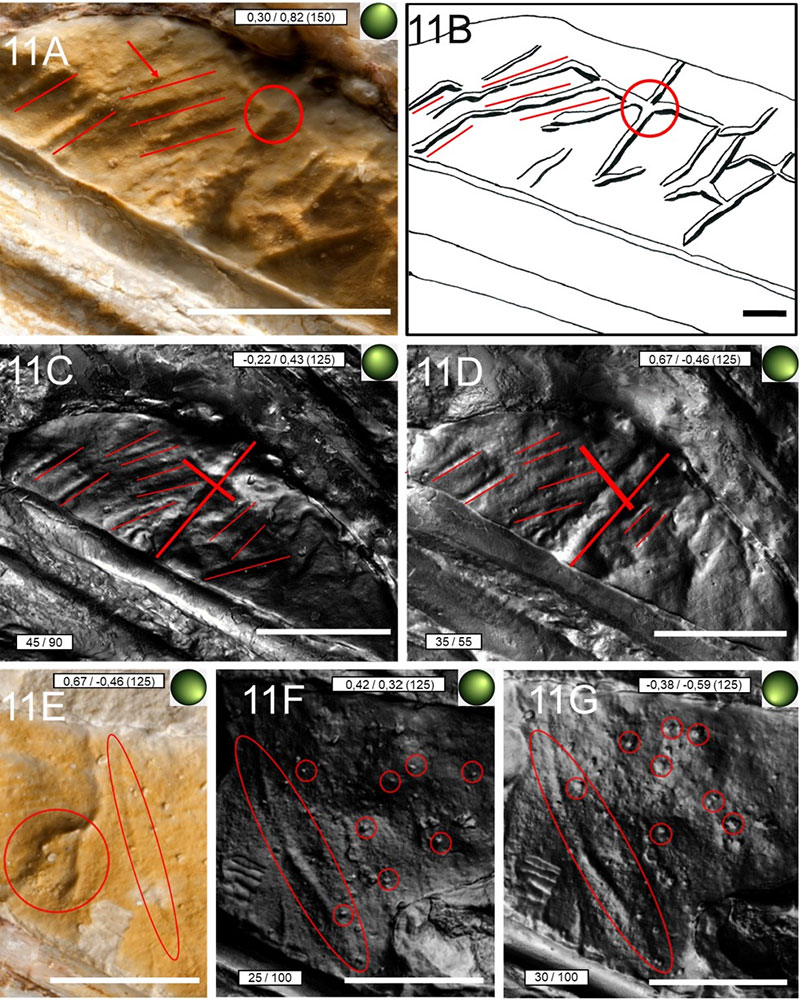
FIGURE 12. Distribution of the different soft tissue types occurring on the main slab of the Scaphognathus crassirostris holotype IGPB Goldfuß 1304a, illustrated in a modified version of Figure 2A. This Figure functions as a guide for the respective location of the soft part types intensively described in the manuscript and the captions to give an overview about their spatial distribution and their occurrence on the main slab, supported by the interpretative drawings of the soft tissues. Pycnofibre Type 2 (smaller red and yellow circles), Type 3 (orange circle), Type 4 (red rectangle), Type 5 (larger red circle), Type 6 (green circle), aktinofibrils (red ellipse), and putative patagium vessels marked by red transverse lines.
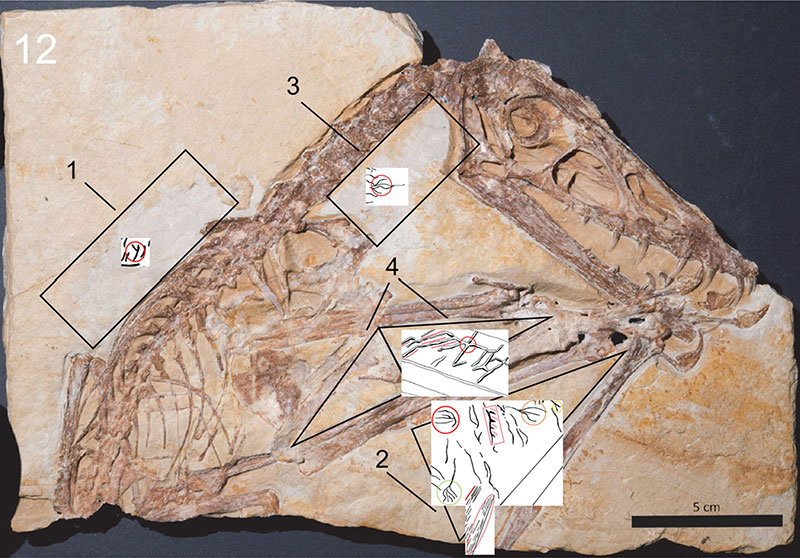
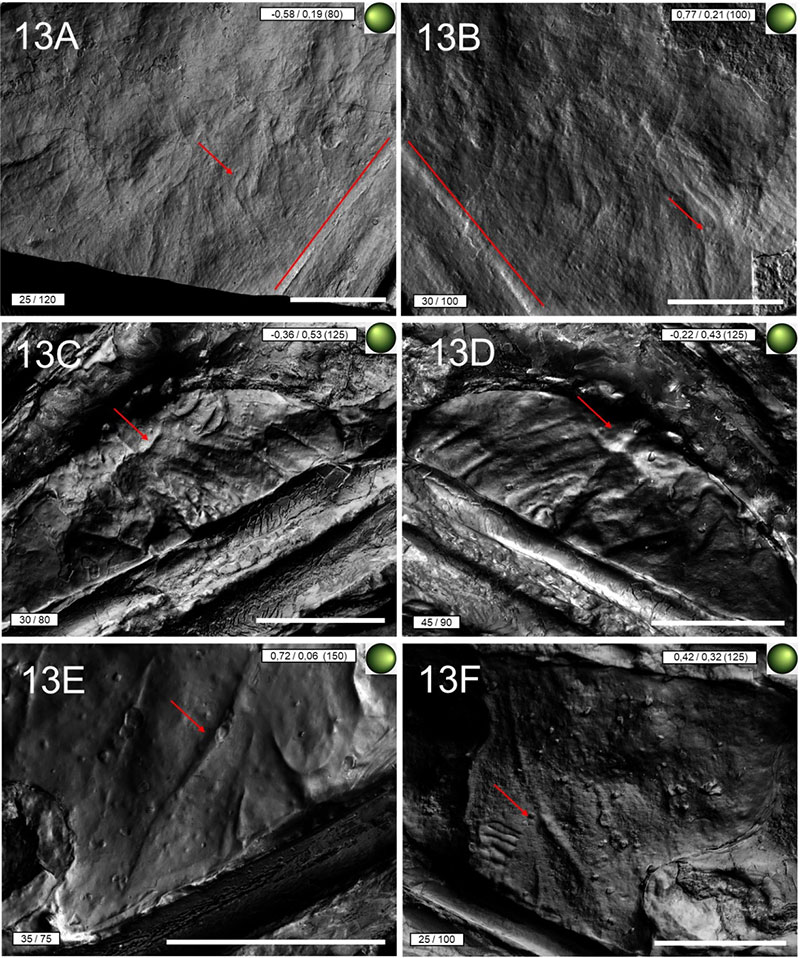
FIGURE 13. Different areas on the main slab as well as on the counter slab sum up the general mode of the soft part preservation in the Scaphognathus crassirostris holotype IGPB Goldfuß 1304b. The impressions on the main slab (images on the left figure side; 13A, 13C, and 13E) are in accordance with the corresponding elevations of the same impressions on the counter slab (right images 13B, 13D, and 13F; see for a direct comparison the red arrows). This illustrates the observation made by Goldfuß (1831), who stated that on the main slab, the soft part impressions are to be seen as grooves, whereas on the counter slab, they are shaped as elevations. This observation led Goldfuß (1831, p. 108) to the conclusion that the pycnofibres must have originally been under the limestone layer of the counter slab. 13A-13B. Pycnofibre impressions and the remains of the wing membrane including the aktinofibrils close to the articulation of the first with the second phalanx of the right wing finger (putative patagium border marked in both images by a red transversal line). 13C-13D. The impressions between the deltopectoral crest of the humerus and the zeugopodial bones of the right wing. Note the strong contrast between the deeply embedded grooves on the main slab (13C) and the clearly perceptible elevations on the counter slab (13D). 13E-13F. Blood vessel impressions. The grooves of the blood vessels on the main slab trace the exact contour of the corresponding elevations on the counter slab.