FIGURE 1. Terminology of some of the characters applied coded for the analysis (modified after Mutterlose, 1983; Doyle, 1990; Schlegelmilch, 1998; Hoffmann and Stevens, 2020).
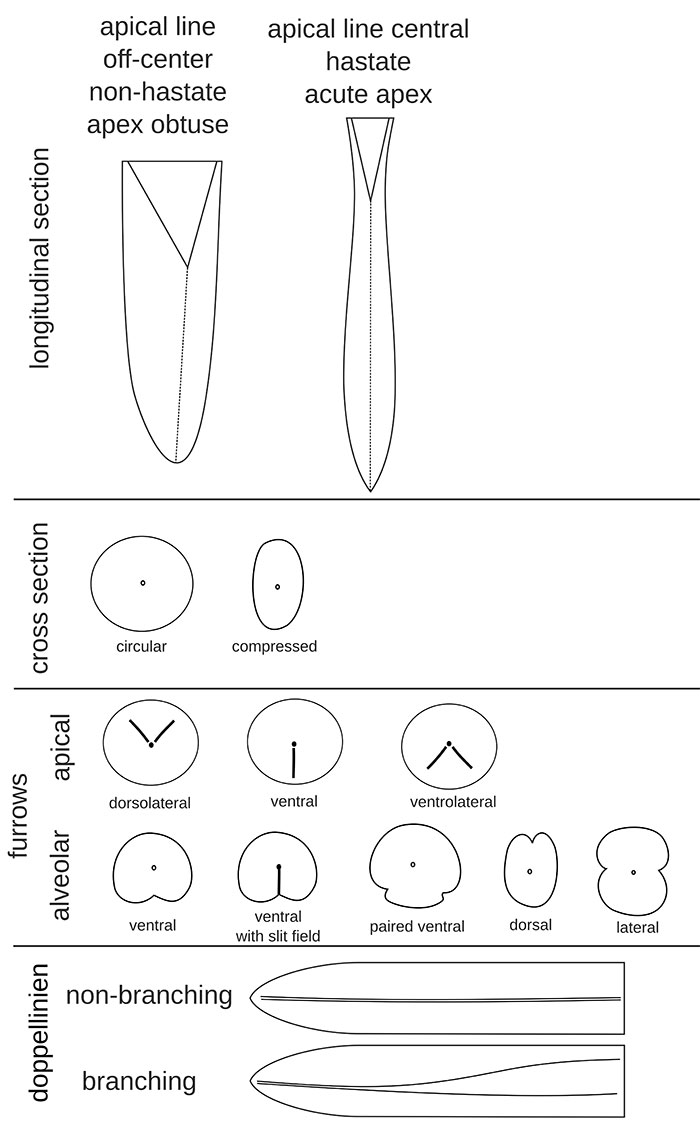
FIGURE 2. Maximum clade credibility tree of the Bayesian tip-dated analysis. Numbers at nodes represent posterior probability, while the blue bars indicate the 95% highest posterior density interval of the divergence time estimates. The small black dot represents the constrained clade. Tips with zero-length branches represent sampled ancestors.
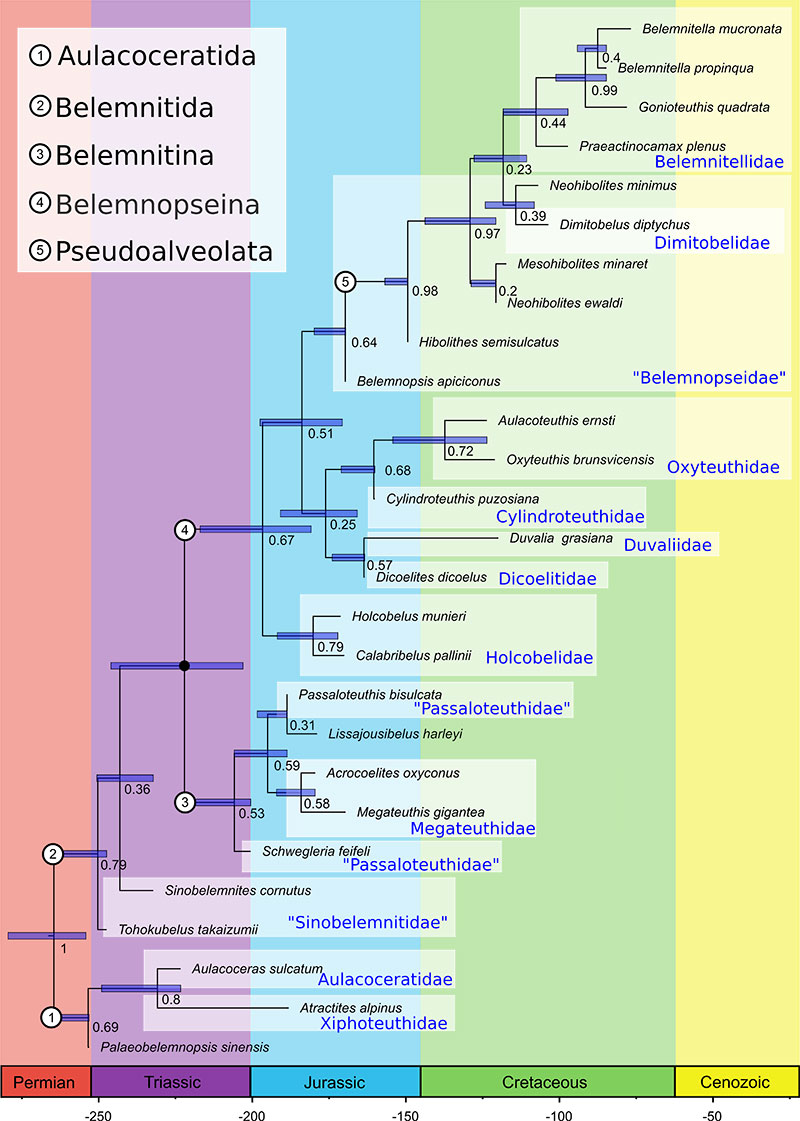
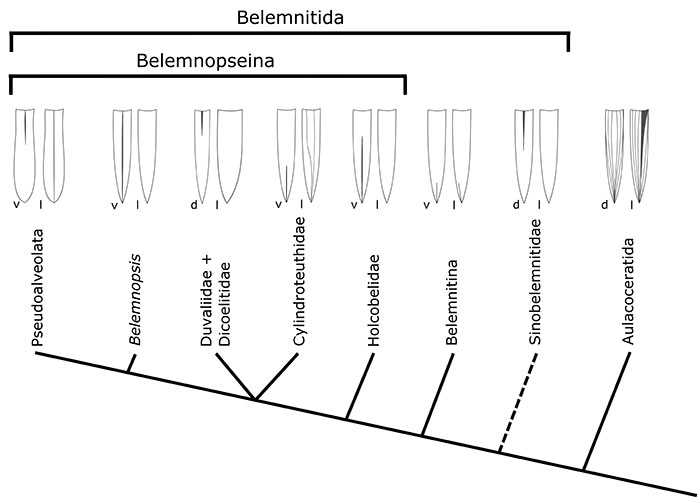
FIGURE 3. Cladogram showing the here suggested systematics of the Belemnitida based on the Bayesian tip-dated analysis. Sketches show the general outer morphological features of a typical representative of the groups in either dorsal (d), ventral (v), or lateral (l) view.