FIGURE 1. Modern Trachemys scripta shell (SAAF) with bite marks attributed to Mecistops cataphractus. Orthographic models of the shell, based on µCT data shown in dorsal (A) and ventral (B) views. Frames on the models highlight specific bite marks, shown on the right as both direct µCT data (C, E, G) and heatmapped slices illustrating bone density changes (D, F, H). In the heatmapped cross sections, colors range from purple (lowest density), to orange (medium density), to white (highest density). Specific bite marks are indicated with purple arrows. Scale bars in A and B equal 5 cm. Scale bars in C, E, and G equal 5 mm.
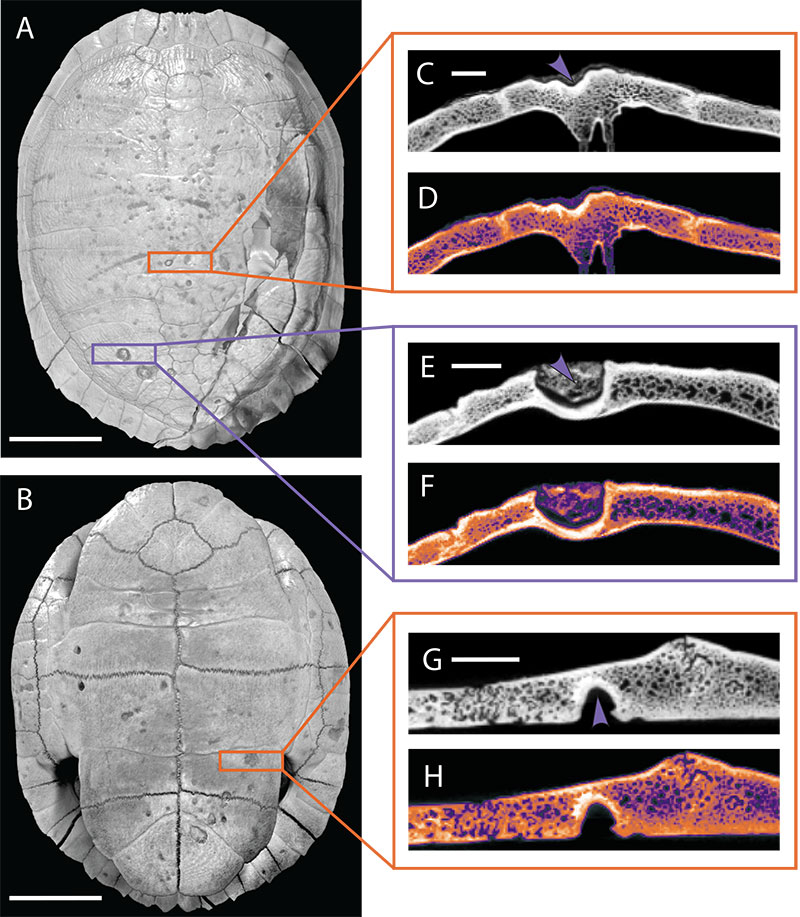
FIGURE 2. Fossil turtle shell fragments (DMNH 2013-07-1319) with putative bite marks. Photographs (A, G) and orthographic models based on µCT data (B, H) shown in external view. Frames on the photograph and model highlight specific areas with bite marks as both direct µCT data (C, E, I) and heatmapped slices illustrating bone density changes (D, F, J). In the heatmapped cross sections, colors range from purple (lowest density), to orange (medium density), to white (highest density). Specific bite marks are indicated with purple arrows. Scale bars in A, B, G, and H equal 2 cm. Scale bars in C, E, and I equal 5 mm.
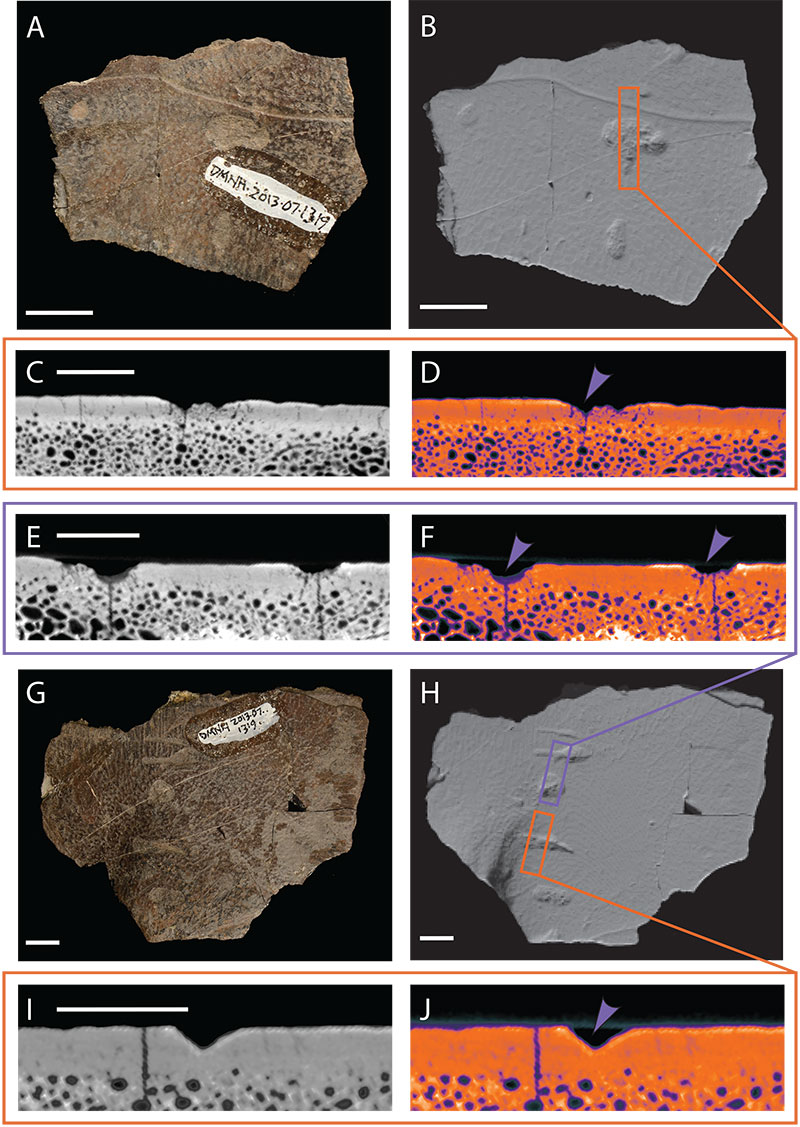
FIGURE 3. Fossil turtle shell fragment (DMNH 2013-07-0567) with putative bite marks. Photograph (A) and orthographic model based on µCT data (B) shown in external view. Frames on the photograph and model highlight specific areas with bite marks as both direct µCT data (C, E) and heatmapped slices illustrating bone density changes (D, F). In the heatmapped cross sections, colors range from purple (lowest density), to orange (medium density), to white (highest density). Specific bite marks are indicated with purple arrows. Scale bars in A and B equal 2 cm. Scale bars in C and E equal 5 mm.
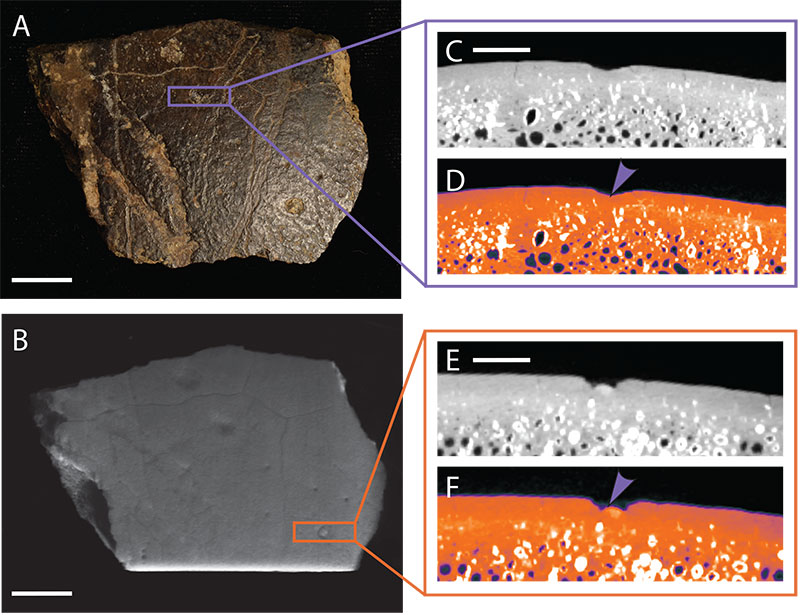
FIGURE 4. Modern Trachemys scripta plastron elements (UTK 2317) with shell disease. Photograph (A) and orthographic model based on µCT data (B) shown in ventral view. Frames on the photograph and model highlight specific areas of shell disease, shown on the right as both direct µCT data (C, E, G) and heatmapped slices illustrating bone density changes (D, F, H). In the heatmapped cross sections, colors range from purple (lowest density), to orange (medium density), to white (highest density). Patches of shell disease are indicated with purple arrows. Scale bars in A and B equal 5 cm. Scale bars in C, E, and G equal 5 mm.
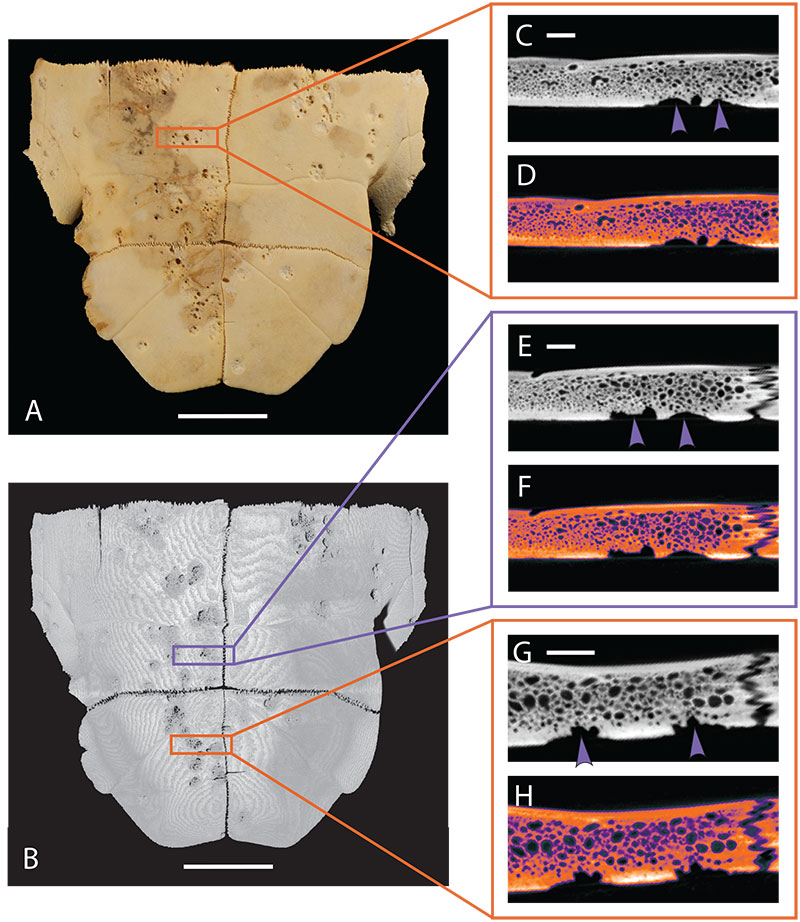
FIGURE 5. Modern Trachemys scripta plastron and partial carapace elements (UTK 1844) with shell disease. Photograph (A) and orthographic model based on µCT data (B) shown in ventral view. Frames on the photograph and model highlight specific areas of shell disease, shown on the right as both direct µCT data (C, E, G) and heatmapped slices illustrating bone density changes (D, F, H). In the heatmapped cross sections, colors range from purple (lowest density), to orange (medium density), to white (highest density). Patches of shell disease are indicated with purple arrows. Scale bars in A and B equal 5 cm. Scale bars in C, E, and G equal 5 mm.
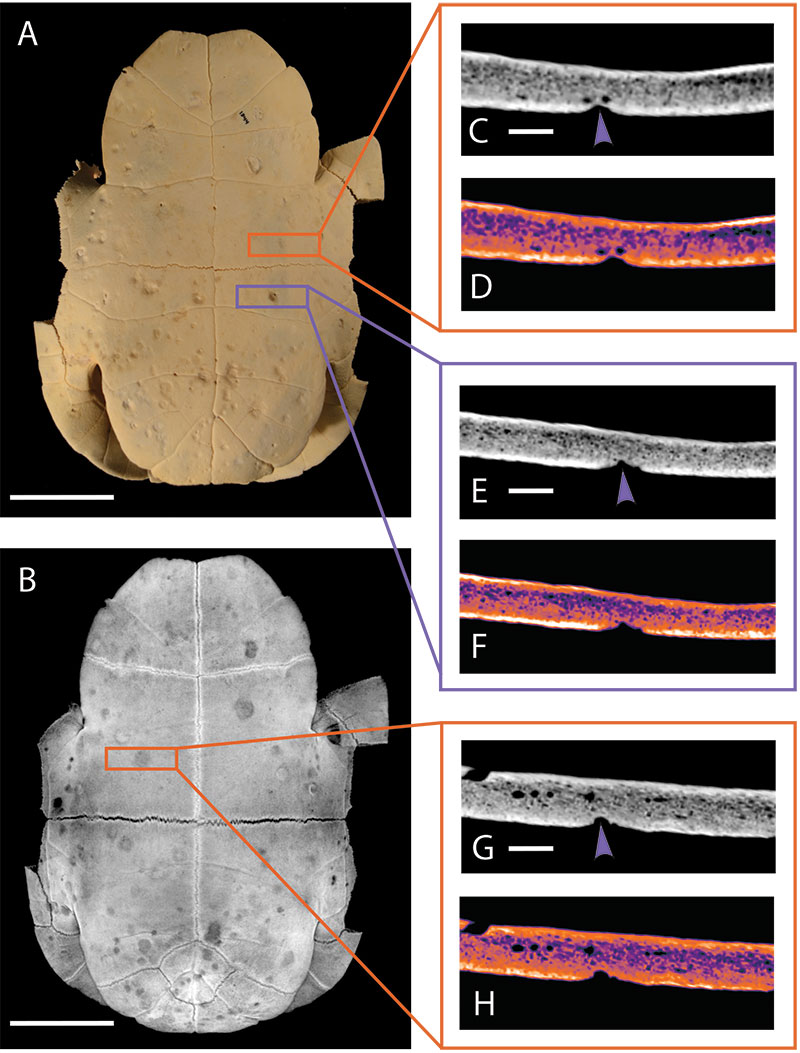
FIGURE 6. Fossil turtle shell fragment (DMNH 2013-07-0563) with putative shell disease. Photograph (A) shown in external view. Frames on the photograph and highlight specific areas with shell disease as both direct µCT data (B, D) and heatmapped slices illustrating bone density changes (C, E). In the heatmapped cross sections, colors range from purple (lowest density), to orange (medium density), to white (highest density). Specific patches of shell disease are indicated with purple arrows. Scale bar in A equals 2 cm. Scale bars in B and D equal 5 mm.
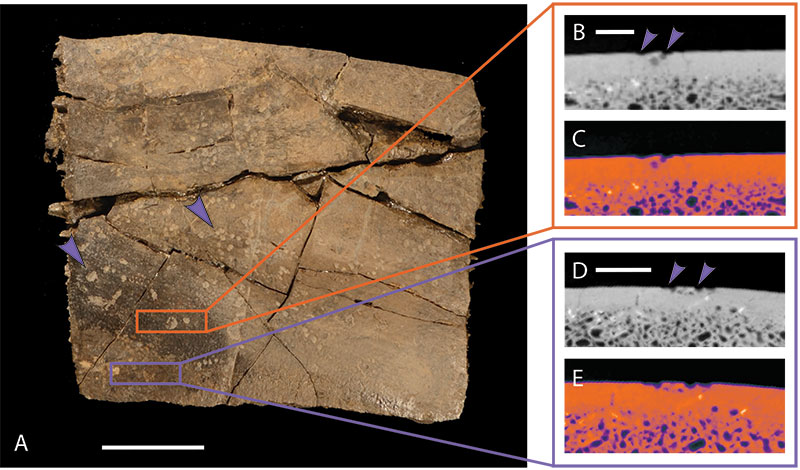
FIGURE 7. Location and geologic position of the Woodbine Group. A. General stratigraphic sequence and timescale for the Cretaceous of central and north central Texas showing the position of the Woodbine Group. Position of the AAS within the Woodbine is marked with an arrowhead. Terrestrial deposits represented by stippled intervals. Time scale based on Denne et al. (2016). Modified from Adams et al. (2011). B. Generalized map of geological units present as surface exposures in the Fort Worth basin with location of AAS shown. Modified after Strganac (2015) and Barnes et al. (1972).
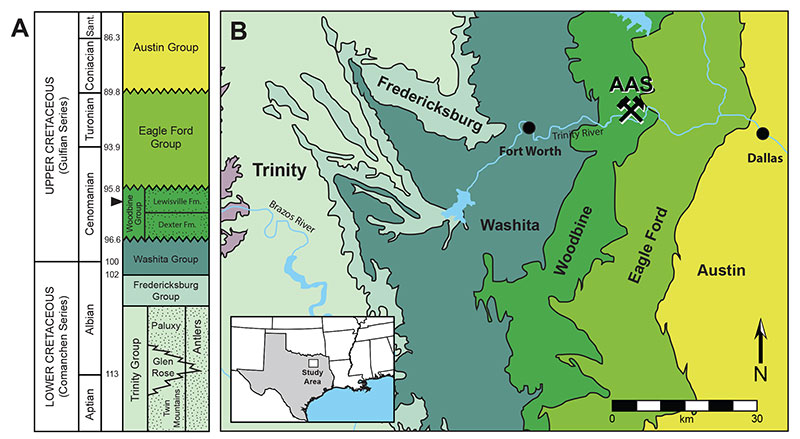
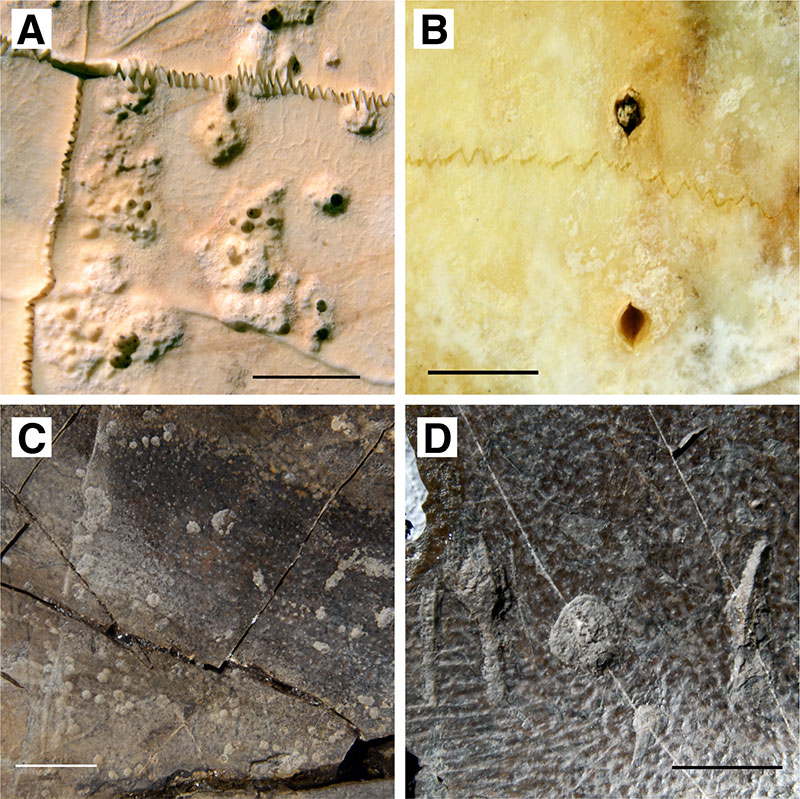
FIGURE 8. Characteristic examples of shell disease and bite marks in modern and fossil turtle shells. Modern shell disease on the plastron of Trachemys scripta, specimen UTK 2317 (A). Modern bite marks (bisected punctures) on the plastron of Trachemys scripta, specimen SAAF unnumbered (B). Fossil shell disease on a fragment of turtle shell, specimen DMNH 2013-07-0563 (C). Fossil bite marks (four scores and one pit) on a fragment of turtle shell, specimen DMNH 2013-07-1319 (D). Scale bars equal 10 mm.