FIGURE 1. Location plate and field photographs. A) Jurkine cliff and outcrop with indication of stratigraphy, lithological levels (Roman numerals), and sample levels (Arabic numerals). B) Detail of middle Sarmatian section with lithological levels (Roman numerals) and sample levels (Arabic numerals); Ot1 and Ot2 indicate levels from which the studied otoliths were obtained for Bratishko et al. (2023). C) Insert map of Ukraine with Kerch Peninsula highlighted. D) Simplified geological map of Kerch Peninsula modified after Andrusov (1893). E) Goby monument in Berdyansk, Ukraine.
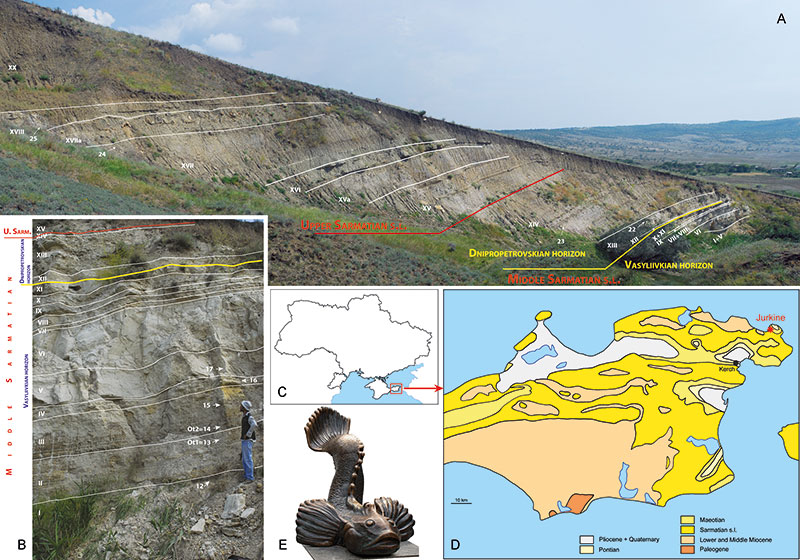
FIGURE 2. Stratigraphic column of the Jurkine section with lithology, sedimentological observations, and fossil contents; lithostratigraphic levels are annotated (L 1 to L 20) as well as levels of microfauna samples (12 to 25 in circles); Oto-sample 1 and 2 indicate levels from which the studied otoliths were obtained for Bratishko et al. (2023). The otoliths studied here are from the microfauna samples 20 and 21. Key foraminiferal, ichthyological, and environmental changes are shown.
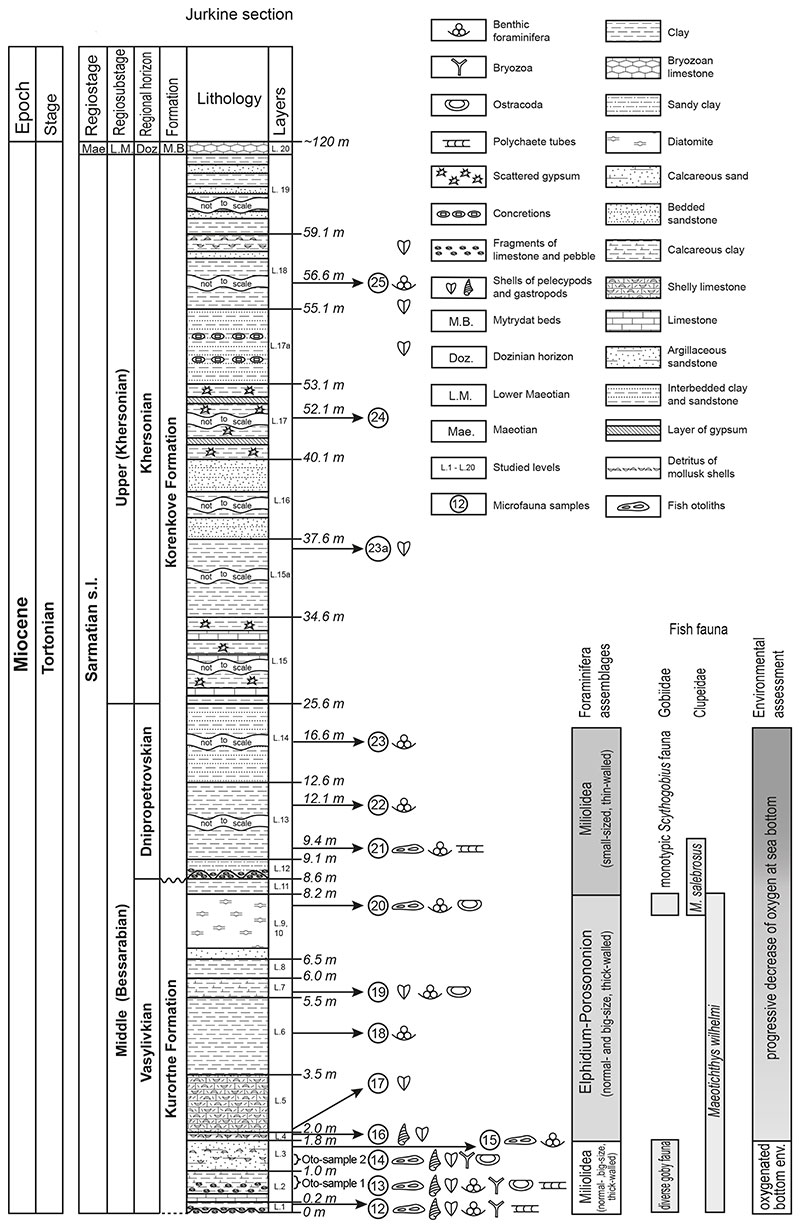
FIGURE 3. Otoliths. A-D Ophichthidae indet. juv., SMF PO 101.337, microfauna sample #20, A = anterior view, B = inner face, C = dorsal view, D = ventral view. E Maeotichthys wilhelmi (Djafarova, 2006), SMF PO 101.338, microfauna sample #20, inner face (reversed), digitally composed from three broken segments. F-Q Maeotichthys salebrosus n. sp., F, I, L, O = inner faces, G, J, M, P = anterior views, H, K, N, Q = ventral views, I-K holotype, NMNH ГКН 5960 079 (reversed), microfauna sample #21, F-H, L-Q paratypes, SMF PO 101.339, microfauna sample #20. R-Y Scythogobius spissus n. gen., n. sp., R, V, W = inner faces, S = dorsal view, Y = ventral view, T, U = posterior views, X = anterior view, R-T holotype, NMNH ГКН 5960 080 (reversed), microfauna sample #20, U-Y paratypes (U-V reversed), SMF PO 101.340, microfauna sample #20. Z-AB Anatirostrum profundorum (Berg, 1927), Recent, Caspian Sea, Gilan, Iran, CMNFI 1999-0023.1, Z = inner face, AA = dorsal view, AB = posterior view.
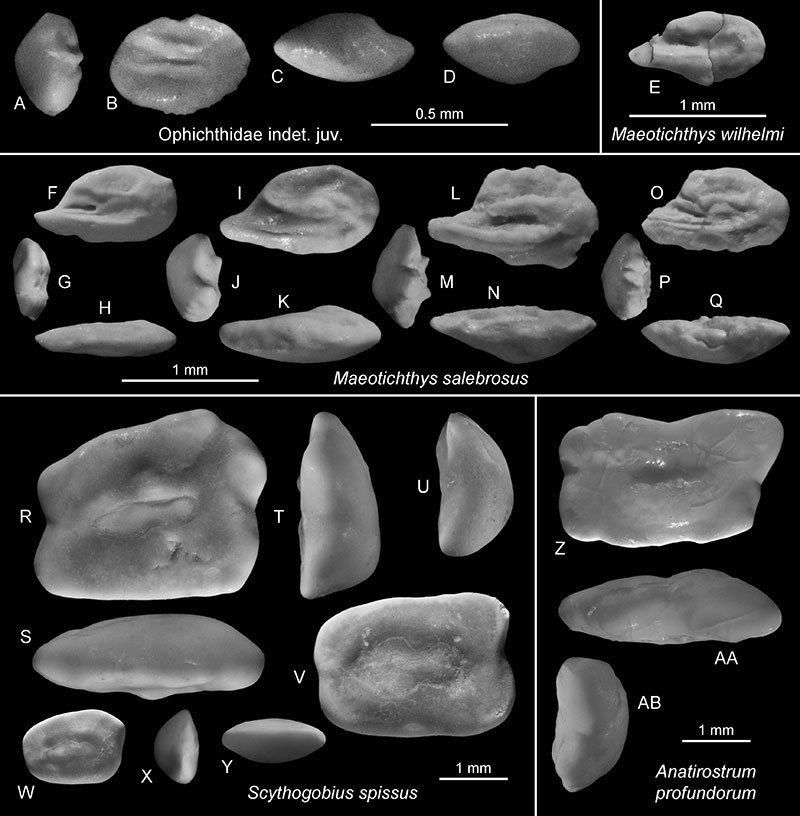
FIGURE 4. Sarmatian Sea in the area of Crimean Peninsula and adjacent territory during the middle to late Sarmatian s.l. (Bessarabian and Khersonian) (after Kelsnikov, 1940, and Belokrys, 1966). Map based on Google Earth.
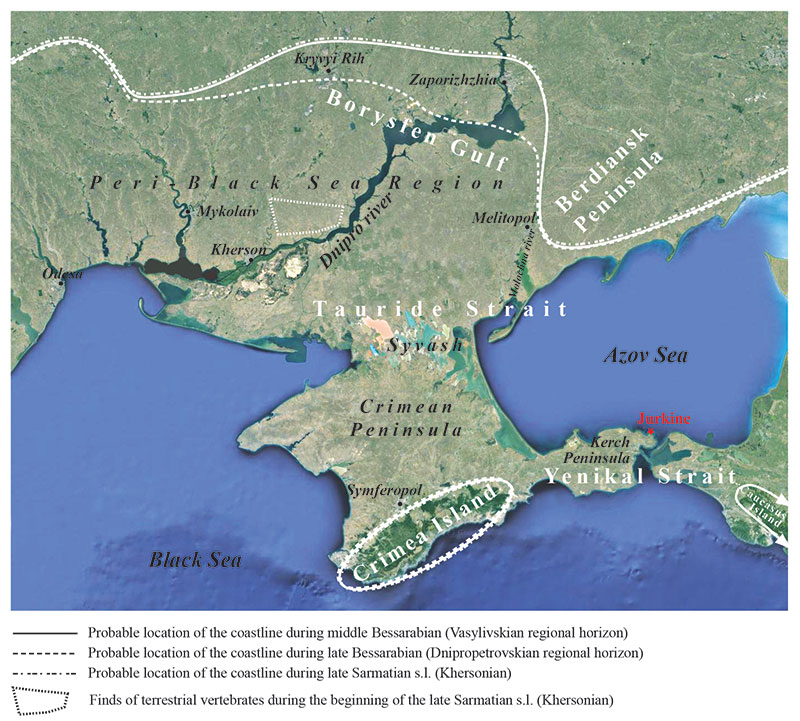
FIGURE 5. Paleoenvironmental evolution of Sarmatian Sea on Crimean Peninsula and adjacent territories during the middle to late Sarmatian s.l. (Bessarabian and Khersonian) (composed after Kolesnikov, 1940; Mlyavko and Pidoplochko, 1955; Didkovskyi, 1964; Belokrys, 1966, 1976; Didkovskyi and Kulichenko, 1975; Bratishko et al., 2023).
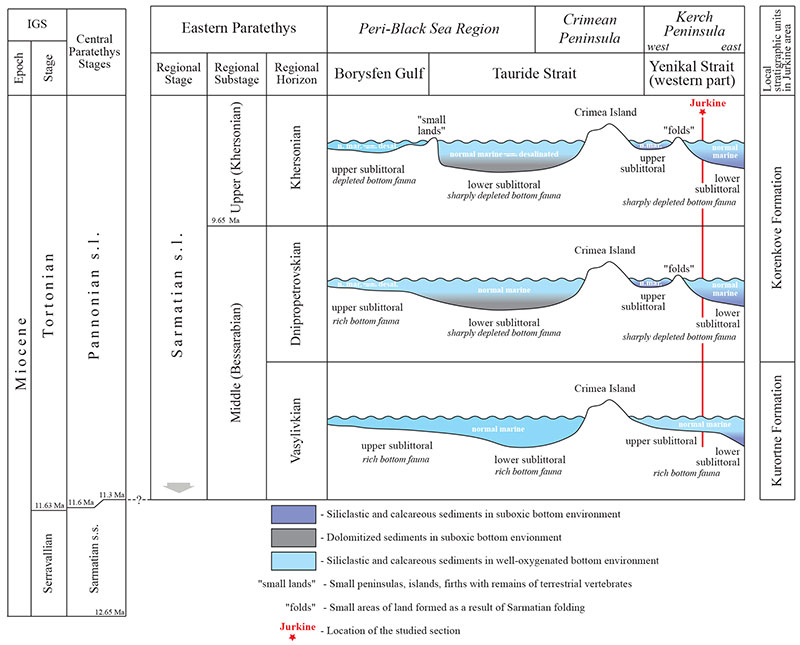
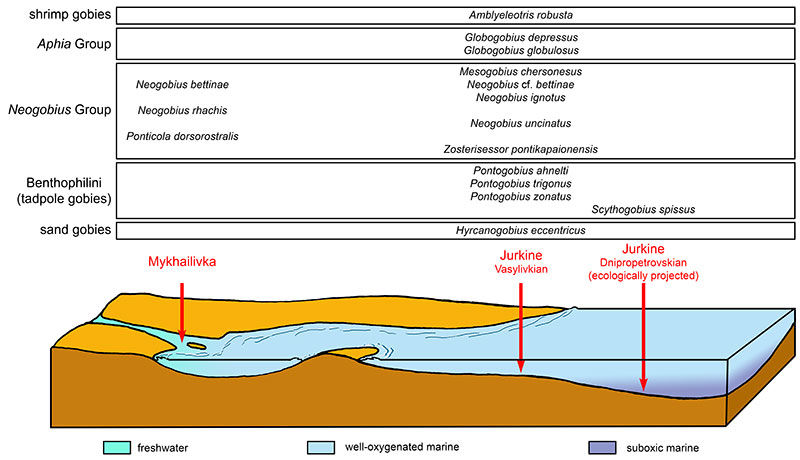
FIGURE 6. Idealized block diagram depicting Bessarabian environmental settings and distribution of otolith-based taxa of the Gobiidae in the various environments of the middle Sarmatian s.l. (Bessarabian) (after Bratishko et al., 2017; Bratishko et al., 2023; and this study). Not to scale.