FIGURE 1. Geographic location of paleontological sites (red dots) and recent samples of S. araneus (dark blue dots) and S. tundrensis (green dots), with diagrammatic drawings of modern boundaries of the species geographic ranges. A, Modern geographic ranges of S. araneus (red line) and S. tundrensis (dark blue line) in Palearctic by source: https://www.iucnredlist.org/ (Hutterer and Kryštufek, 2016; Tsytsulina et al., 2016). B1, Location of samples and fossil sites in Pre-Ural, Ural and West Siberia regions. B2, Location of recent samples in Arkhangelskaya Oblast' and Komi Republic (magnified inset from B1). C, Eastern samples of S. tundrensis. Key: A1-A2, S. araneus samples; Cher1, Cheremukhovo-1 Cave; Da, Dan' sample; DKS, Dyrovatyi Kamen' Grot; F, data by Fadeeva (2016); PtU, sample of the Pechora chromocomal race of S. araneus, 'Ulashevo'; Ra, Ramen'e sample; SeF, sample of the Serov race, 'Foothill'; SeH, sample of the Serov race, 'Hill'; SeV, sample of the Serov race, 'Valley'; Sim3, Sim III Cave; T1-T7, S. tundrensis samples. Detailed information see in Appendix 1-Appendix 2. Map source: ESRI (http://www.esri.com/) via SASPlanet Application (ver. 160707.9476).
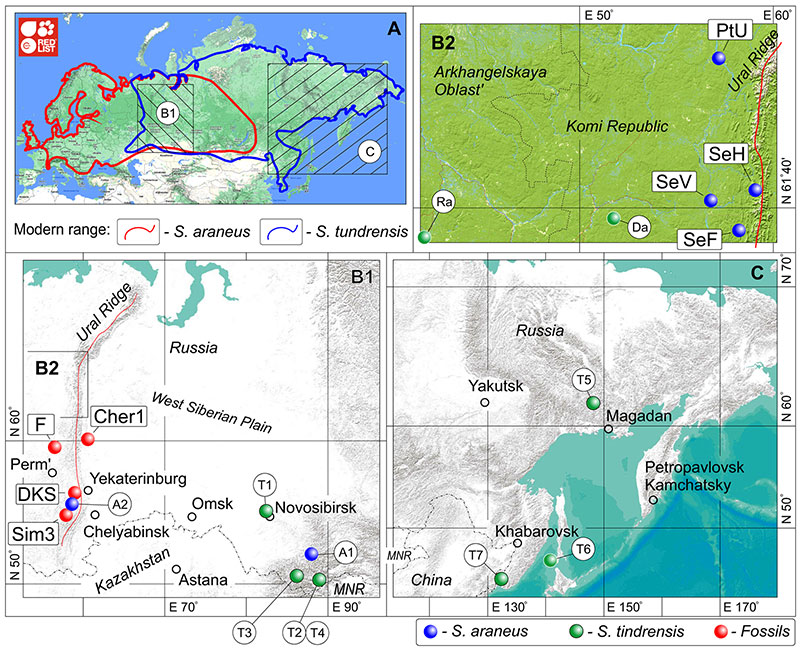
FIGURE 2. Chronological ranges for the Late Pleistocene and Holocene fossil samples of soricids from North, Middle, South and Pre-Ural localities, with information on 14C dating (provided calibrated dates; used intCal20 Curve [Reimer et al., 2020]), geochronology of the Late Pleistocene and Holocene by GICC05 Project (Rasmussen et al., 2006; Andersen et al., 2006; Svensson et al., 2008) and climate-stratigraphic units (Bond and Lotti, 1995; Lisiecki and Raymo, 2005; Rasmussen et al., 2014; Railsback et al., 2015). Key: a, cooling in the Late Holocene stage; AT, Atlantic Climate-Stratigraphic Unit; b, warming from the Early to Middle Holocene stages; BAIC, Bølling-Allerød Interstadial (= GI1); BO, Boreal Climate-Stratigraphic Unit; c, DO1 unit position; Inter., intermediate fauna between warm and cold (vice versa) intervals; GI1/GS1-GS4, Greenland Interstadials/Stadial Units (Rasmussen et al., 2014) that have been synchronized with the Marine Isotope Stages – MIS1-MIS2 (Lisiecki and Raymo, 2005; Railsback et al., 2015); GICC05, Isotope Curve of the Greenland Ice Core Chronology 2005 Project for 55 kyr BP interval (Rasmussen et al., 2006; Andersen et al., 2006; Svensson et al., 2008); LGM, Last Glacial Maximum (= GS4-GS2.1); LGT, Late Glacial Transition (= GS2.1); PB, Preboreal Climate-Stratigraphic Unit; SA, Subatlantic Climate-Stratigraphic Unit; SB, Subboreal Climate-Stratigraphic Unit; YD, Younger Dryas Stadial (= GS1). Acronyms of the samples see in Figure 1 and Appendix 2. The Late Pleistocene and Holocene Schema by Cohen and Gibbard (2019); *, data by Fadeeva (2016): B. Makh. – Bolshaya Makhnevskaya Cave (horizon 140-147 cm); Koziy S. – Koziy Stone Rock (horizon 135-145 cm); Rasik/B21 – Rasik Grot (layer 21); Rasik/B27 – Rasik Grot (layer 27).
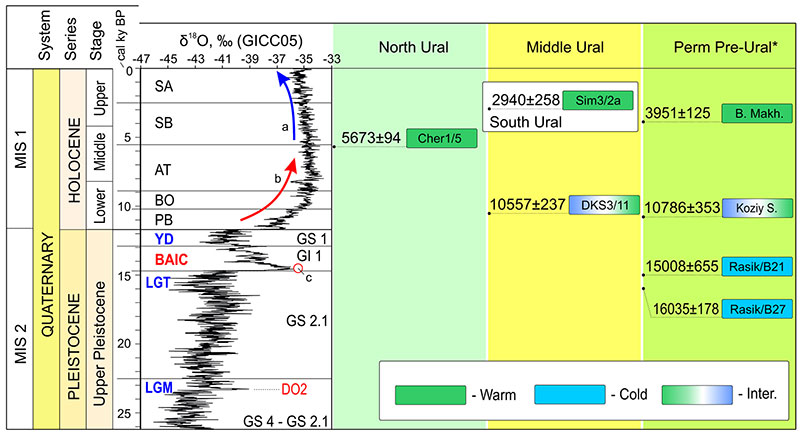
FIGURE 3. Two-dimensional-landmarks and semilandmarks position on the occlusal view of the first lower molar (m1) and medial view of the hemimandible of shrews, and three linear measurements. A1, Diagrammatic image of m1 in occlusal view, with the conids marking. A2, Landmarked m1 in the 'functional view' sense Polly (2003). B1, Right hemimandible, with teeth and parts marking. B2, Landmarked right hemimandible (6 lms, 42 sms). Key: aLm1-m3, alveolar length of the lower molars row(aLML); cn, carnassial notch (notches nomenclature by Lopatin, 2006); lm, landmark (pl. lms); Lm1, lingual length of m1; MRH, mandibular ramus height; pn, protocristid notch; pr., process; sm, semilandmark (pl. sms). Description of the landmarks position see in Appendix 3; some problems that may arise with landmarking the fossil and recent specimens graphically resolving in Appendix 3: Figure A3-1. Mandible of S. araneus (ZIN 107833/1001, PtU; 2D-image of 3D-model). Unscaled.
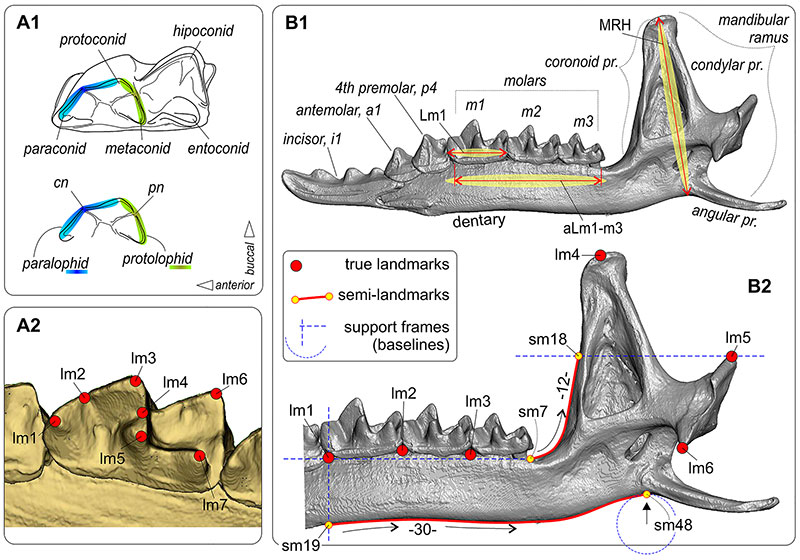
FIGURE 4. Results of the principal component analysis based on the m1 shape. The tooth data set represented three repetitions of four samples within space of PC1 and PC2: SeV, SeF, SeH and PtU. A, PCA result (PC1 vs. PC2). B1, m1 shape in a transformation frame on the negative end of PC1. B2, ibid., on the positive end of PC1. B3, ibid., on the positive end of PC2. B4, ibid., on the negative end of PC2. C1, Simulation of the buccal inclination of the 3D-model during an image acquisition that partly corresponds to the shape variation along of PC1 (X-state). C2, Simulation of the lingual inclination of the 3D-model during an image acquisition (Y-state). C3, Consensus position (correct for image acquisition) of m1. D, Diagrammatic image of the maximal variance disparity definition among three repetitions. Key: a, MEr trajectory between repeats of the Serov race samples; b, MEr trajectory between repeats of the Pechora race sample; c, d, opposite swinging of the 3D-model during the image acquisition; R, repetition; i-vii, differences (see the main text).
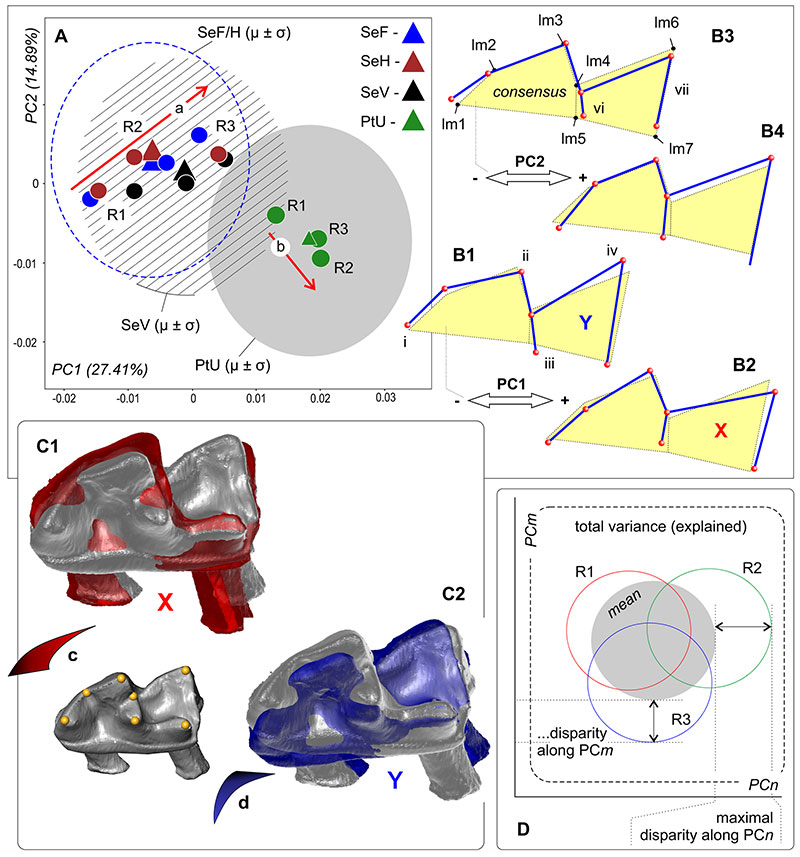
FIGURE 5. Results of the principal component analysis based on the m1 shape (A) and hemimandible shape (B) datasets, combined of S. araneus and S. tundrensis samples. Samples dispersion displayed as convex hulls. Key: ars, specimens of S. araneus from 'non-chromosomal' samples; Dan'(D), sample of S. tundrensis from Dan' village; tdr, S. tundrensis.
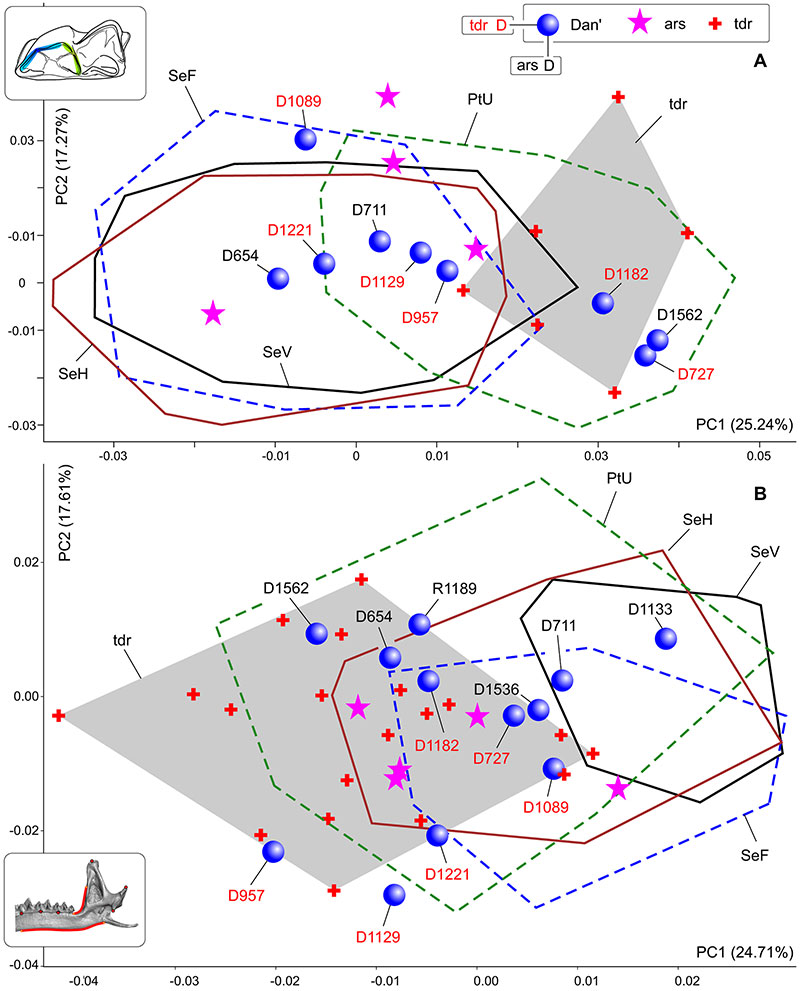
FIGURE 6. Hemimandible shape transformation along of PC1 (morphospace see on Figure 5B). A1, Shape transformation toward of the negative end of PC1 (corresponding to S. tundrensis). A2, Hemimandible of S. tundrensis (ZIN 107833/1149, PtU) in medial view, with an impose mandibular ramus contour of S. araneus (B2). B1, Shape transformation toward of the positive end of PC1 (corresponding to S. araneus). B2, Hemimandible of S. araneus (ZIN 96960; Ser'ga Riv., Mid. Ural). C, Inset from Figure 5B: result of PCA. Key: a, shape change in the posterior shift of the whole cheek-teeth row, with shortening the 'angle' between the m3 posterior alveolus and the mandibular ramus base; b, shape change in the anterior overall inclination of the mandibular ramus; c, shape change in the anterior shift of the condylar process.
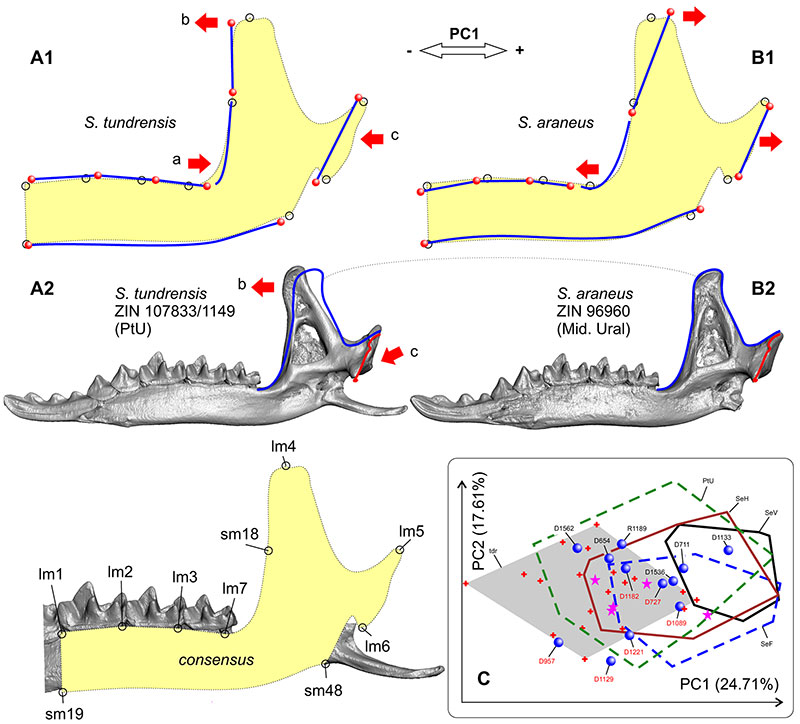
FIGURE 7. Result of regression analyses and the normality test of two linear characters, aLML and MRH. A, Fitting data (aLML vs MRH; n = 138) to a von Bertalanffy growth model. B, aLML values distribution histogram with a gap marking between two subsamples. C, Visual combination of the result of four separate regression analyses: line d1, von Bertalanffy (n = 138); d2 line, bivariate linear regression (BLR; S. tundrensis, n = 20); d3 line, BLR (PtU, n = 56); d4 line, BLR (Serov, n = 45). D, The regression line parameters, d1-d4. Key: a, line of Gaussian distribution; b, gap, detected by the W-test; c, an overlapping zone, calculated by the predicted values (μ ± 2σ); PtU (1063), re-defined specimen (from S. araneus to S. tundrensis).
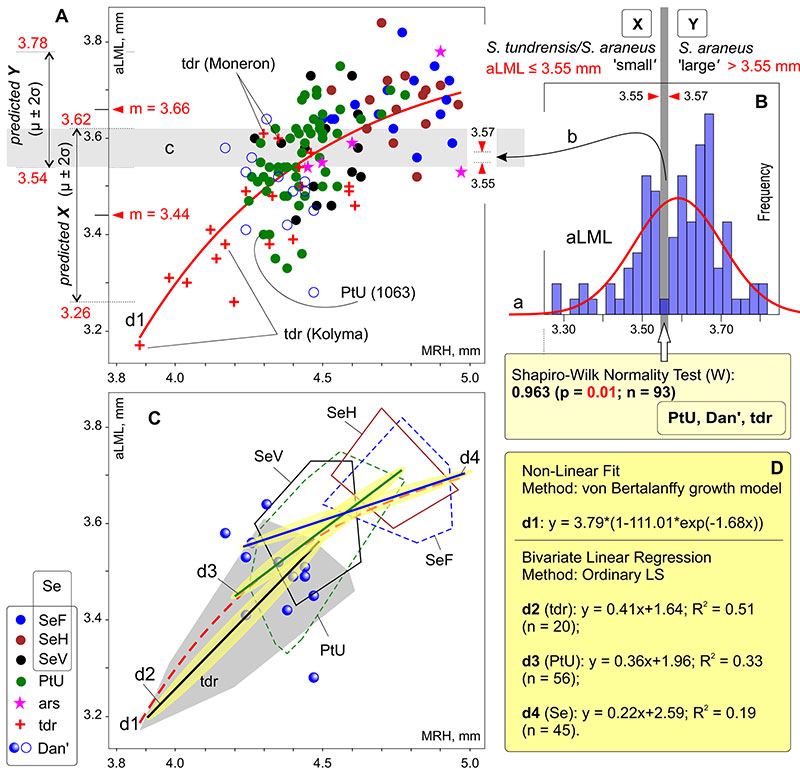
FIGURE 8. Results of PCA based on the combined 'Fossil/Recent' datasets of m1 shape. A, m1 morphospace of PC1-2. B1, inset with the relationships between samples and single specimens of S. tundrensis based on the m1 set. B2, Similar inset with data of S. araneus. Key: a, re-defined specimens of S. araneus (to S. tundrensis: Sim3, S18 and S19); line 'Cher 1,' association of fossil specimens of S. araneus from Cher1 locality; hatched area displays the overall convex hull of Dan' S. tundrensis subsample;line 'Sim3,' association of fossil specimens of S. araneus from Sim3 locality; see also Figure 5.
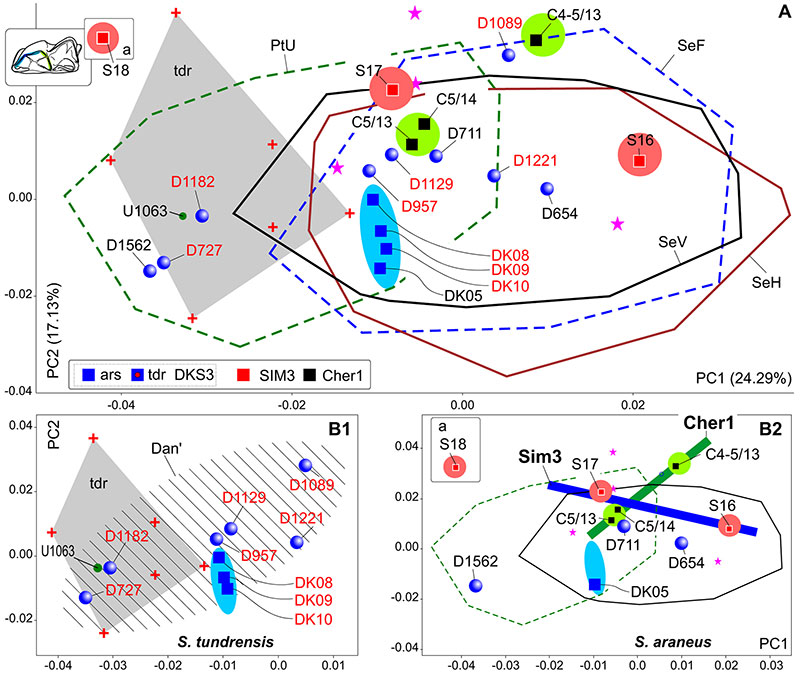
FIGURE 9. Results of PCA based on the combined ‘Fossil/Recent’ datasets of hemimandible shape. A, Mandibular morphospace of PC1-2. B, 'Timespan inset' with information on the supposed shape changes between fossil Uralian samples of S. tundrensis from DKS3, Sim3 and the recent Dan' localities (see details in Figure 2, Table 3). Time scale has been reversed due to corresponding the samples position in the morphospace. C, Inset with information on the supposed shape changes between fossil Uralian samples of S. araneus from DKS3, Sim3 and the recent Dan' localities. Key: a, re-defined specimens of S. araneus (to S. tundrensis: Sim3, S18 and S19); b, magnified relationships between specimens from DKS3 sample; c, common area of DK08 and DK09 (DKS3), repeating by the m1 and mandibular shape (cf. Figure 8); d, cooling in the Late Holocene stage (see Figure 2: arrow 'a'); e, warming from the Early to Middle Holocene stages (see Figure 2: arrow 'b'); f, shape changes trajectory, associated with size increasing between the Early Holocene DKS3 and the Late Holocene Sim3 samples of S. tundrensis; g, shape changes trajectory, associated with size decreasing between the Late Holocene Sim3 sample and the recent Dan' sample of S. tundrensis; h, shape similarity between the Early Holocene DKS3 and the Late Holocene Sim3 samples of S. araneus; hatched area displays the overall convex hull of Dan' S. tundrensis subsample; y, the shape changes trajectory, associated with size decreasing between the Late Holocene Sim3 sample and the recent Dan' sample of S. araneus (changes weaker than 'g'); see also Figure 5, Figure 8.
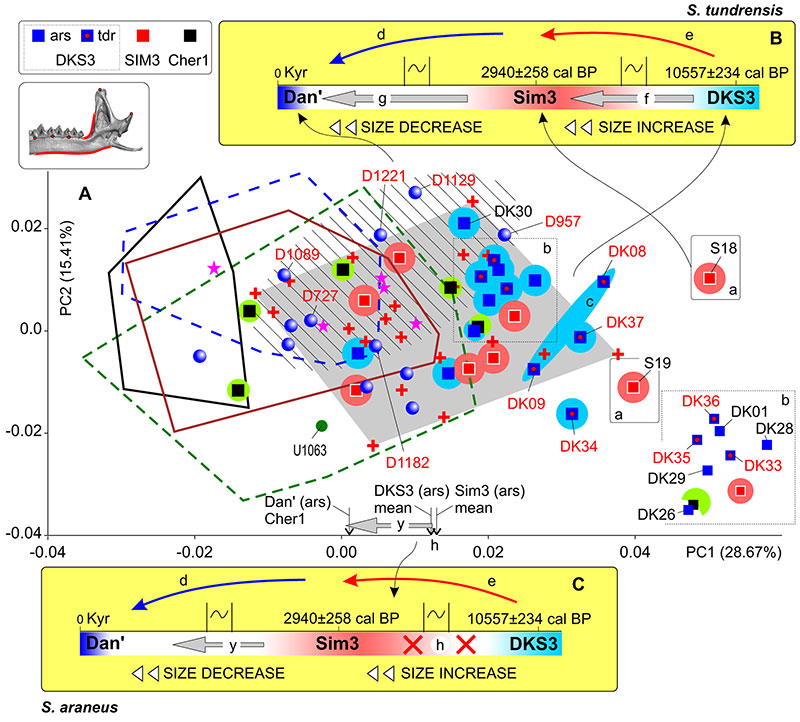
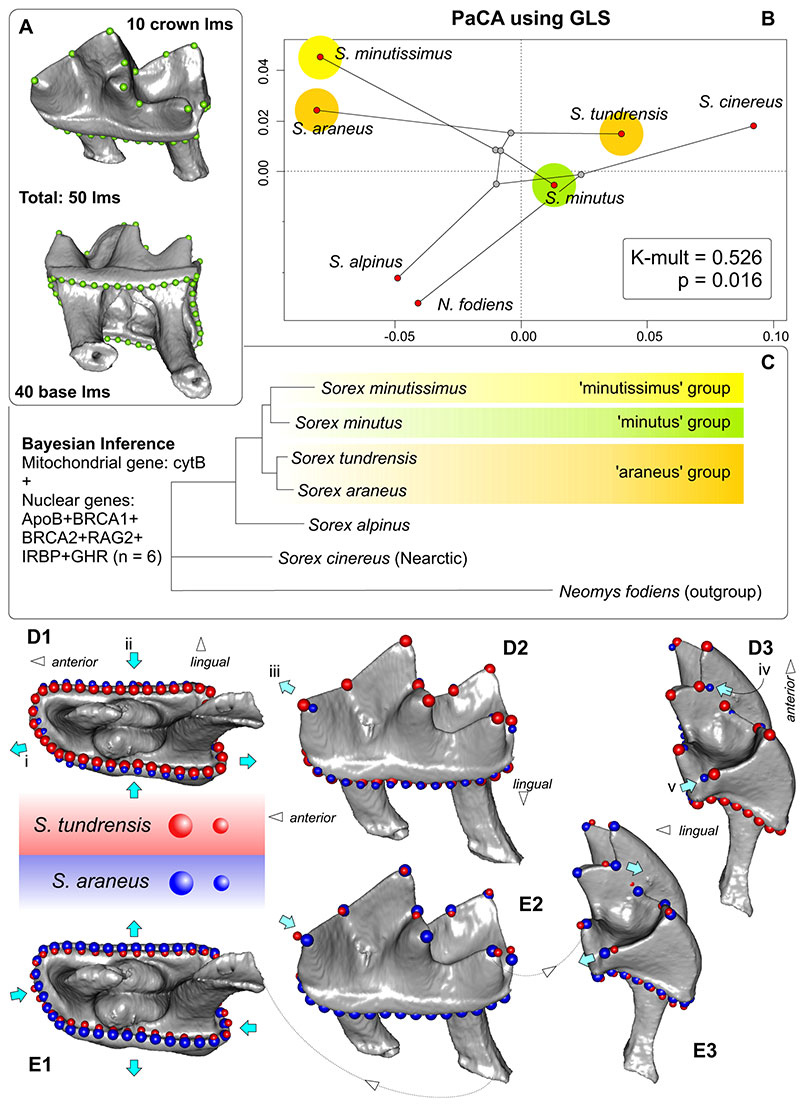
FIGURE 10. Combined plot of three-dimensional landmarks data set of m1 (A), visualization of two first axes of PCA (phylomorphospace) performed on three-dimensional data set of the m1 shape with phylogenetic projection (B), molecular phylogeny (concatenated tree based on seven mitochondrial and nuclear genes; source: Bannikova et al., 2018; see Appendix 6), displaying the estimated phylogenetic relationships among Sorex species (C), and visualization of the shape changes between S. tundrensis (upper teeth, red points) (D) and S. araneus (lower teeth, blue points) (E). A, m1 in subocclusal (upper) and subapical (bottom) views with landmarks position (Appendix 3: Table A3-3). B, Phylomorphospace of 7 soricine species (six Sorex, ingroup; Neomys outgroup). C, Phylogenetic tree. D1(E1), Shape transformation in the apical view. D2 (E2), Shape transformation in the lingual view. D3(E3), Shape transformation in the posterior view. Key: i, elongation of the tooth crown base in S. tundrensis; ii, narrowing the crown base in S. tundrensis; iii, posterior shifting of the paraconid of S. tundrensis; iv, swallowing the protocristid notch of S. tundrensis; v, shortening of the hypolophid of S. tundrensis. D, E unscaled.