FIGURE 1. A) Google map showing the fossil site (marked by star in yellow color) and Katilu-Khad (marked in blue colour) at Dunera, Punjab, India; B) General geological map of the study area showing fossil locality and Katilu- Khad section (modified after Raiverman, 2002); C) Magnetostratigraphic dated section in Katilu-Khad of Dunera (after Sinha et al., 2005) and revised ages from the most updated version of GPTS (Ogg 2020); D) Stratigraphic section of the bone bed in lower part of Katilu-Khad; E) Stratigraphic section of the present study fossil site at Dunera; F, G) Field photographs of the locality (arrow represents the fossiliferous bed).
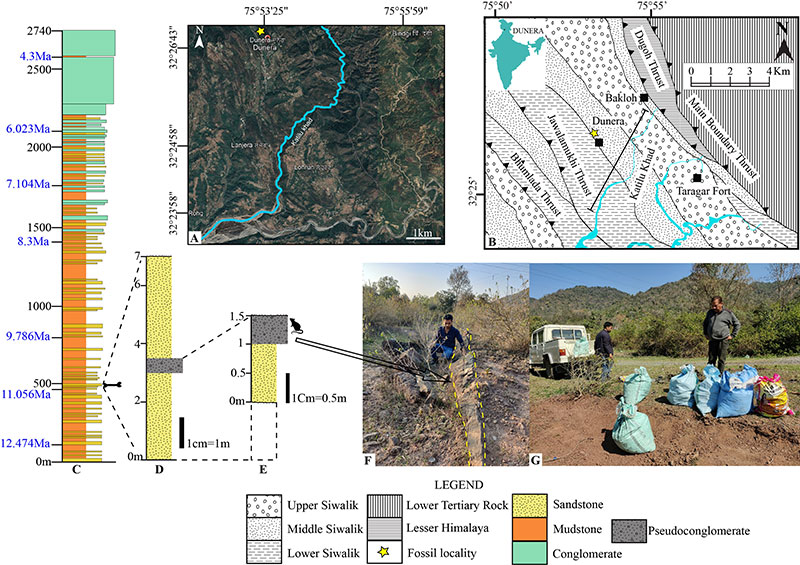
FIGURE 2. 3D surface models of cf. Tamias urialis in occlusal views. A) WIMF/A 4743 right M1/2 (mirror-imaged); B) WIMF/A 4749 left m1/2. Note: Mesial towards the left and distal towards the right in all panels.
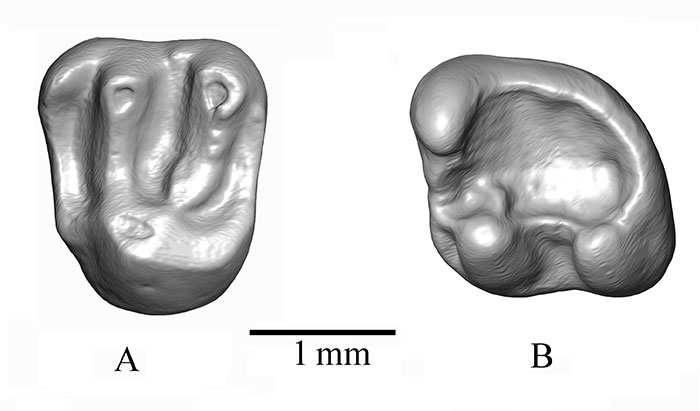
FIGURE 3. Scatterplot of molar size (sq. root of width*length) vs. shape (max. width/length) of Siwalik Tamias specimens. A) M1/M2; B) m1/m2. See Table 1 for data used in the plots. Note that minimum, mean and maximum values were used to approximate ranges of variation in large samples of Tamias anatoliensis, T. urialis, and T. atsali.
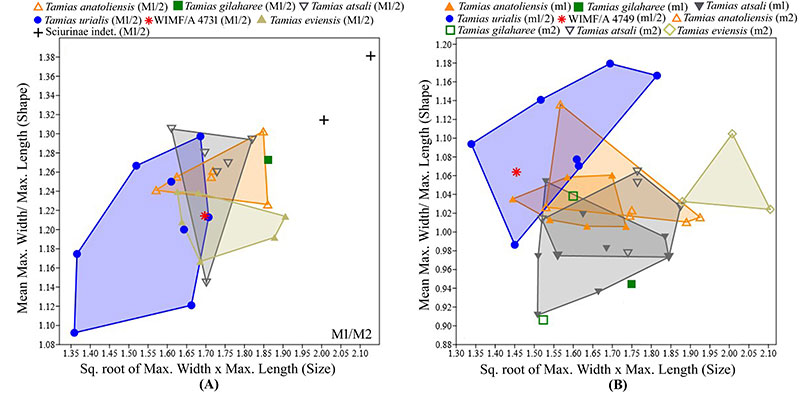
FIGURE 4. 3D surface models of Democricetodon fejfari in occlusal views. A) WIMF/A 4734, right M3; B) WIMF/A 4735, left M3; C) WIMF/A 4729, right m1; D) WIMF/A 4740, left m2. Note: Mesial towards the left and distal towards the right in all panels.
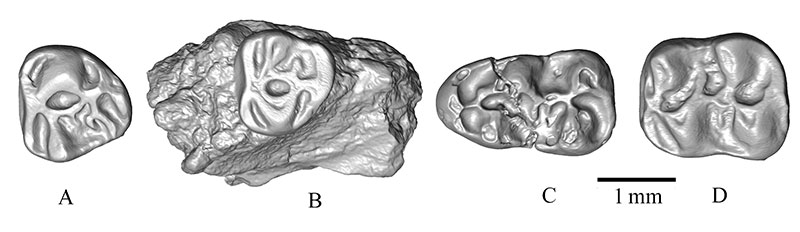
FIGURE 5. Progonomys cf. hussaini in occlusal views. Leica stereozoom Microscope image: A) WIMF/A 4745, right M1. 3D surface models: B) WIMF/A 4746, left M2; C) WIMF/A 4747, left M2; D) WIMF/A 4739, right m1; E) WIMF/A 4737, left m2; F) WIMF/A 4738, left m2; G) WIMF/A 4748, left m2; H) WIMF/A 4736, right m3. Note: Mesial towards the left and distal towards the right in all panels.
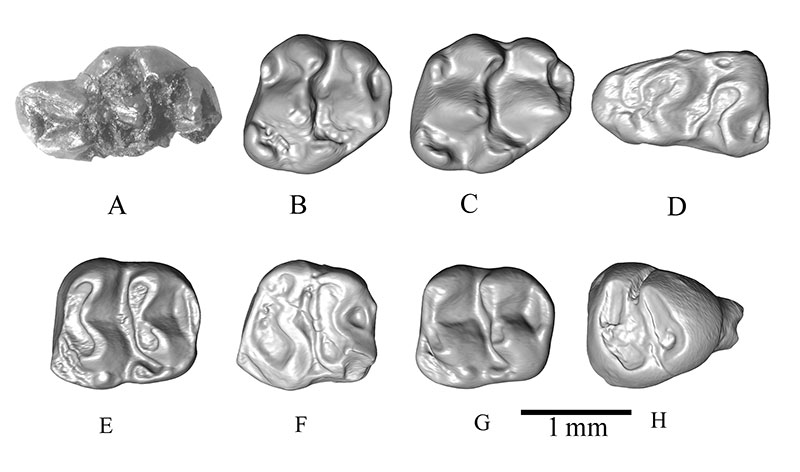
FIGURE 6. Scatterplot of molar size (sq. root of width*length) vs. shape (max. width/length) in Siwalik murid specimens. A) M1; B) M2; C) m1; D) m2; E) m3. See Appendix for data used in the plots.
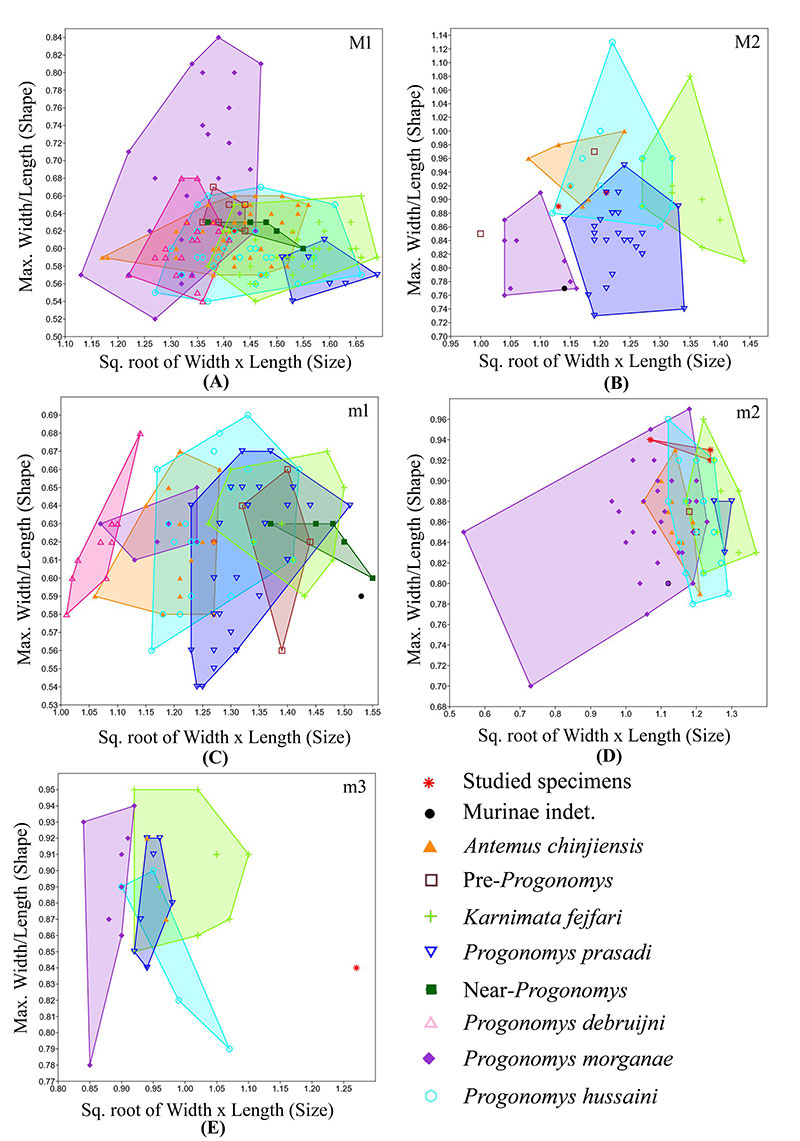
FIGURE 7. 3D surface models of Sayimys sivalensis in occlusal views. A) WIMF/A 4733, left M2; B) WIMF/A 4750, right M2 C) WIMF/A 4731, left M2 or M3; D) WIMF/A 4732 left m1 or m2. Note: Mesial towards the left and distal towards the right in all panels.
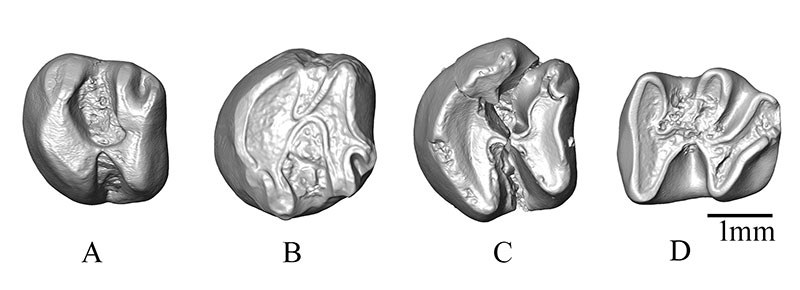
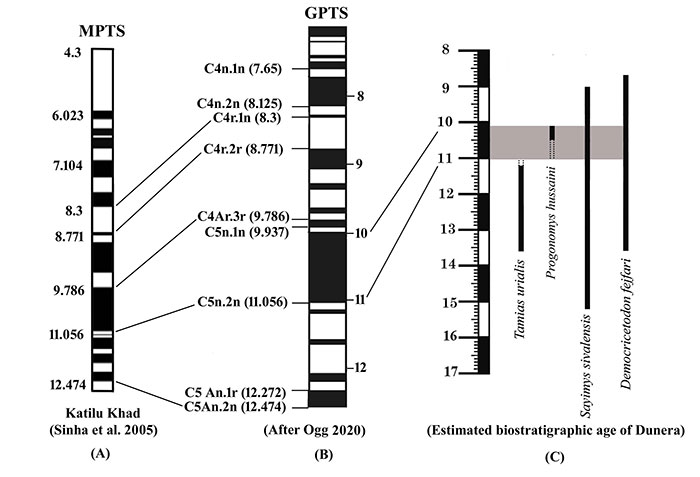
FIGURE 8. A) Magnetostratigraphy for the Katilu Khad section exposed nearby the Dunera town of Pathankot, Punjab (Sinha et al., 2005); B) Geomagnetic Polarity Time Scale (after Ogg, 2020); C) The proposed age of the present study locality (Dunera) against observed Potwar Siwalik rodent biochronology.