FIGURE 1. (A) Geographic map of East Africa with the location of Buluk indicated by the red star. The location of sites with comparative data included in these analyses, Moroto, Maboko, and Fort Ternan, are indicated by black circles. (B) Simplified stratigraphic column of the Bakate Formation, adapted from McDougall and Watkins (1985) and Watkins (1989).
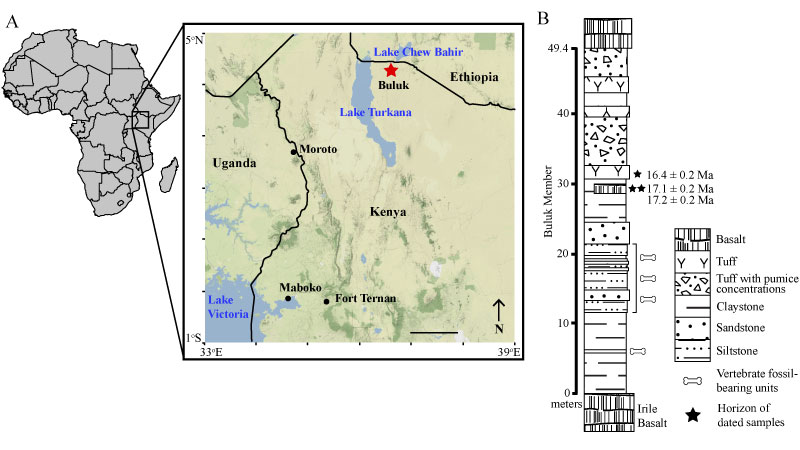
FIGURE 2. Buluk δ13Cenamel value boxplots arranged by taxonomic guild. Vertical lines in a boxplot represent the median, box ends indicate the 1st and 3rd quartiles, and horizontal lines define the range of values except for outliers. The shaded region to the left denotes values for feeding in closed canopy forest while the shaded region to the right indicates mixed C3/C4 diets. The non-shaded region designates values from open canopy foraging. Sample sizes are in parentheses.
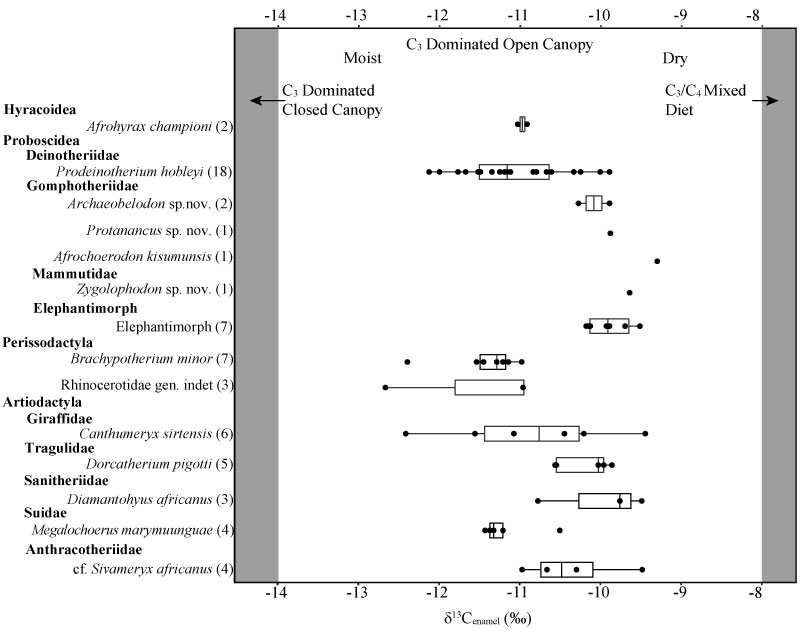
FIGURE 3. Buluk δ18Oenamel value boxplots arranged by taxonomic guild. Sample sizes are in parentheses.
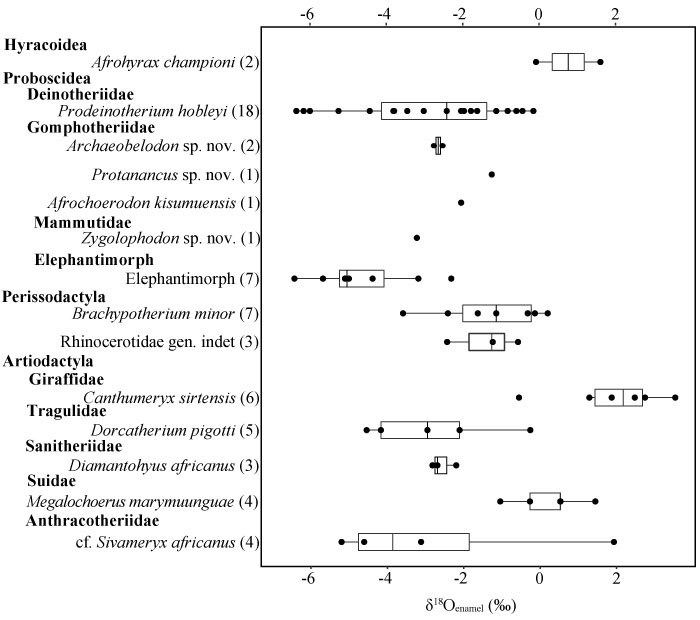
FIGURE 4. δ13Cenamel value boxplots for Buluk (blue), Moroto (white), Maboko (orange), and Fort Ternan (pink) and violin plots of published δ13Ccarbonate values. The top panel labeled “All Soil Carbonate Samples” compares the violin plots of published δ13Ccarbonate values from Buluk (Peppe et al., 2023), Fort Ternan (Cerling et al., 1991), and Moroto (MacLatchy et al., 2023), which were corrected to a pre-Industrial δ13Catm value of -6.3‰. Vertical grey lines represent C3 and water-stressed C3 (ws C3) endmembers estimated in Peppe et al., (2023) and corrected to a pre-Industrial δ13C1750 value. Herbivore δ13Cenamel values for Fort Ternan are from Cerling et al., (1997), δ13Cenamel values for Maboko herbivores were taken from Arney et al., (2022), and δ13Cenamel values for Moroto are extracted from MacLatchy et al., 2023. All carbon isotopic values are standardized to δ13C1750 values. The panel of δ13Cenamel values labeled “All Samples” compares boxplots of all herbivore δ13Cenamel values from each locality. Bottom panels compare δ13Cenamel values of taxonomic families between sites. The left grey panel designates δ13 Cenamel values falling within the range of closed canopy forest diets. The right grey panel indicates δ13Cenamel values of mixed C3/C4 diets.
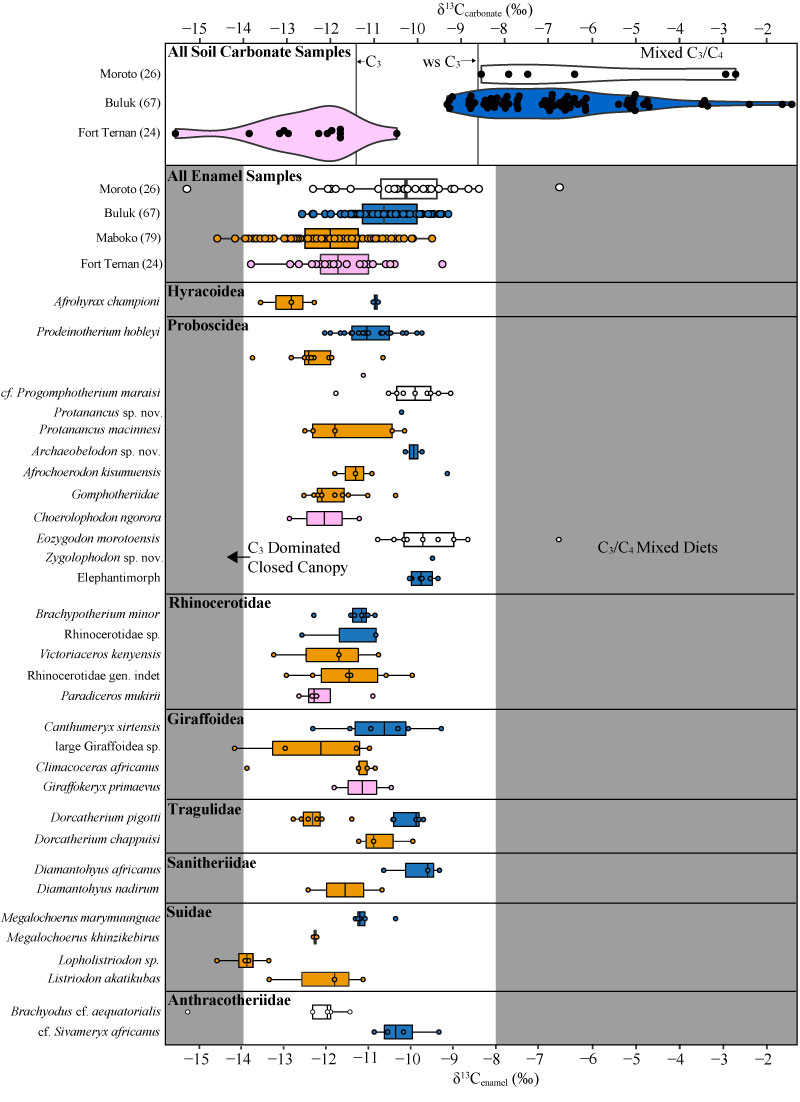
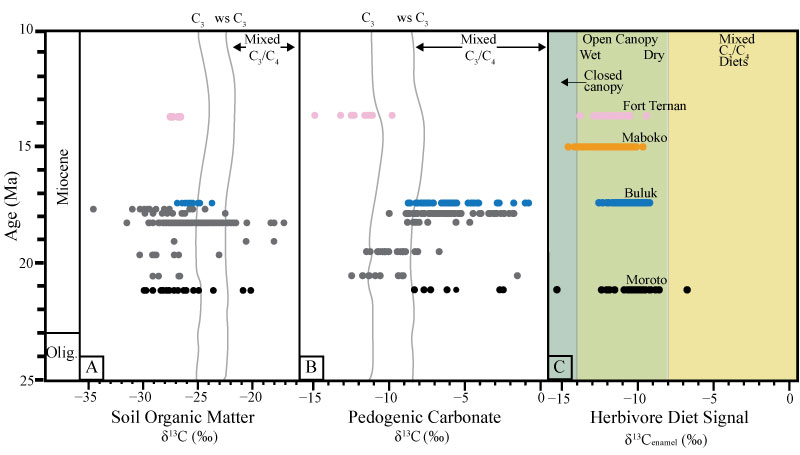
FIGURE 5. Long-term record of soil organic matter, pedogenic carbonate, and enamel stable carbon isotopes from the late Oligocene to late Miocene. The left and middle panels are published soil organic (A) and pedogenic carbonate (B) carbon isotopic values from early Miocene localities (Peppe et al., 2023) and Fort Ternan (Cerling et al., 1991). Vertical grey lines indicate C3 and water-stressed C3 (ws C3) endmember ẟ13C values calculated and standardized for atmospheric CO2 δ13C. Data from Buluk (blue), Moroto (black), and Fort Ternan (pink) are highlighted. The right panel shows Buluk and published herbivore enamel δ13C values (C) from Moroto (MacLatchy et al., 2023), Maboko (Arney et al., 2022), and Fort Ternan (Cerling et al., 1997). Maboko data is highlighted in orange. From left to right, straight, vertical lines represent closed canopy habitats and mixed C3/C4 endmember enamel ẟ13C values. Panels A and B are modified from “Oldest evidence of abundant C4 grasses and habitat heterogeneity in eastern Africa” by Peppe et al., 2023, Science, 380(6641), page 176. Panels A and B of the image are not published under the terms of the CC-BY license of this article. For permission to reuse, please see Peppe et al. (2023).