APPENDIX 1.
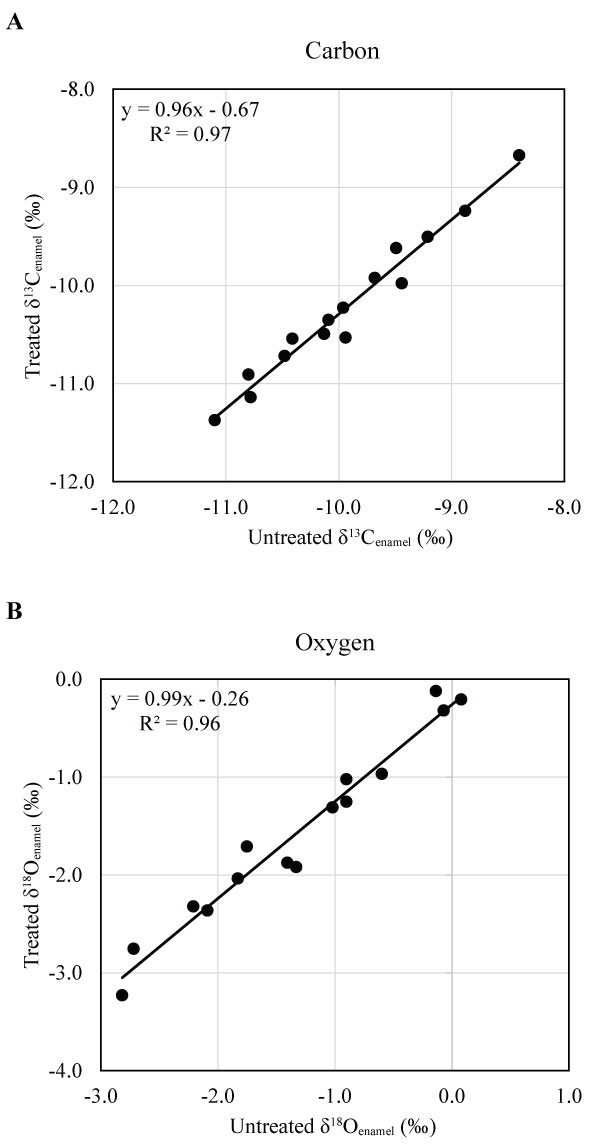
Bivariate plots of ẟ13Cenamel (A) and ẟ18Oenamel values (B) of treated versus untreated enamel samples. ẟ13C values are in parts per million (‰) units. Linear regression lines and equations are reported on plots.
APPENDIX 2.
Carbon and oxygen data of fossil herbivore enamel from Buluk.
| Accession no. | Taxon | δ13C untreated | δ13C treated | δ13Cenamel Untreated v. treated difference | δ13C1750 17.2ma | δ13C1750 16ma1 | δ18O untreated | δ18O treated | δ18Oenamel Untreated v. treated difference |
| Cetartiodactyla | |||||||||
| Anthracotheriidae | |||||||||
| WS 12581 | cf. Sivameryx | -9.4 | -9.7 | -9.9 | -10.9 | -4.4 | -4.6 | ||
| WS 31258 | cf. Sivameryx | -9.7 | -10 | -10.3 | -11.3 | -5 | -5.2 | ||
| B 480 | cf. Sivameryx | -10.1 | -10.3 | -10.6 | -11.4 | -2.9 | -3.1 | ||
| WS 12841 | cf. Sivameryx | -8.5 | -8.9 | -9 | -10.1 | 2.2 | 2 | ||
| Suidae | |||||||||
| B 152 | Megalochoerus marymuunguae | -10.5 | -10.7 | -11 | -12 | 0.8 | 0.5 | ||
| B 235 | Megalochoerus marymuunguae | -10.5 | -10.8 | -11.1 | -12 | 0 | -0.3 | ||
| WS 12590 | Megalochoerus marymuunguae | -10.3 | -10.6 | -10.8 | -11.8 | 1.7 | 1.4 | ||
| WS 12594 | Megalochoerus marymuunguae | -9.6 | -9.9 | -10.1 | -11.1 | 0.8 | 0.5 | ||
| WS 12656 | Megalochoerus marymuunguae | -10.4 | -10.7 | -10.9 | -11.9 | -0.8 | -1 | ||
| Sanitheriidae | |||||||||
| WS 12591 | Diamantohyus africanus | -8.8 | -9.1 | -9.3 | -10.4 | -2 | -2.2 | ||
| WS 12592 | Diamantohyus africanus | -9.9 | -10.1 | -10.4 | -11.4 | -2.6 | -2.8 | ||
| WS 12593 | Diamantohyus africanus | -8.5 | -8.9 | -9 | -10.1 | -2.5 | -2.7 | ||
| Tragulidae | |||||||||
| B 406 | Dorcatherium pigotti | -8.9 | -9.2 | -9.4 | -10.5 | -4 | -4.2 | ||
| WS 12803 | Dorcatherium pigotti | -9.1 | -9.4 | -9.6 | -10.6 | -4.3 | -4.5 | ||
| WS 12819 | Dorcatherium pigotti | -9 | -9.3 | -9.5 | -10.6 | 0 | -0.3 | ||
| WS 49492 | Dorcatherium pigotti | -9.6 | -9.9 | -10.2 | -11.2 | -1.9 | -2.1 | ||
| WS 49508* | Dorcatherium pigotti | -9.7 | -9.9 | 0.2 | -10.2 | -11.2 | -2.7 | -3 | 0.3 |
| Giraffidae | |||||||||
| B 066 | Canthumeryx sirtensis | -8.5 | -8.8 | -9 | -10.1 | 3 | 2.7 | ||
| B 082 | Canthumeryx sirtensis | -9.5 | -9.8 | -10 | -11.1 | 2.8 | 2.5 | ||
| B 487 | Canthumeryx sirtensis | -10.7 | -10.9 | -11.2 | -12.2 | 1.6 | 1.3 | ||
| WS 12840 | Canthumeryx sirtensis | -9.3 | -9.6 | -9.8 | -10.8 | 3.8 | 3.5 | ||
| WS 49486 | Canthumeryx sirtensis | -11.6 | -11.8 | -12.1 | -13 | -0.3 | -0.6 | ||
| WS 49502 | Canthumeryx sirtensis | -10.2 | -10.4 | -10.7 | -11.7 | 2.2 | 1.9 | ||
| Perissodactyla | |||||||||
| Rhinocerotidae | |||||||||
| B 102 | Brachypotherium minor | -10.4 | -10.7 | -10.9 | -11.9 | -1.4 | -1.6 | ||
| B 266* | Brachypotherium minor | -10.1 | -10.4 | 0.3 | -10.6 | -11.6 | -0.1 | -0.3 | 0.2 |
| B 280 | Brachypotherium minor | -10.2 | -10.5 | -10.8 | -11.8 | 0.1 | -0.1 | ||
| B 494 | Brachypotherium minor | -10.6 | -10.8 | -11.1 | -12.1 | -2.2 | -2.4 | ||
| WS 136 | Brachypotherium minor | -11.5 | -11.8 | -12.1 | -13 | -3.4 | -3.6 | ||
| WS 15 | Brachypotherium minor | -10.3 | -10.6 | -10.8 | -11.8 | 0.5 | 0.2 | ||
| WS 31253* | Brachypotherium minor | -10.8 | -10.9 | 0.1 | -11.3 | -12.2 | -0.9 | -1.2 | 0.3 |
| B 388 | Rhinocerotidae sp. | -11.8 | -12 | -12.3 | -13.3 | -2.2 | -2.5 | ||
| B 441 | Rhinocerotidae sp. | -10 | -10.3 | -10.6 | -11.6 | -1 | -1.3 | ||
| WS 12843 | Rhinocerotidae sp. | -10 | -10.3 | -10.6 | -11.6 | -0.4 | -0.6 | ||
| Hyracoidea | |||||||||
| Titanohyracidae | |||||||||
| WS 12795 | Afrohyrax championi | -10.1 | -10.4 | -10.6 | -11.6 | 0.2 | -0.1 | ||
| WS 22 | Afrohyrax championi | -10 | -10.3 | -10.5 | -11.5 | 1.9 | 1.6 | ||
| Proboscidea | |||||||||
| Deinotheriidae | |||||||||
| B 273* | Prodeinotherium hobleyi | -9.9 | -10.5 | 0.6 | -10.5 | -11.8 | 0.1 | -0.2 | 0.1 |
| B 380 | Prodeinotherium hobleyi | -9.9 | -10.2 | -10.4 | -11.4 | -1.6 | -1.8 | ||
| B052* | Prodeinotherium hobleyi | -10.8 | -11.1 | 0.3 | -11.3 | -12.4 | -0.6 | -0.9 | 0.3 |
| WS 12665* | Prodeinotherium hobleyi | -10.5 | -10.7 | 0.2 | -11 | -12 | -2.2 | -2.4 | 0.2 |
| WS 128D* | Prodeinotherium hobleyi | -11.1 | -11.4 | 0.3 | -11.6 | -12.6 | -0.9 | -1.2 | 0.3 |
| WS 131 | Prodeinotherium hobleyi | -10.8 | -11 | -11.3 | -12.3 | -1.8 | -2.1 | ||
| WS 17 | Prodeinotherium hobleyi | -9.1 | -9.4 | -9.6 | -10.6 | -5.8 | -6 | ||
| WS 30725 | Prodeinotherium hobleyi | -10.3 | -10.6 | -10.8 | -11.8 | -0.4 | -0.6 | ||
| WS 30727 | Prodeinotherium hobleyi | -11.3 | -11.5 | -11.8 | -12.7 | -6.2 | -6.4 | ||
| WS 30728 | Prodeinotherium hobleyi | -8.9 | -9.3 | -9.5 | -10.5 | -5.1 | -5.3 | ||
| WS 4 | Prodeinotherium hobleyi | -10.6 | -10.9 | -11.1 | -12.1 | -3.6 | -3.8 | ||
| WS 45* | Prodeinotherium hobleyi | -10.1 | -10.5 | 0.4 | -10.7 | -11.7 | -2.8 | -3 | 0.2 |
| WS 46 | Prodeinotherium hobleyi | -9.9 | -10.2 | -10.4 | -11.4 | -0.2 | -0.5 | ||
| WS 47 | Prodeinotherium hobleyi | -9.7 | -10 | -10.3 | -11.3 | -6 | -6.2 | ||
| WS 50 | Prodeinotherium hobleyi | -9.4 | -10 | -10 | -11.2 | -1.8 | -2 | ||
| WS 52 | Prodeinotherium hobleyi | -9.4 | -9.7 | -9.9 | -10.9 | -4.2 | -4.5 | ||
| WS 57 | Prodeinotherium hobleyi | -9.5 | -9.6 | -10 | -10.9 | -1.4 | -1.7 | ||
| WS 58 | Prodeinotherium hobleyi | -10.6 | -10.9 | -11.1 | -12.1 | -3.6 | -3.8 | ||
| WS 63 | Prodeinotherium hobleyi | -10.3 | -10.6 | -10.9 | -11.9 | -3.3 | -3.5 | ||
| Mammutidae | |||||||||
| B 359 | Zygolophodon sp. nov. | -8.7 | -9 | -9.2 | -10.2 | -3 | -3.2 | ||
| Gomphotheriidae | |||||||||
| B 271 | Archaeobelodon sp. nov. | -8.9 | -9.3 | -9.5 | -10.5 | -2.6 | -2.8 | ||
| B 325 | Archaeobelodon sp. nov. | -9.3 | -9.6 | -9.9 | -10.9 | -2.3 | -2.6 | ||
| B 002-2008* | Protanancus sp. nov. | -8.9 | -9.2 | 0.3 | -9.4 | -10.5 | -1 | -1.3 | 0.3 |
| B 452* | Afrochoerodon kisumuensis | -8.4 | -8.7 | 0.3 | -8.9 | -9.9 | -1.8 | -2.1 | 0.3 |
| Family indet | |||||||||
| B 244 | Elephantimorph indet. | -8.7 | -9.1 | -9.3 | -10.3 | -3 | -3.2 | ||
| B 267 | Elephantimorph indet. | -8.9 | -9.3 | -9.5 | -10.5 | -4.2 | -4.4 | ||
| B 268 | Elephantimorph indet. | -8.5 | -8.9 | -9.1 | -10.1 | -4.9 | -5.1 | ||
| WS 70* | Elephantimorph indet. | -9.2 | -9.5 | 0.3 | -9.7 | -10.7 | -2.1 | -2.3 | 0.2 |
| WS 73 | Elephantimorph indet. | -9 | -9.3 | -9.5 | -10.5 | -5.5 | -5.7 | ||
| WS 74 | Elephantimorph indet. | -9.2 | -9.5 | -9.7 | -10.8 | -6.2 | -6.4 | ||
| WS 77 | Elephantimorph indet. | -8.5 | -8.9 | -9.1 | -10.1 | -4.8 | -5 | ||
| WS 88 | Elephantimorph indet. | -9.2 | -9.6 | -9.8 | -10.8 | -4.9 | -5.1 | ||
| Mean difference between treated/untreated | 0.3 | 0.2 |
1 Using the high-resolution benthic estimates from Tipple et al., (2010), the mean δ13Catm value for an age of 15.9-16.3 Ma is -5.06‰. Therefore, -1.24‰ was added to treated δ13Cenamel values for correction to δ13C1750 values.
Columns labelled “ẟ13Cenamel Untreated” and “ẟ18Oenamel Untreated” refer to the carbon and oxygen isotopic values of untreated enamel, respectively. The columns labeled “ẟ13 C enamel Treated” and “ẟ18 Oenamel Treated” refer to isotopic values after pretreatment and those generated for treatment using the regression equations in Appendix 1. Bolded and italicized values in this column indicate calculated treated ẟ13 Cenamel values. The columns labeled “δ13Cenamel Untreated v. treated difference” and “δ18Oenamel Untreated v. treated difference” refer to the absolute value of the difference between untreated and analyzed treated isotopic values. The column labeled “ẟ13 C1750 _17.2ma” refers to the treated carbon isotopic values that have been corrected from to the reference ẟ13C value of atmospheric CO2 of 6.3‰ using at date of 17.2 Ma. The column labeled “ẟ13C1750 _16ma1 refers to the treated carbon isotopic values that have been corrected from to the reference ẟ13 C value of atmospheric CO2 of 6.3‰ using at date of 16 Ma.
*Indicates enamel samples for which both untreated and treated powder samples were isotopically analyzed using the procedure described in the Methods section of the main text.
APPENDIX 3.
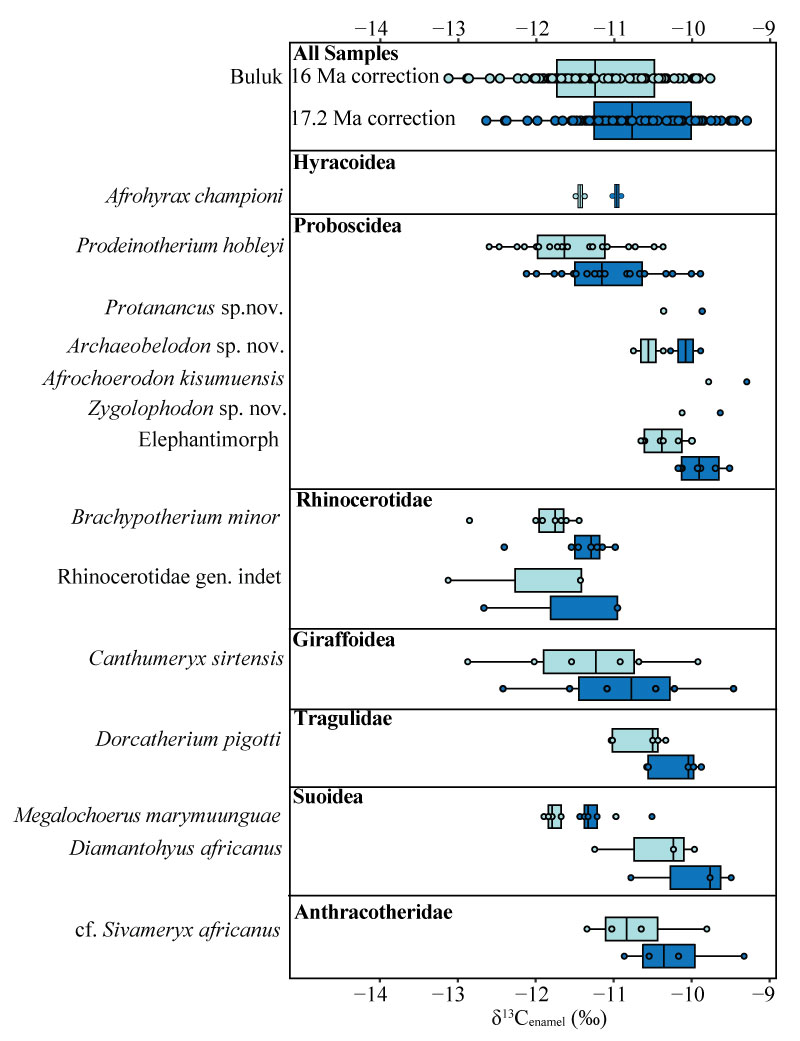
δ13Cenamel value boxplots for Buluk, Maboko, and Fort Ternan displaying Buluk δ13C1750 values corrected using a date of 17.2 Ma (light blue) and the terminal early Miocene date of 16 Ma (dark blue).
APPENDIX 4.
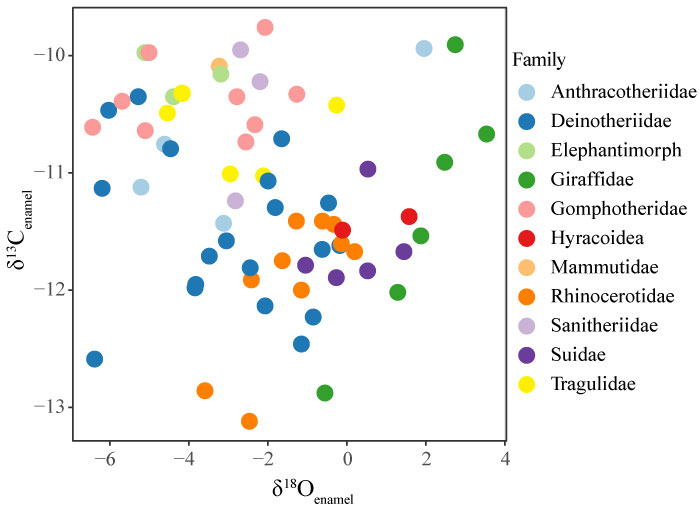
Bivariate plots of ẟ13C versus ẟ18O values for each taxonomic family sampled: Anthracotheriidae, Deinotheriidae, Gomphotheriidae, Mammutidae, Hyracoidea, Rhinocerotidae, Sanitheriidae, Suidae, Giraffidae, and Tragulidae. Gomphotheres, hyraxes, and rhinocerotids show no correlation or a slight positive correlation. Most mammalian families show a positive or no correlation between carbon and oxygen isotope values.
APPENDIX 5.
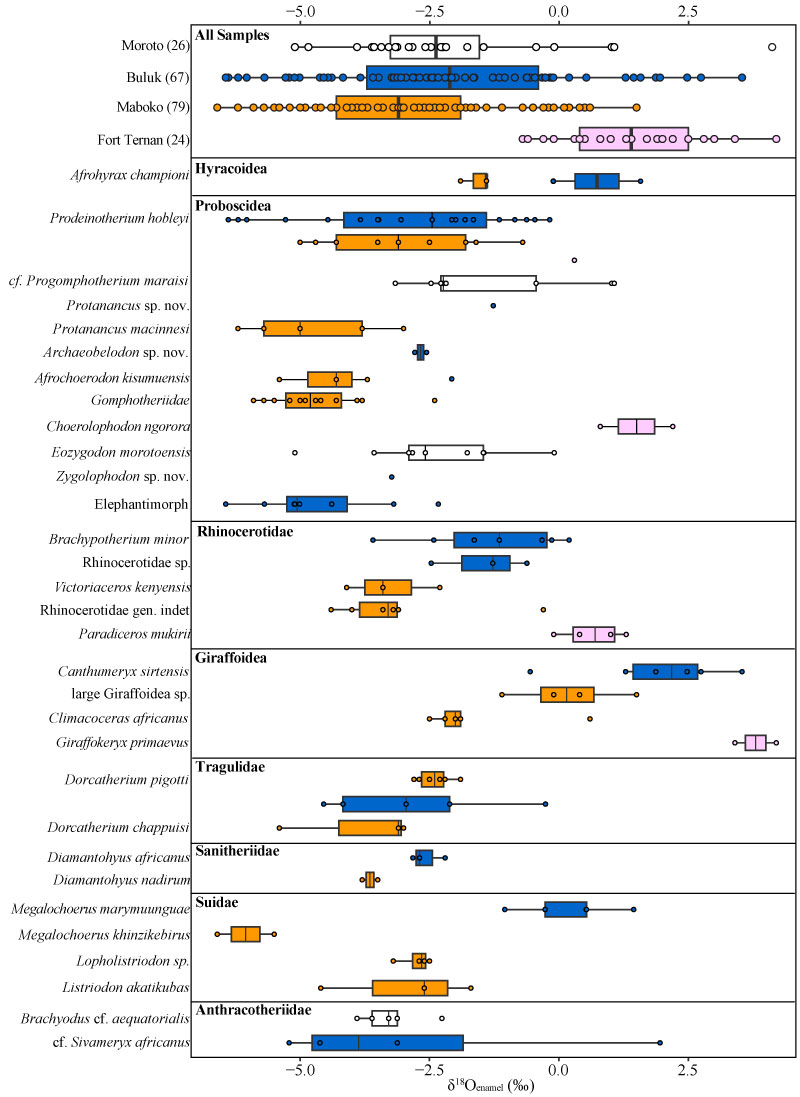
18 Oenamel value boxplots for Buluk, Moroto, Maboko, and Fort Ternan. Herbivore δ18Oenamel values for Fort Ternan are from Cerling et al., (1997), δ18Oenamel values for Maboko herbivores were taken from Arney et al. (2022), and δ18 Oenamel values for Moroto are extracted from MacLatchy et al., 2023. The top panel of δ18Oenamel values labeled “All Samples” compares boxplots of all herbivore δ18Oenamel values from each locality. Bottom panels compare δ18Oenamel values of taxonomic families between sites.