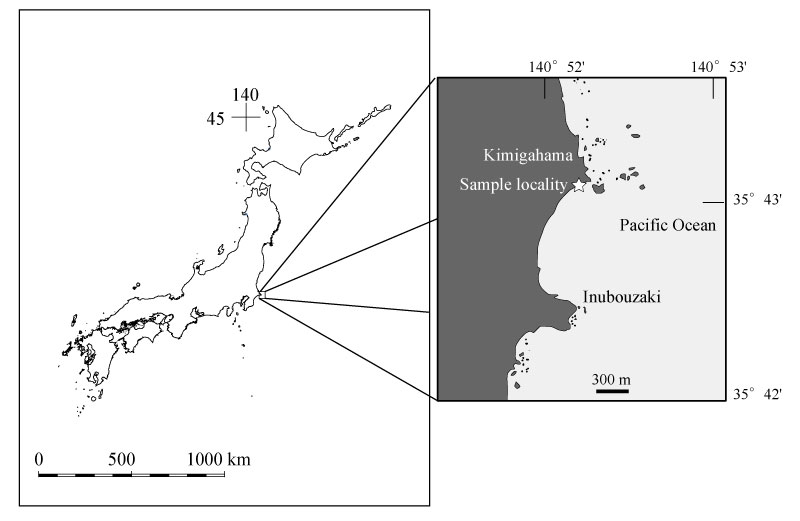
FIGURE 1. Map showing tha locality of the Choshi area, Chiba Prefecture, Japan. The star marks the fossil locality.

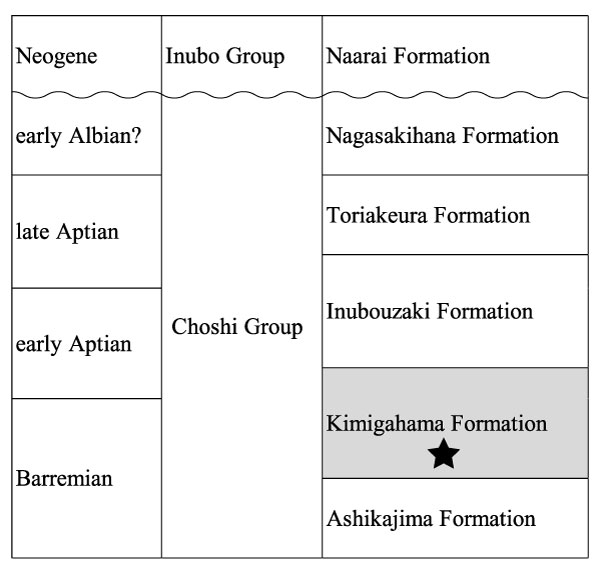
FIGURE 2. Stratigraphic divisions of the Choshi Group (modified from Obata and Matsukawa, 2007, 2009a, b). The star marks the fossil-bearing horizon.

FIGURE 3. Otoliths from the Kimigahama Formation (Barremian) in Chiba Prefecture, Japan. 3A-B: Teleostei fam., gen. et sp. indet. A. CBM (Natural History Museum and Institute, Chiba)–PV 8203. A1) Dorsal view. A2) Line drawing of A1. A3) Inside view. A4) Line drawing of A3. B. CBM–PV 8204. B1) Dorsal view. B2) Inside view. C-E: Pterothrissinae gen. et sp. indet. C. CBM–PV 8205. C1) Dorsal view. C2) Line drawing of C1. C3) Inside view. C4) Line drawing of C3. D. CBM–PV 8324. D1) Dorsal view. D2 Inside view. E. CBM–PV 8325. E1) Dorsal view. E2) Inside view. Scale bar = 1 mm.

FIGURE 4. Otoliths from the Kimigahama Formation (Barremian) in Chiba Prefecture, Japan. A-C: Elopiformes fam., gen. et sp. indet. A. CBM–PV 8206. A1) Dorsal view. A2) Line drawing of A1. A3) Inside view. A4) Line drawing of A3. B. CBM–PV 8326 B1) Dorsal view. B2) Inside view. C. CBM–PV 8327. C1) Dorsal view. C2) Inside view. D-F: Argentinidae gen. et sp. indet. D. CBM–PV 8207. D1) Dorsal view. D2) Line drawing of D1. D3) Inside view. D4) Line drawing of D3. E. CBM–PV 8328. E1) Dorsal view. E2) Inside view. F. CBM–PV 8329. F1) Dorsal view. F2) Inside view. G. Ichthyotringidae fam, gen. et sp. indet. G. CBM–PV 8208. G1) Dorsal view. G2) Line drawing of G1. G3) Inside view. G4) Line drawing of G3. Scale bar = 1 mm.

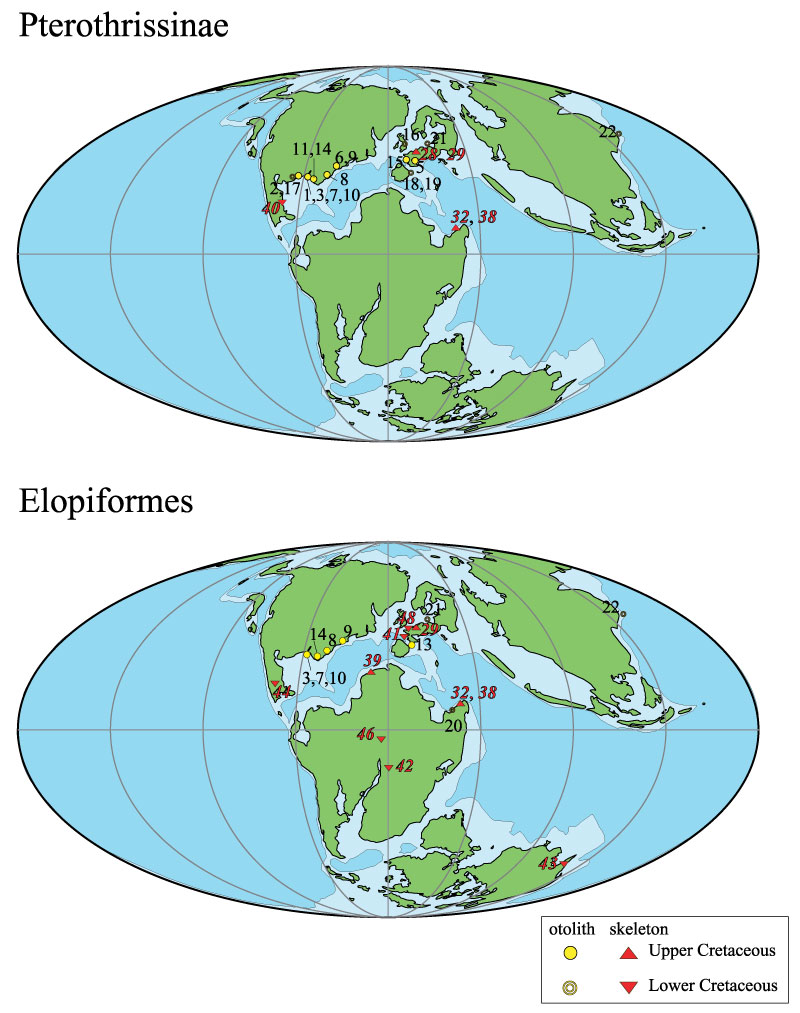
FIGURE 5. Cretaceous paleobiogeography of Pterothrissinae and Elopiformes. The number of localities corresponds to the number in Table 3. The reference map is Barremian (modified from Scotese, 2014). The number in regular font indicates the otolith-based fossil record, and italics in bold indicate the skeleton-based fossil record. Table 3 shows the details of each fossil record.

FIGURE 6. Cretaceous paleobiogeography of Argentinidae and Ichthyotringoidei. Abbreviations and reference map are as in Figure 5.


