FIGURE 1. Stratigraphic range of the species belonging to the analyzed lineages, their paleogeographic distribution (squares with gray background), and some examples of lower mandibles in labial view. IVPP V20801: Pliocrocuta perrieri from Zanclean (Zanda Basin, China), drawn from Tseng et al. (2016). KK 82-58: Parahyaena howelli (Laetoli, Tanzania), drawn from Werdelin and Dehghani (2011). MNHN 834: Pliocrocuta perrieri post-Zanclean (holotype from Mont Perrier, Muséum national d’histoire naturelle, Paris. C/C. 806: Pachycrocuta brevirostris (Zhoukoudian, China) drawn from Pei (1934). KA 55: Pachycrocuta bellax (Kromdraai A, South Africa) drawn from Ewer (1954a). ‘Hyaena’ prisca (holotype from Lunel-Viel, France) drawn from Brugal et al. (2021). NHM 35.9.1.286: Parahyaena brunnea (Karroo Valley, South Africa, housed at the Natural History Museum, London).
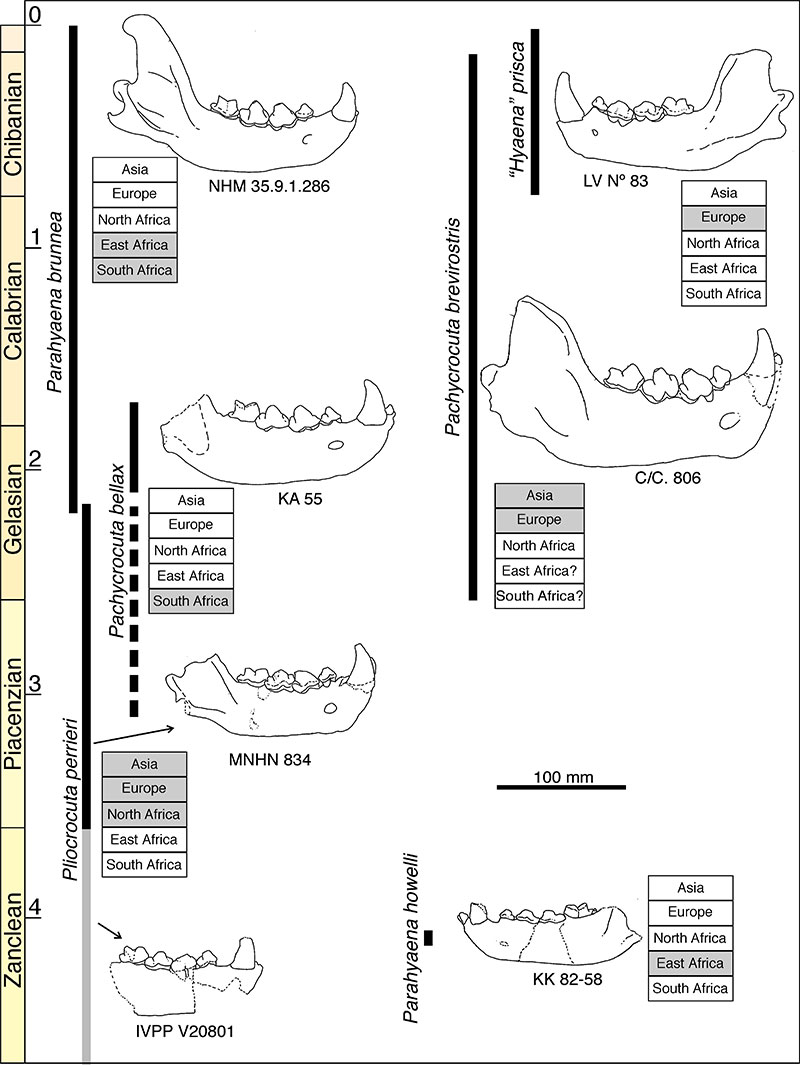
FIGURE 2. Several examples of worn lower first molars. A, V 7296 from Baihaicum (from Qiu, 1987). B, Pliocrocuta perrieri (Se 312, Senèze, France). C, Crocuta crocuta (no id. Naturkundemuseum Berlin). D, plot of m1 trigonid length on m1 width for the species analyzed in this study. Note that there is a clear separation between Crocuta and Non Crocuta species. Additional explanations have been provided in the text.
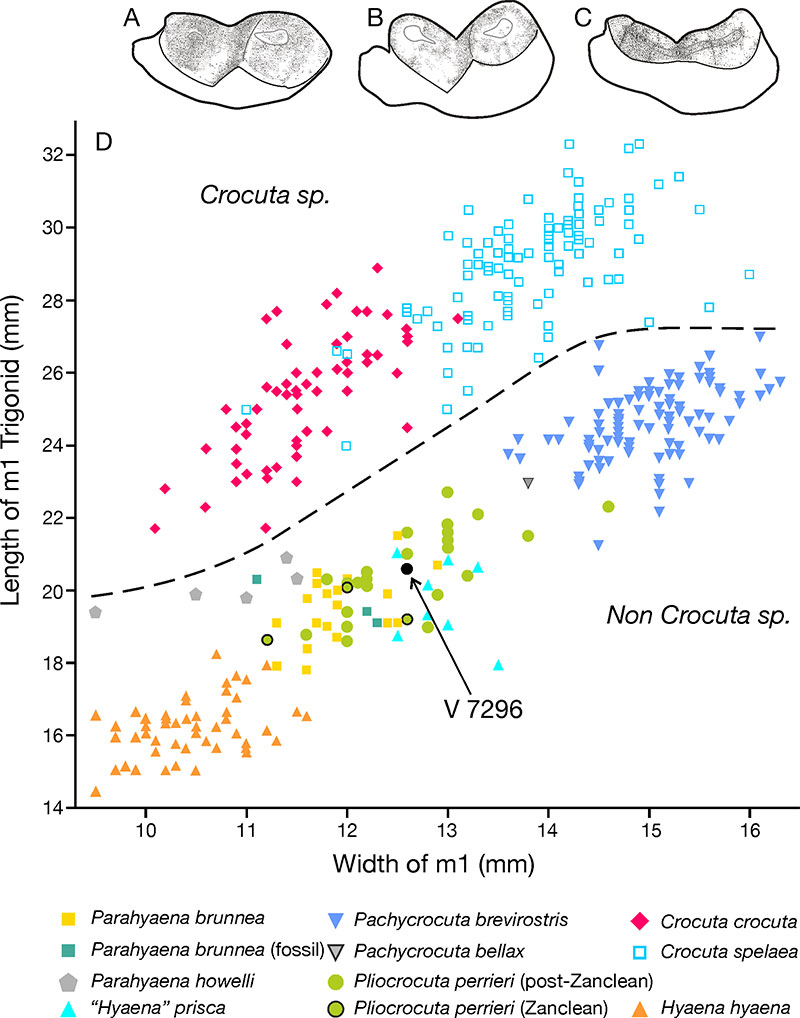
FIGURE 3. Bivariate plots of the scores on the lower dentition two first principal components and their corresponding component loading plots for (A) analysis for fossil individuals and (B) analysis for paleontological localities. Ba: Baihaicum. E: Elandsfontein. L: Longdan.
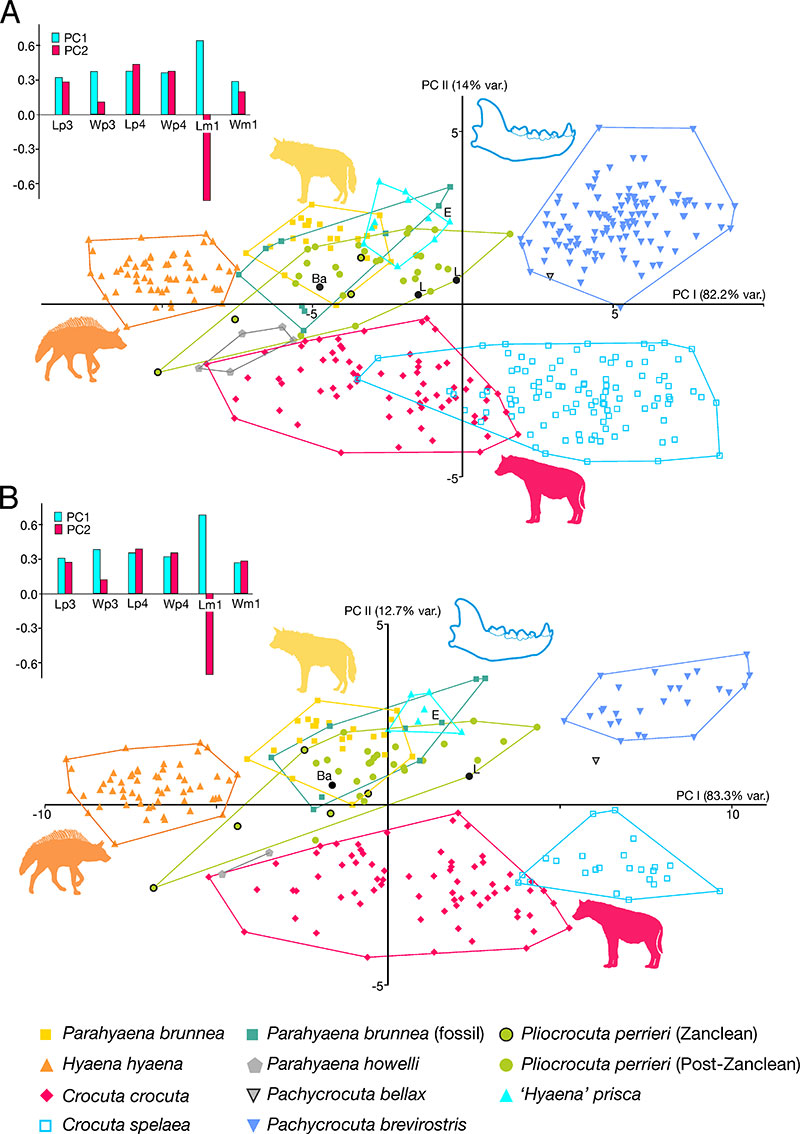
FIGURE 4. Bivariate plots of the scores on the upper dentition two first principal components and their corresponding component loading plots for (A) analysis for fossil individuals and (B) analysis for paleontological localities. E: Elandsfontein. G: Gladysvale Cave. K: Kromdraai A. L: Longdan. S: Ségriès-le Réservoir.
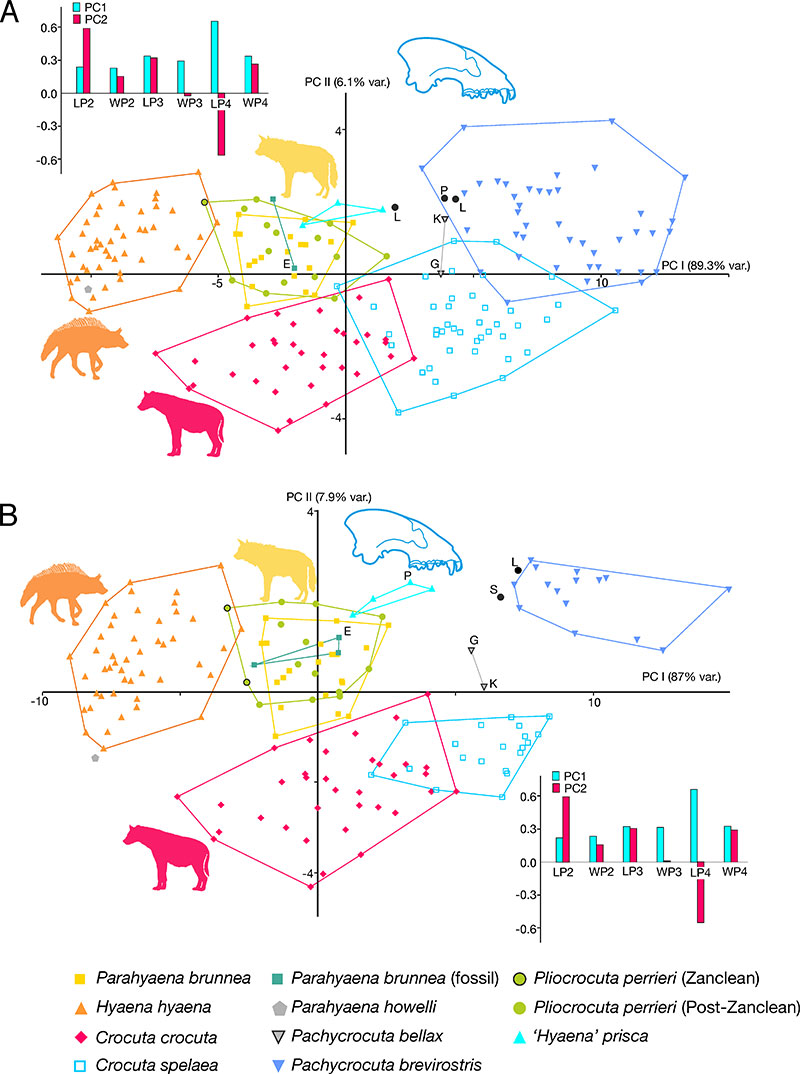
FIGURE 5. Bivariate plots of geological age on the scores for the lower dentition two first principal components. A-B, PC I for fossil individuals and paleontological localities, respectively. C-D, PC II for fossil individuals and paleontological localities, respectively. E: Elandsfontein. At the base of each figure are shown the ranges for the extant species and C. spelaea in each principal component.
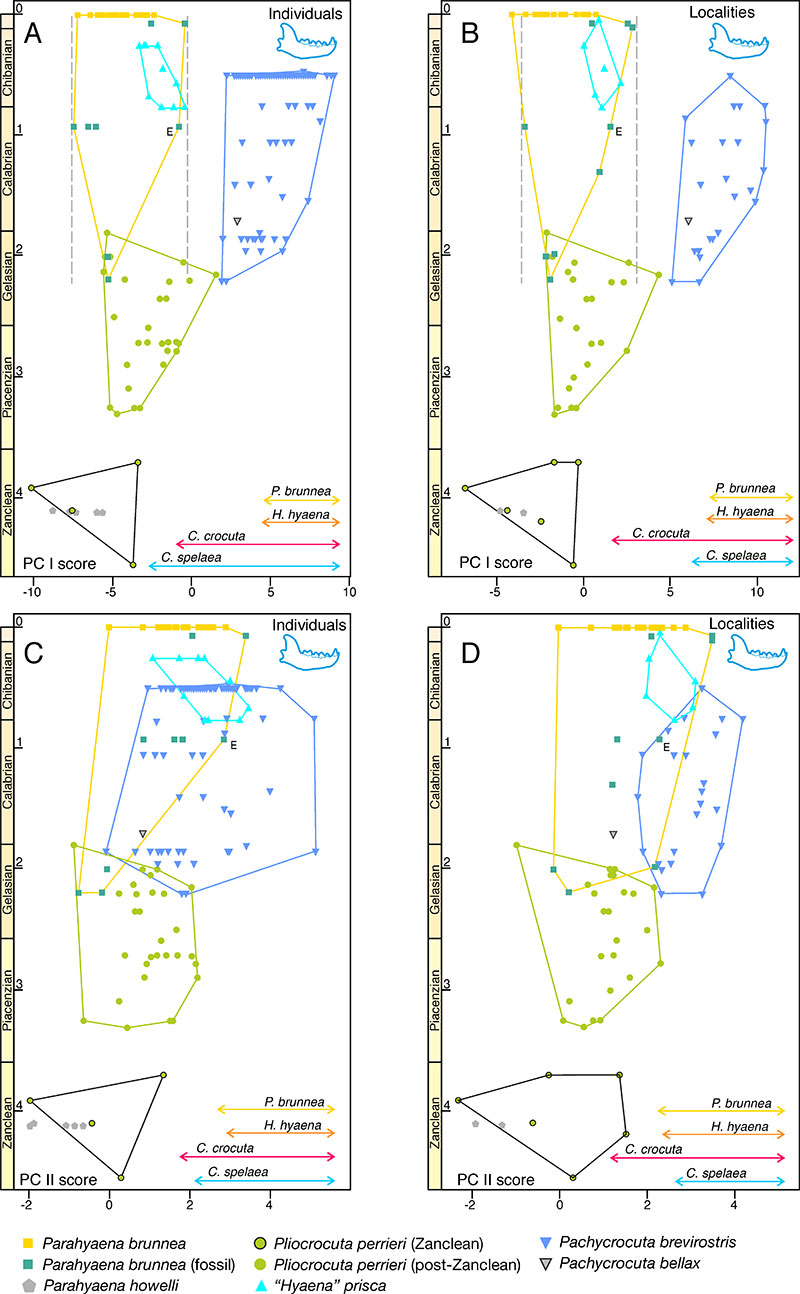
FIGURE 6. Bivariate plots of geological age on the scores for the first two principal components of the upper dentition (A) and (B) PC I for fossil individuals and paleontological localities, respectively. C-D, PC II for fossil individuals and paleontological localities, respectively. E: Elandsfontein. G: Gladysvale Cave. K: Kromdraai A. L: Longdan. P: Petralona (circle: PEC 18, triangle: mean for Petralona). S: Ségriès-le Réservoir. At the base of each figure are shown the ranges for the extant species and C. spelaea in each principal component.
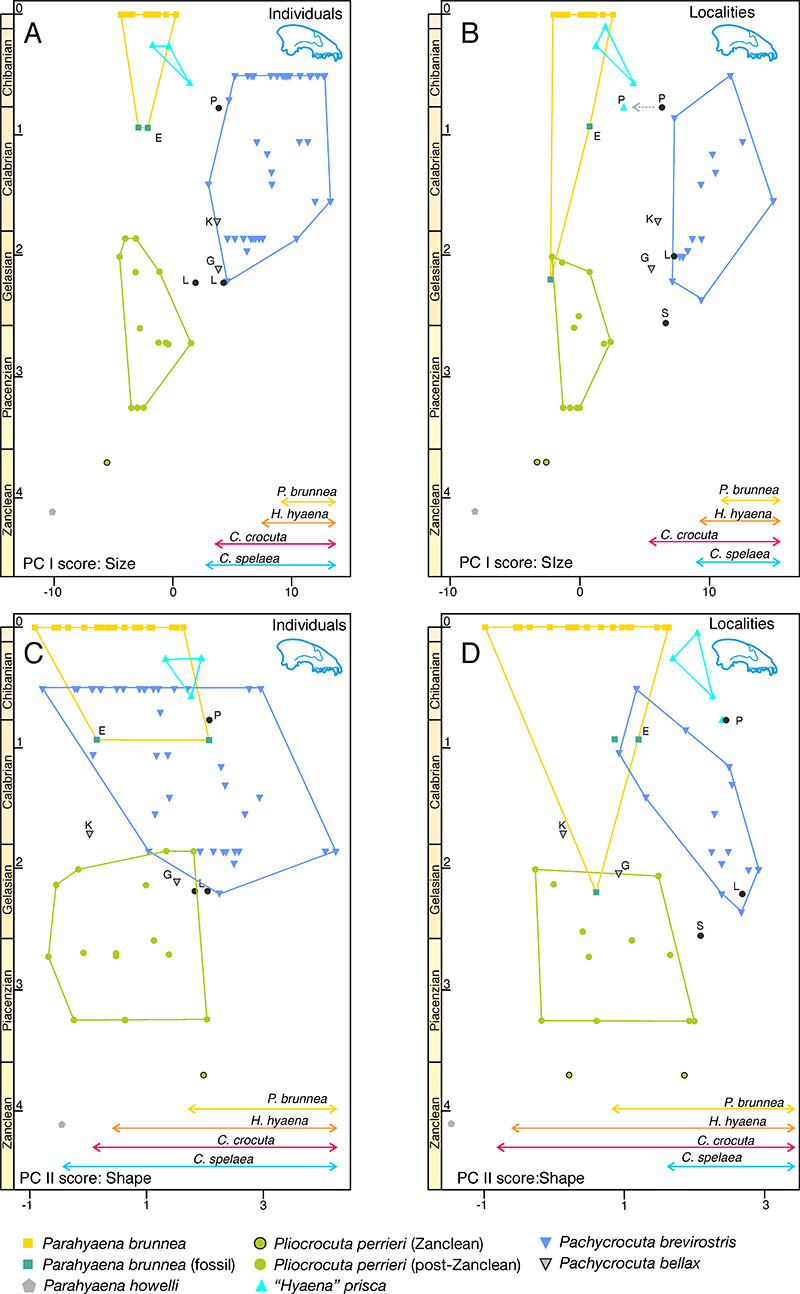
FIGURE 7. In A is shown a lateral view of an articulated skull and jaw of a H. hyaena specimen (EBD 33079M, Doñana Biological Station, Seville) and its corresponding schematic drawing in B, showing different functional regions of the dentition during the mandibular occlusion process. The main regions involved in cutting meat are the trigonid (Trig) of m1 in the lower dentition and the metastyle (Me) and the distal part of Paracone (P) of the upper fourth premolar (P4). The main elements involved in bone breaking are the two lower premolars (p4 and p3) that occlude with the upper third premolar (P3) and the mesial part of the paracone and the parastyle of the upper P4.
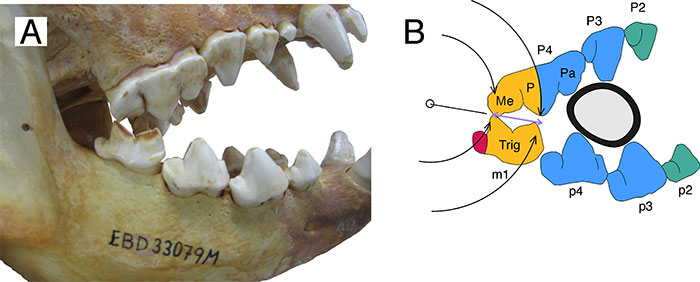
FIGURE 8. Relative size of the bone-breaking region of P4 versus the size of P4 for some localities of P. brevirostris. The correlation coefficient between both variables is significant (r = 0.844, p = 0.002). The ellipse corresponds to the expected region for the population at 95% confidence. Gi: Gigantopithecus Cave, Ke: Kedung Brubus, Lo: Longdan, LC: Longgu Cave, Re: Renzi Cave, Sa: Sainzelles, Um: Untermasfeld, Va: Val d'Arno, VM: Venta Micena, Yu: Yuanmou, Zo: Loc.1 of Zhoukoudian.
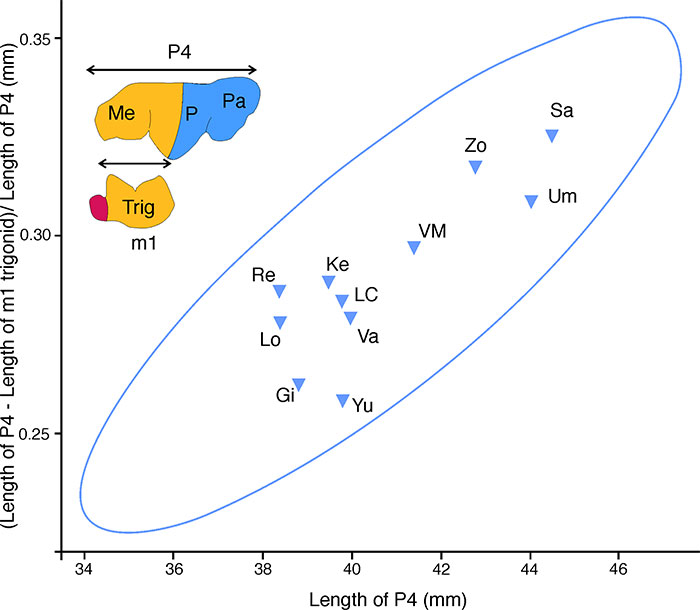
FIGURE 9. Illustration of the two criteria used in this study as a practical guide to separate segments within a lineage. Successive values of a lineage with four populations and four fossils per population are shown. At the top, the range of variation observed for the variable considered in a related present-day biospecies. Taking the lowest value of the first population as an arbitrary reference point, the lineage will be divided into two segments for that time value at which the observed range for the biospecies is surpassed, and at the same time, the difference between the means of the two sets (C and C', respectively) becomes significant.
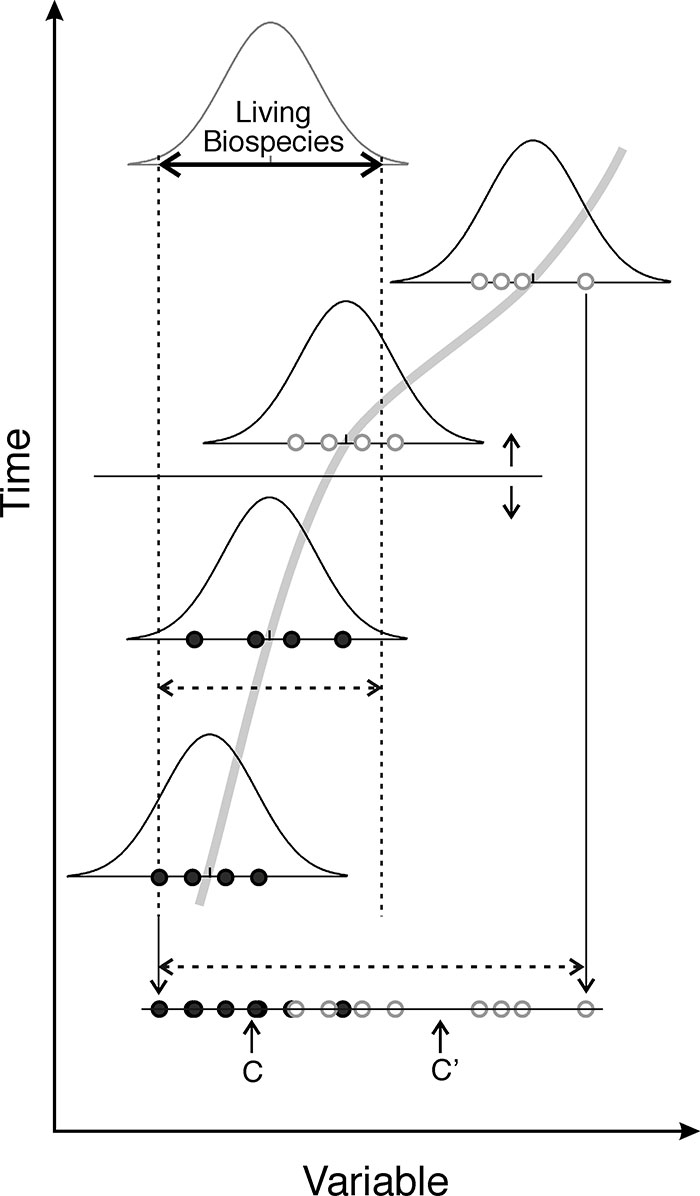
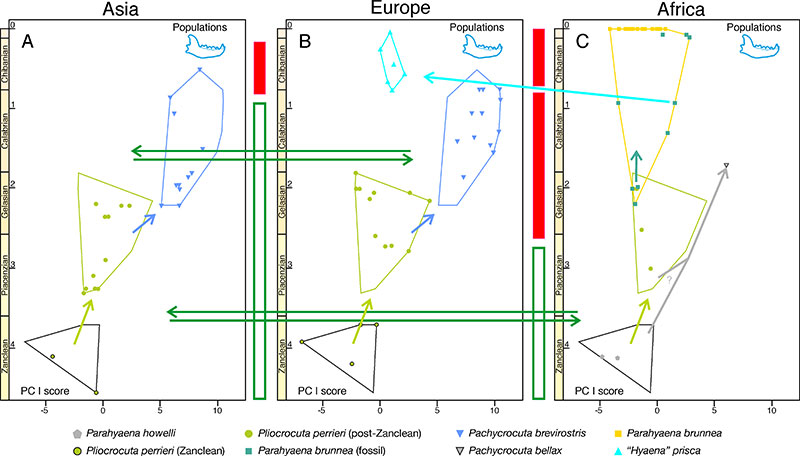
FIGURE 10. Evolutionary and paleobiogeographic hypotheses proposed in this work illustrated with the plot of the first principal component for the lower dentition. Double horizontal lines indicate bidirectional migratory flows. Empty rectangles indicate the absence of barriers to dispersal between the last three regions considered, and solid rectangles indicate geographic isolation. See the text for a more detailed explanation.