FIGURE 1. Map indicating the location of Nilpena Ediacara National Park (NENP) (A), Flinders Ranges, South Australia, the Pound Subgroup and Rawnsley Quartzite which contains the fossiliferous Ediacara Member (B). A and B modified from Gehling and Droser (2009).
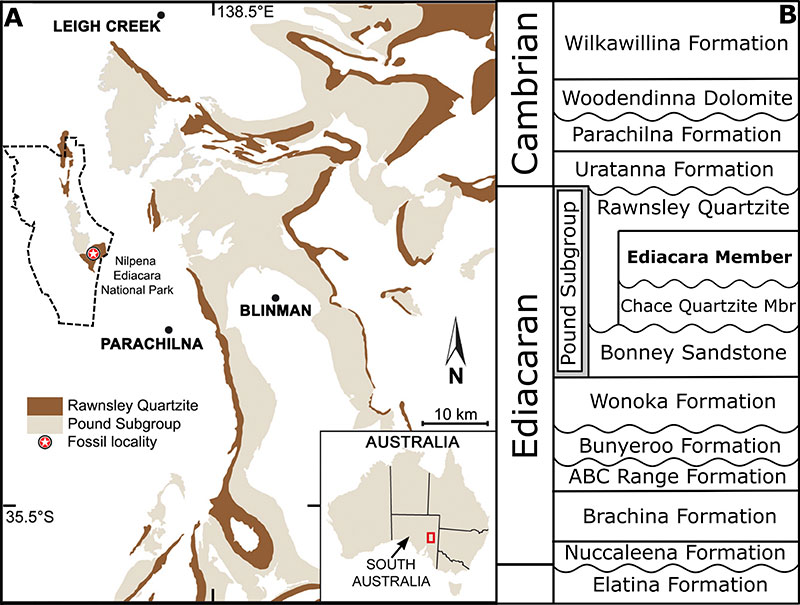
FIGURE 2. Tribrachidium heraldicum (A-E) and T. gehlingi (E-I) from Nilpena Ediacara National Park (NENP), Flinders Ranges, South Australia. A: SAMA P12898 (Holotype), B: WS-TBEW 108S 149E, C: SAMA P12889 (Paratype), D: LV-Eo Bed 264S 173E, E: F34 T. heraldicum (indicated by white arrowhead) and T. gehlingi, F: SAMA P59794 (Holotype), G: SAMA P59796 (Paratype), H: SAMA P59800 (Paratype), I: F18. Scale bars equal 10 mm.
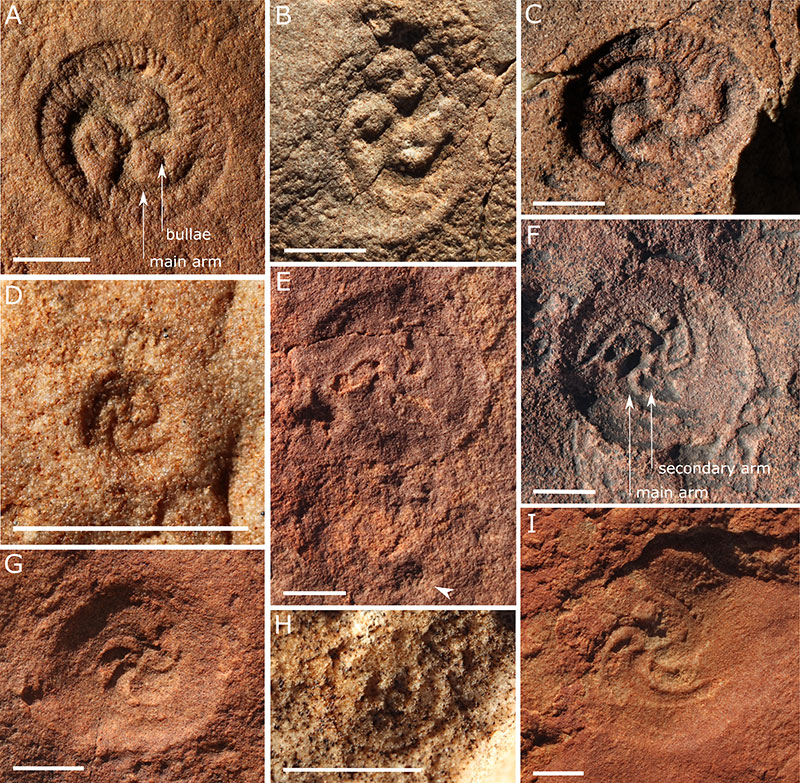
FIGURE 3. Workflow for the shape analysis of the genus Tribrachidium. A: Landmarking plans for T. heraldicum (SAMA P12898), and for direct comparison of T. gehlingi (F43) and T. heraldicum. Red lines indicate how thirds are defined for the outer rim, blue lines highlight the arms, green lines highlight the bulla/secondary arms. B: The three rotated copies, orange lines illustrating how the landmarks were rotated. C: Shape configuration graph for the consensus shape for T. heraldicum.
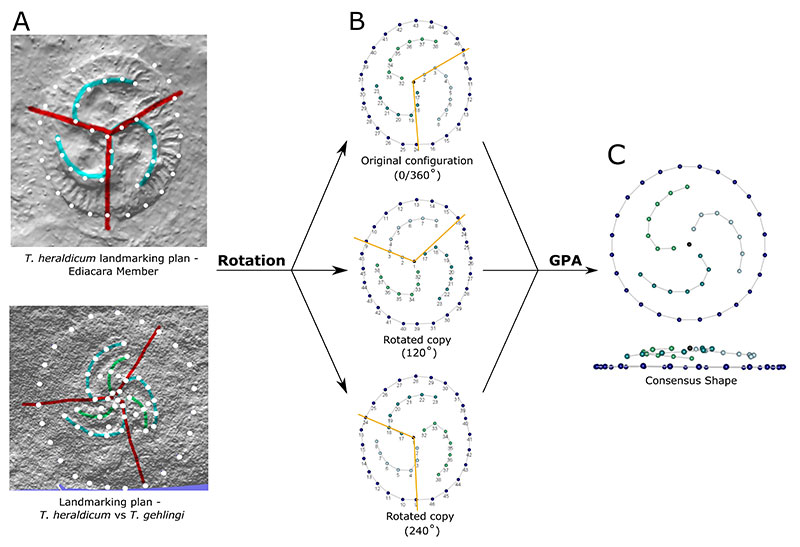
FIGURE 4. Barplot of the principal components that account for ~90% of total shape variation for Tribrachidium heraldicum (A) and T. gehlingi (B). Symmetric components are identified as single PCs (grey), asymmetrical components (orange) are paired PCs (arranged by the proportion of variance they explain). Shape configuration graphs are given for key PCs, the shape of the minimum and maximum scores for the axis. Pie charts visualising the proportion of symmetrical and asymmetrical components. Shape configuration graphs for the consensus shape for T. heraldicum (A) and T. gehlingi (B).
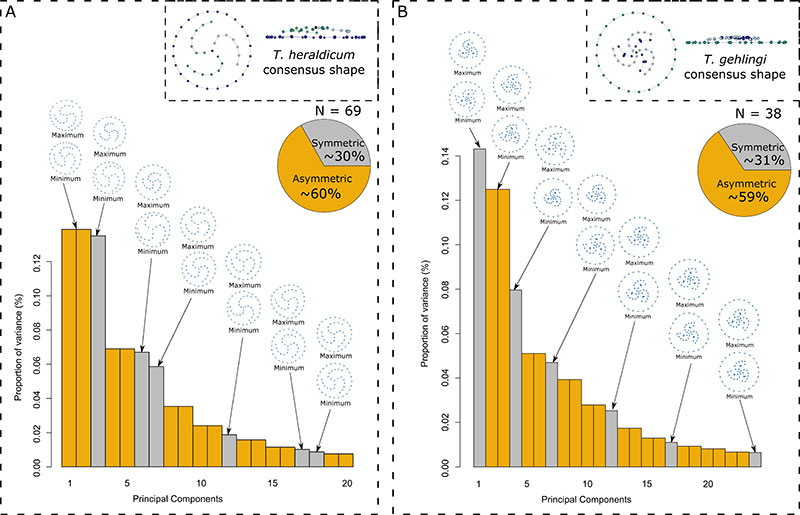
FIGURE 5. Morphospaces of the PC axes for Tribrachidium heraldicum across bedding planes in Nilpena Ediacara National Park (A), T. heraldicum vs T. gehlingi (B), and T. heraldicum Australia vs T. heraldicum Russia vs T. gehlingi (C). Shape configuration graphs are given for the minimum and maximum scores for the axes. Relative size of each specimen is represented by the diameter of each circle. Coloured ellipses represent 95% confidence interval.
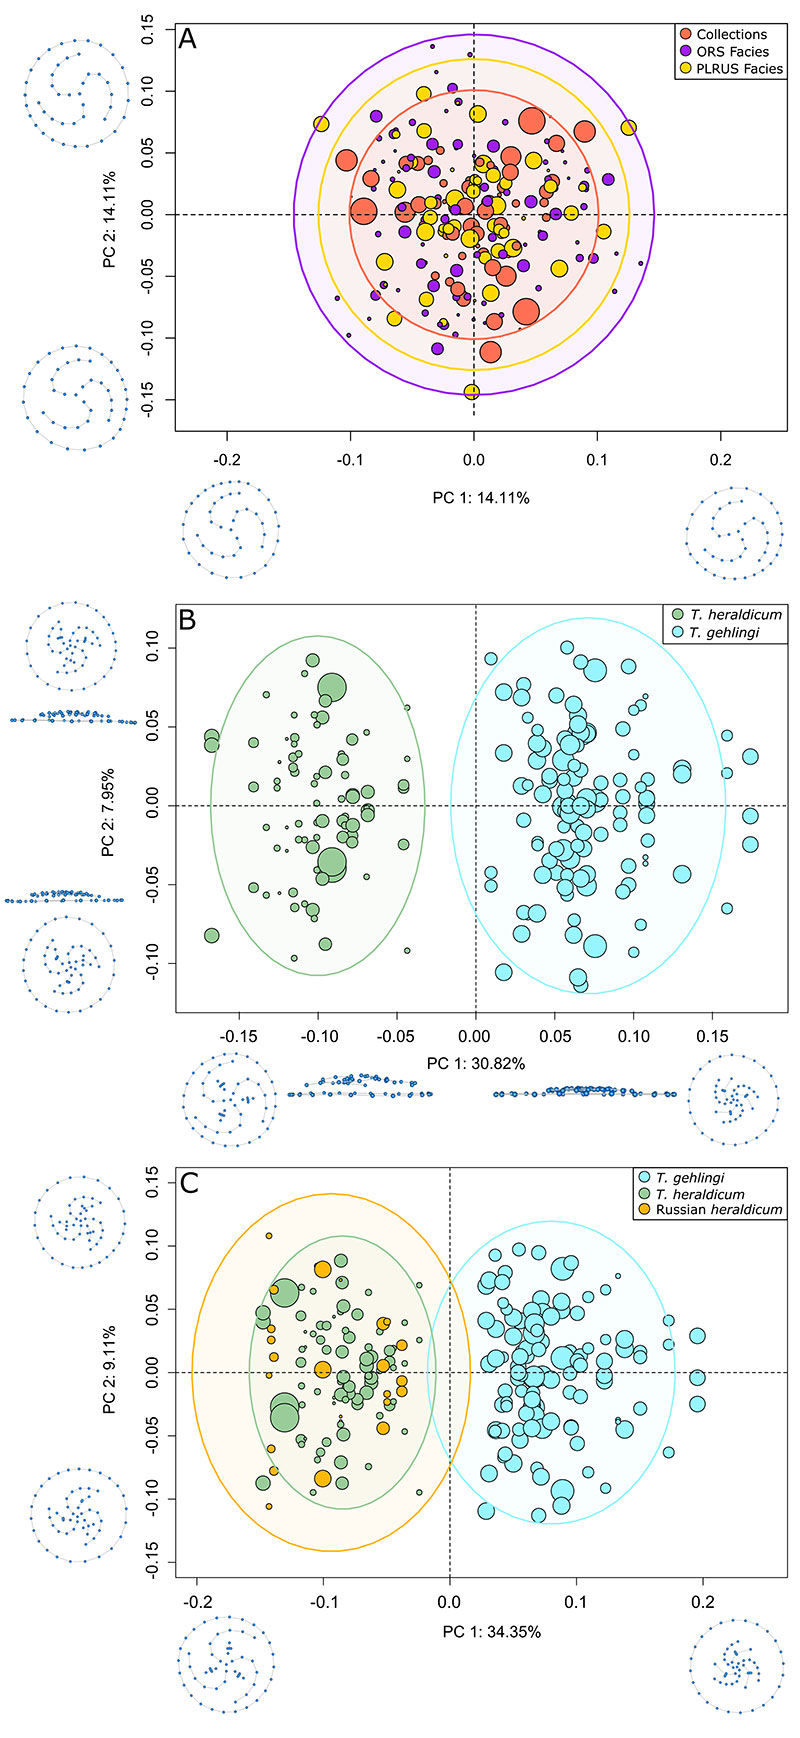
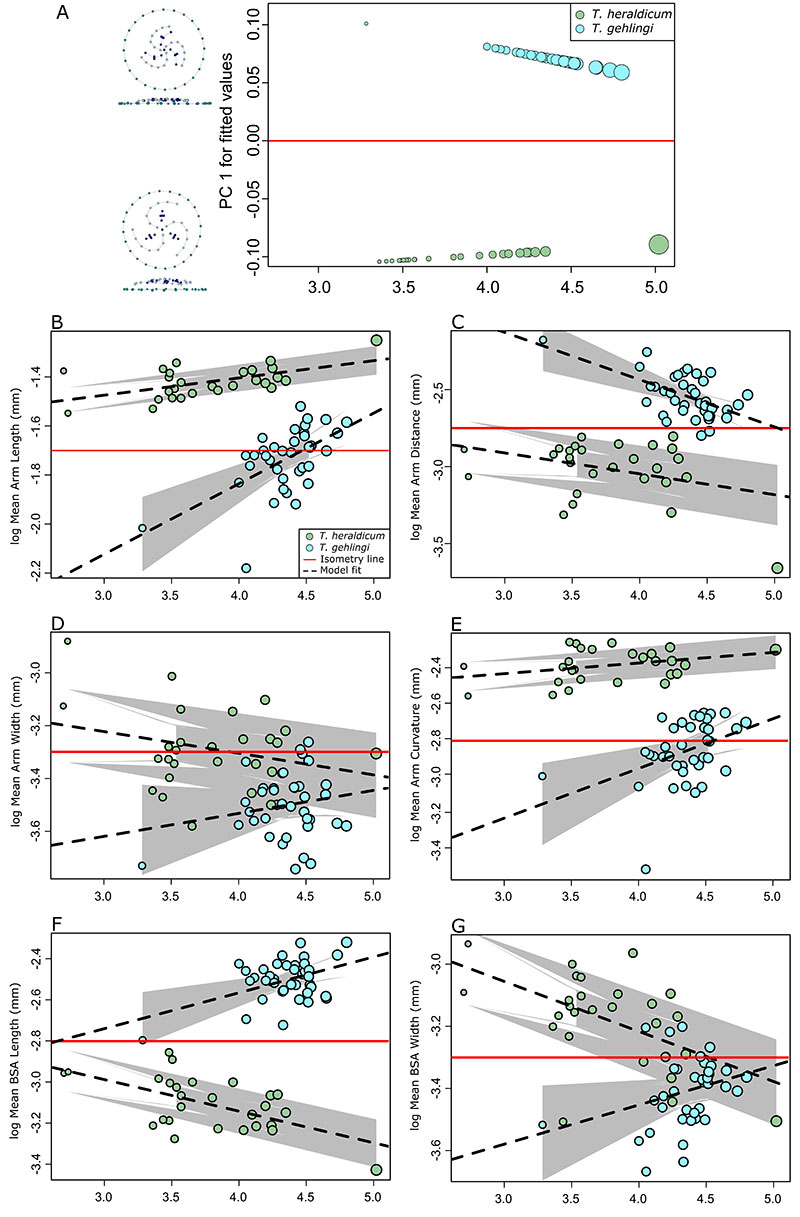
FIGURE 6. Plots investigating shape change with size for Tribrachidium heraldicum and T. gehlingi. The x-axis for all plots represents log Centroid size and red trendlines demonstrating isometry (slope of 0). A: Multivariate regression of landmark dataset, with size of points proportional to size of the specimen. Shape configuration graphs (left) illustrate the shape each species exhibits throughout growth. B-G: Linear ordinary least-squares regressions of both Tribrachidium species. Grey shading illustrates 95% confidence interval of the linear models. B: log mean arm length (mm), C: log mean arm distance (mm), D: log mean arm width (mm), E: log mean arm curvature (mm), F: log mean bulla/secondary arm (BSA) length (mm), G: log mean BSA width (mm).