FIGURE 1. Locations of study sites (as marked by X) across the British Isles (Figure 1A) and in Northern Ireland and the Republic of Ireland (Figure 1B). Land outlines created using MATLAB Mapping Toolbox (The Mathworks Inc., 2021).
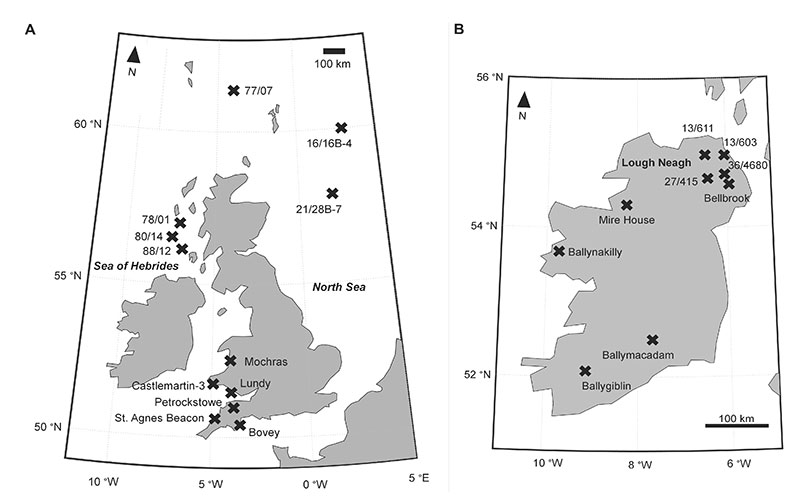
FIGURE 2. Previously assigned ages of selected onshore and offshore Oligocene–Miocene succession from the British Isles, based on King et al. (2016).
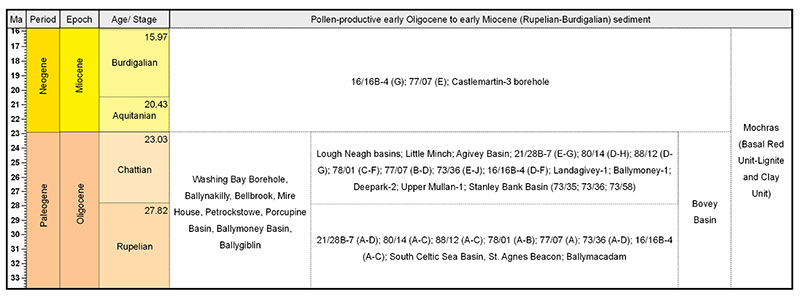
FIGURE 3. Mean Annual Temperature (MAT) reconstructions based on study sites where only one pollen assemblage was available. The red dotted line shows the present-day MAT. Solid black lines show the value of the reconstructed optima. The grey dotted lines and grey solid lines show the respective uncertainty ranges of 50 % and 95 %. Rupelian, Chattian, and Oligocene sites are labelled (R), (C), and (O), respectively.
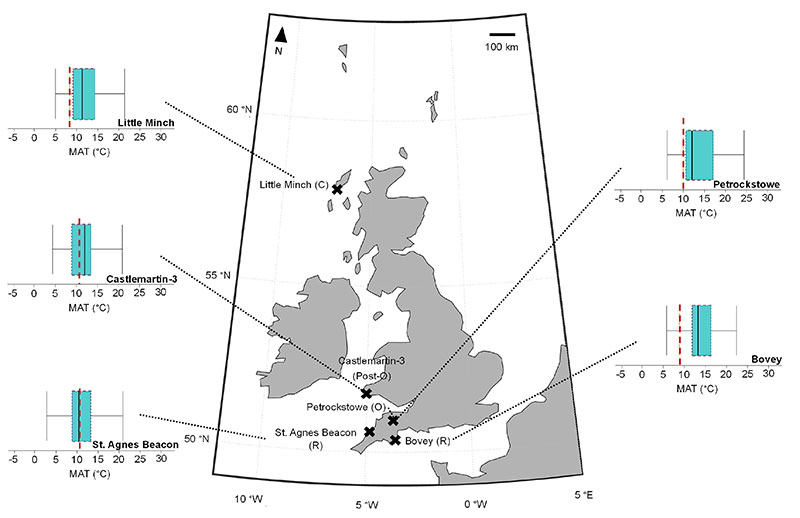
FIGURE 4. Mean Annual Temperature (MAT) reconstructions, based on pollen assemblages from Northern Ireland and the Republic of Ireland. The red dotted line shows the present-day MAT. Solid black lines show the value of the reconstructed optima. The grey dotted lines and grey solid lines show the respective uncertainty ranges of 50 % and 95 %. Rupelian, Chattian and Oligocene sites are labelled (R), (C), and (O), respectively. “B” and “W-28” are abbreviated for “Bellbrook” and “Well-28”, respectively.
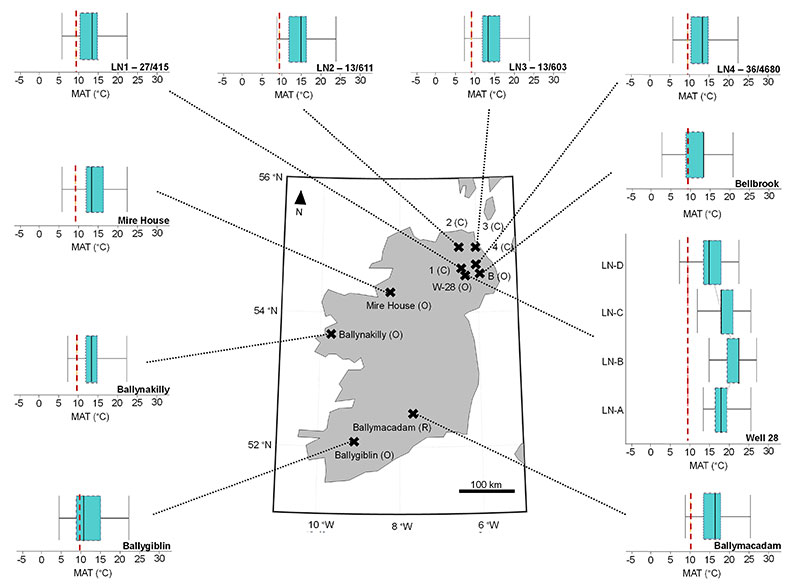
FIGURE 5. Mean Annual Temperature (MAT) reconstructions from the sequential boreholes. The red dotted line shows the present-day MAT. Solid black lines show the value of the reconstructed optima. The grey dotted lines and grey solid lines show the respective uncertainty ranges of 50 % and 95 %. Purple solid lines and purple dotted lines separate Rupelian from Chattian, and Chattian from early Miocene associations, respectively, based on dinoflagellate cyst zonation. The uppermost/ lowermost ages of depicted boundaries between epochs, based on dinoflagellate cyst zonation, have been labelled where possible. Oligocene and ?Miocene sites are labelled (O) and (M?), respectively.
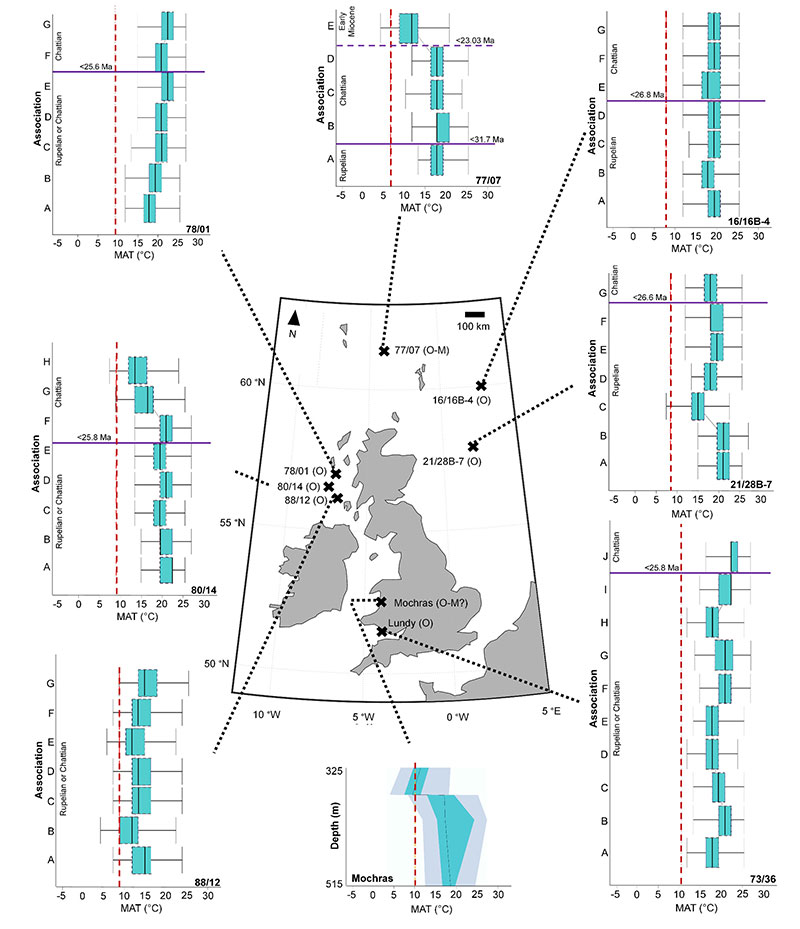
FIGURE 6. Mean Temperature of the Warmest Quarter (MTWQ) reconstructions from the sequential boreholes. The red dotted line shows the present-day MTWQ. Solid black lines show the value of the reconstructed optima. The grey dotted lines and grey solid lines show the respective uncertainty ranges of 50 % and 95 %. Oligocene and ?Miocene sites are labelled (O) and (M?), respectively. Purple solid lines and purple dotted lines separate Rupelian from Chattian, and Chattian from early Miocene associations, respectively, based on dinoflagellate cyst zonation. The uppermost/ lowermost ages of depicted boundaries between epochs, based on dinoflagellate cyst zonation, have been labelled where possible.
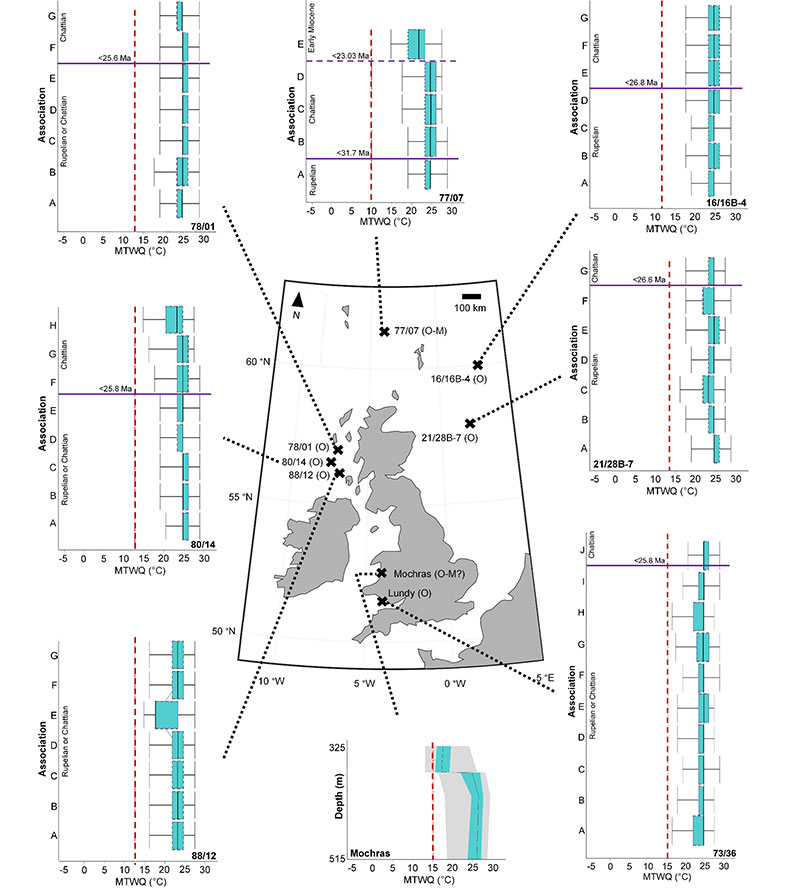
FIGURE 7. Mean Temperature of the Coldest Quarter (MTCQ) reconstructions from the sequential boreholes. The red dotted line shows the present-day MTCQ. Solid black lines show the value of the reconstructed optima. The grey dotted lines and grey solid lines show the respective uncertainty ranges of 50 % and 95 %. Oligocene and ?Miocene sites are labelled (O) and (M?), respectively. Purple solid lines and purple dotted lines separate Rupelian from Chattian, and Chattian from early Miocene associations, respectively, based on dinoflagellate cyst zonation. The uppermost/ lowermost ages of depicted boundaries between epochs, based on dinoflagellate cyst zonation, have been labelled where possible.
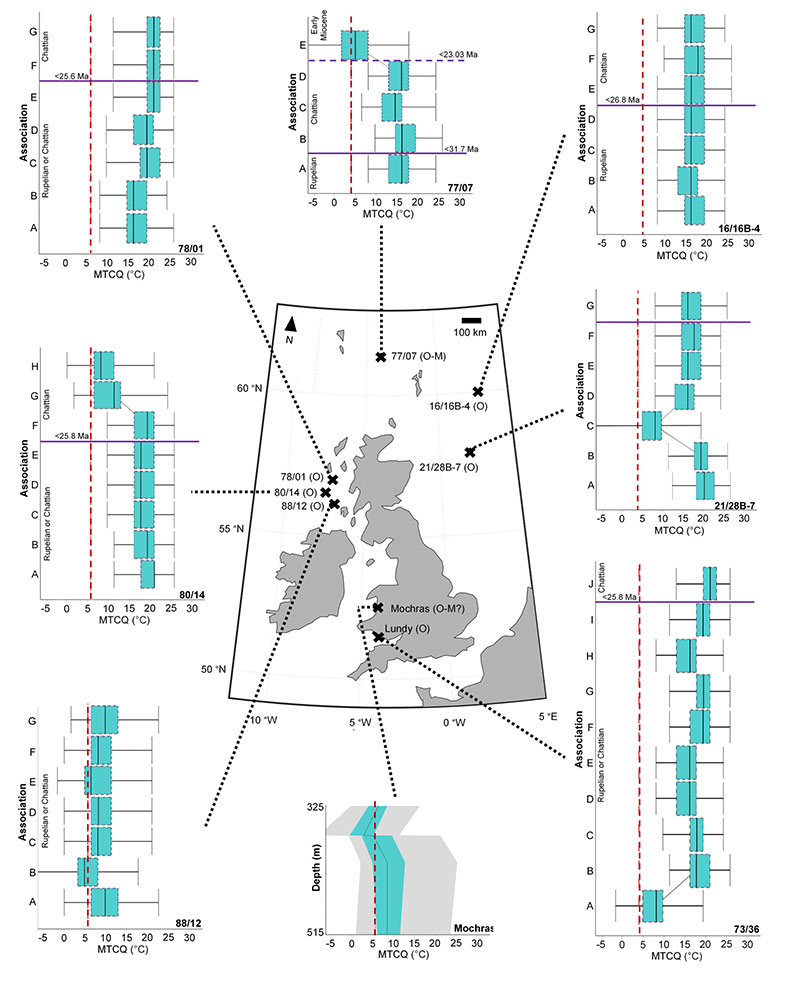
FIGURE 8. Mean Temperature of the Coldest Quarter (MTCQ) reconstructions, based on study sites where only one pollen assemblage was available. The red dotted line shows the present-day MTCQ. Solid black lines show the value of the reconstructed optima. The grey dotted lines and grey solid lines show the respective uncertainty ranges of 50 % and 95 %. Rupelian and Oligocene and ?Miocene sites are labelled (R) and (O), respectively.
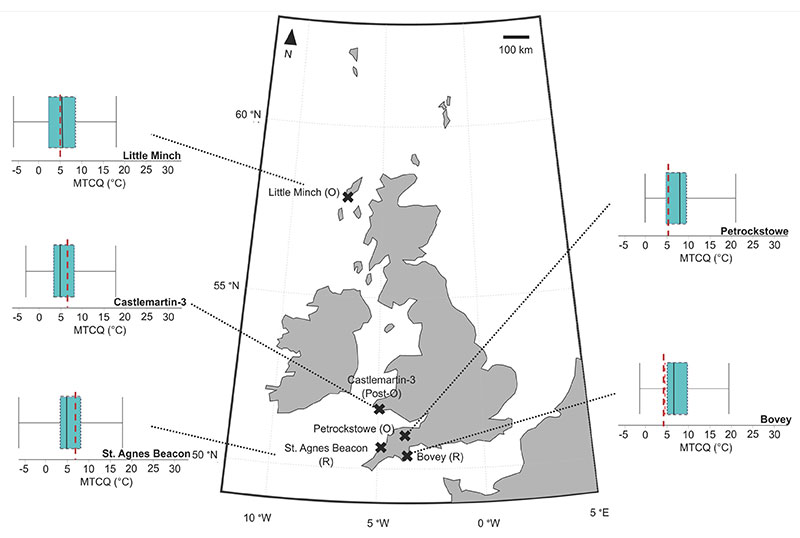
FIGURE 9. Mean Temperature of the Coldest Quarter (MTCQ) reconstructions based on pollen assemblages from Northern Ireland and the Republic of Ireland. The red dotted line shows the present-day MTCQ. Solid black lines show the value of the reconstructed optima. The grey dotted lines and grey solid lines show the respective uncertainty ranges of 50 % and 95 %. Rupelian, Chattian, and Oligocene sites are labelled (R), (C), and (O), respectively. “B” and “W-28” are abbreviated for “Bellbrook” and “Well-28”, respectively.
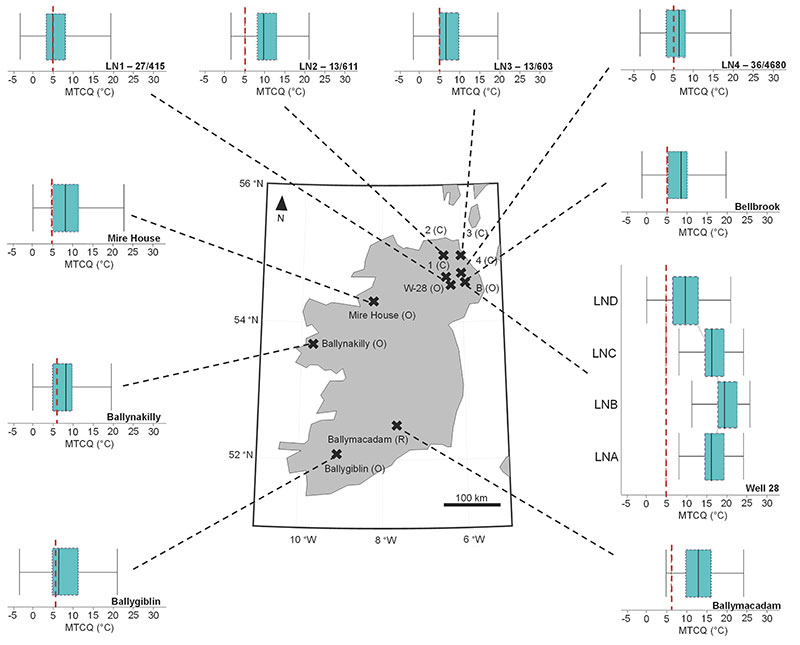
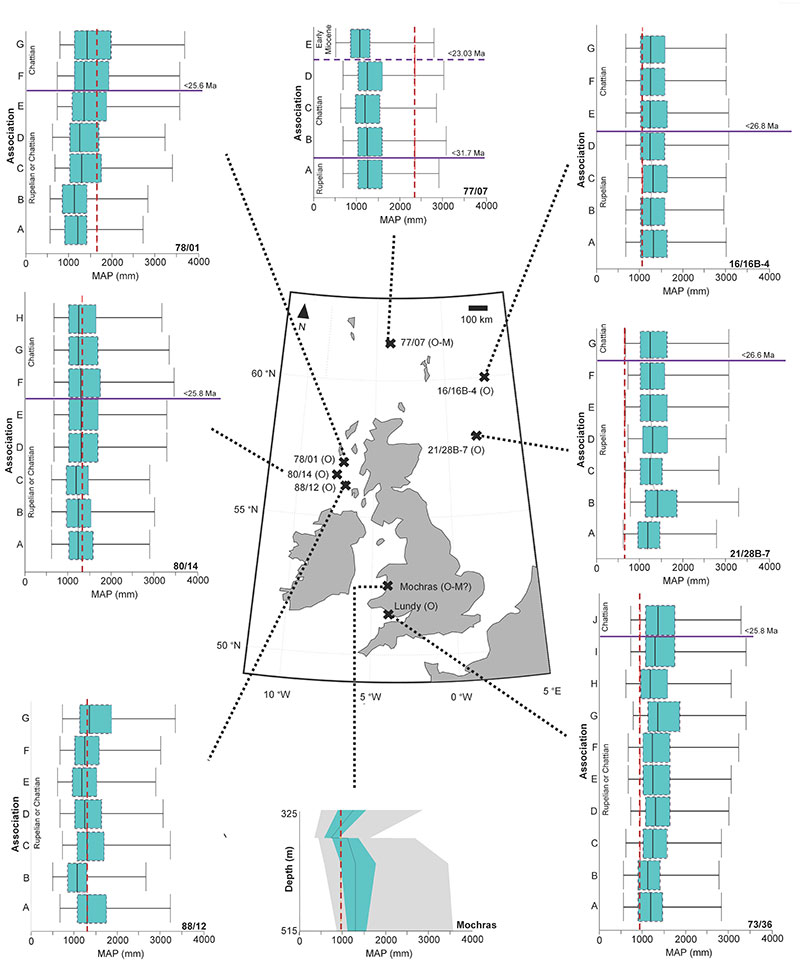
FIGURE 10. Mean Annual Precipitation (MAP) reconstructions from the sequential boreholes. The red dotted line shows the present-day MAP. Solid black lines show the value of the reconstructed optima. The grey dotted lines and grey solid lines show the respective uncertainty ranges of 50 % and 95 %. Oligocene and ?Miocene sites are labelled (O) and (M?), respectively. Purple solid lines and purple dotted lines separate Rupelian from Chattian, and Chattian from early Miocene associations, respectively, based on dinoflagellate cyst zonation. The uppermost/ lowermost ages of depicted boundaries between epochs, based on dinoflagellate cyst zonation, have been labelled where possible.
![]()
FIGURE 11. Mean Annual Precipitation (MAP) reconstructions, based on study sites where only one pollen assemblage was available. The red dotted line shows the present-day MAP. Solid black lines show the value of the reconstructed optima. The grey dotted lines and grey solid lines show the respective uncertainty ranges of 50 % and 95 %. Rupelian, Chattian, and Oligocene sites are labelled (R), (C), and (O), respectively.
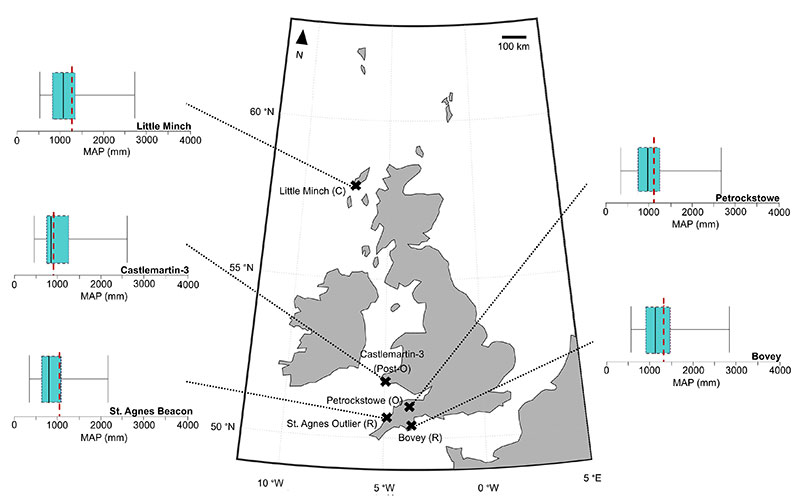
FIGURE 12. Mean Annual Precipitation (MAP) reconstructions based on pollen assemblages from Northern Ireland and the Republic of Ireland. The red dotted line shows the present-day MAP. Solid black lines show the value of the reconstructed optima. The grey dotted lines and grey solid lines show the respective uncertainty ranges of 50 % and 95 %. Rupelian, Chattian, and Oligocene sites are labelled (R), (C), and (O), respectively. “B” and “W-28” are abbreviated for “Bellbrook” and “Well-28”, respectively.
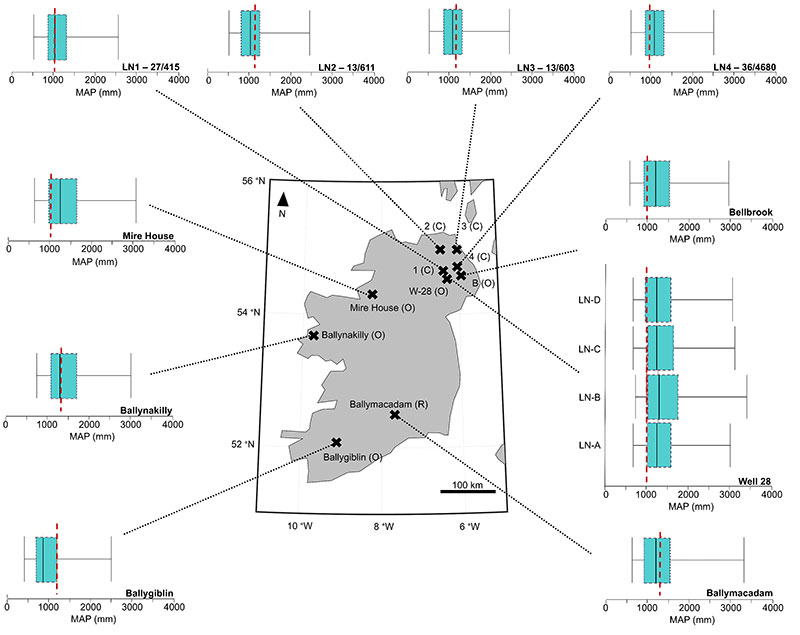
FIGURE 13. Mean Precipitation of the Driest Month (MPDry) reconstructions from the sequential boreholes. The red dotted line shows the present-day MPDry. Solid black lines show the value of the reconstructed optima. The grey dotted lines and grey solid lines show the respective uncertainty ranges of 50 % and 95 %. Oligocene and ?Miocene sites are labelled (O) and (M?), respectively. Purple solid lines and purple dotted lines separate Rupelian from Chattian, and Chattian from early Miocene associations, respectively, based on dinoflagellate cyst zonation. The uppermost/ lowermost ages of depicted boundaries between epochs, based on dinoflagellate cyst zonation, have been labelled where possible.
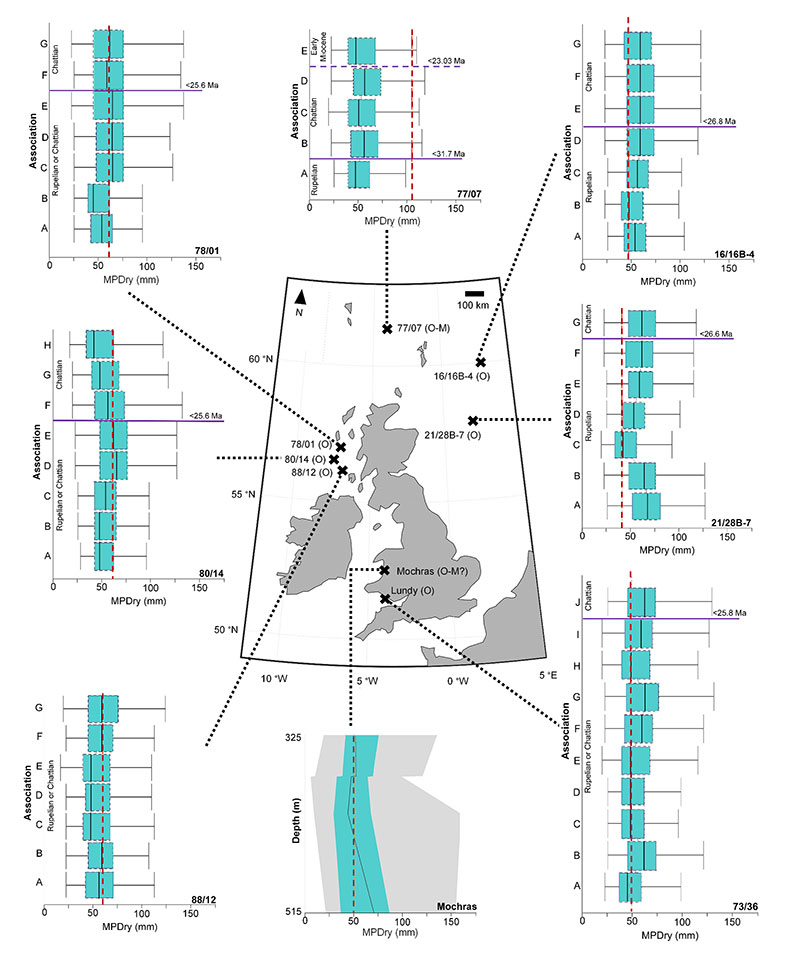
FIGURE 14. Mean Precipitation of the Driest Month (MPDry) reconstructions, based on study sites where only one pollen assemblage was available. The red dotted line shows the present-day MPDry. Solid black lines show the value of the reconstructed optima. The grey dotted lines and grey solid lines show the respective uncertainty ranges of 50 % and 95 %. Rupelian, Chattian and Oligocene sites are labelled (R), (C), and (O), respectively. Purple solid lines and purple dotted lines separate Rupelian from Chattian, and Chattian from early Miocene associations, respectively, based on dinoflagellate cyst zonation. The uppermost/ lowermost ages of depicted boundaries between epochs, based on dinoflagellate cyst zonation, have been labelled where possible.
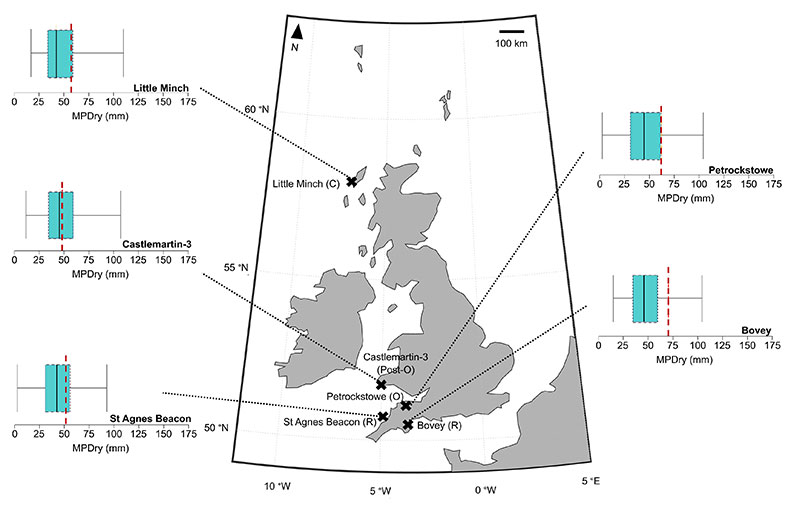
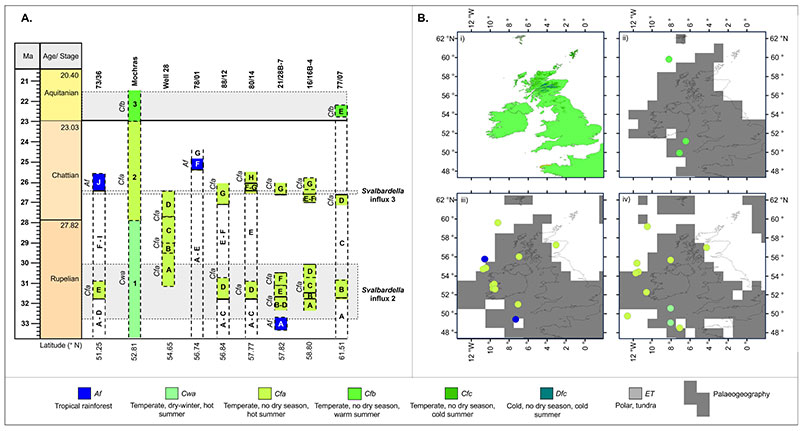
FIGURE 15. Stratigraphic age range and presence of tropical taxa-types in the pollen record, from the Oligocene–Miocene of the British Isles in correspondence with the possible age ranges of significant climate events. The Miocene Climatic Optimum (MCO), Oligocene–Miocene Transition (OMT), and Late Oligocene Warming Event (LOWE) are labelled.
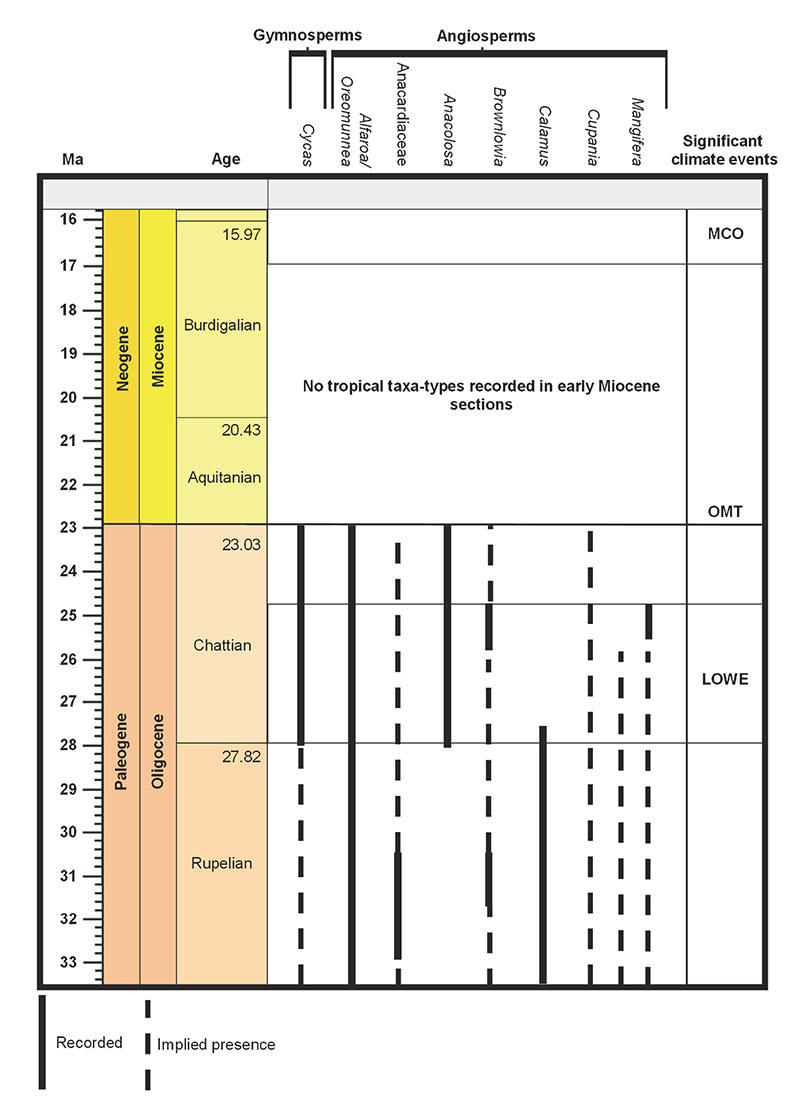
FIGURE 16. A. Köppen-Geiger signatures assigned to reconstructions of associations from Wilson (1996), and their likely age. The Mochras Basal Red Unit, the Transitional Unit and Lignite and Clay Units are labelled as 1-3, respectively. Age range of cooling Svalbardella -events 2 and 3, and their temporal overlaps with associations are labelled. Associations from Wilson (1996) are labelled alphabetically in accordance with original association assignment. Solid black lines in columns show a definitive age, based on dinoflagellate cyst stratigraphic age ranges. Dotted black lines in columns demonstrate an uncertain age range, based on dinoflagellate cysts stratigraphy. Dotted grey lines indicate possibility of age range regarding cooling events, i.e., Svalbardella -2, 3 and the early Miocene cooling. Latitude of boreholes are listed. B. Köppen-Geiger-based climate-type distributions across the British Isles, with key describing assigned climate types. Grey pixels show palaeolocations of British Isles (Scotese and Wright, 2018). Four stages are shown: i) Present-day Köppen-Geiger distribution of the British Isles (Beck et al., 2018); ii) Early Miocene; iii) Chattian; and iv) Rupelian.