FIGURE 1. Locality maps and stratigraphic column from JODA. A. The state of Oregon shaded in black in relation to the continental United States. B. The three sections of JODA in relation to major cities within Oregon. C. Simplified stratigraphic column of JODA, including the Clarno and John Day formations.
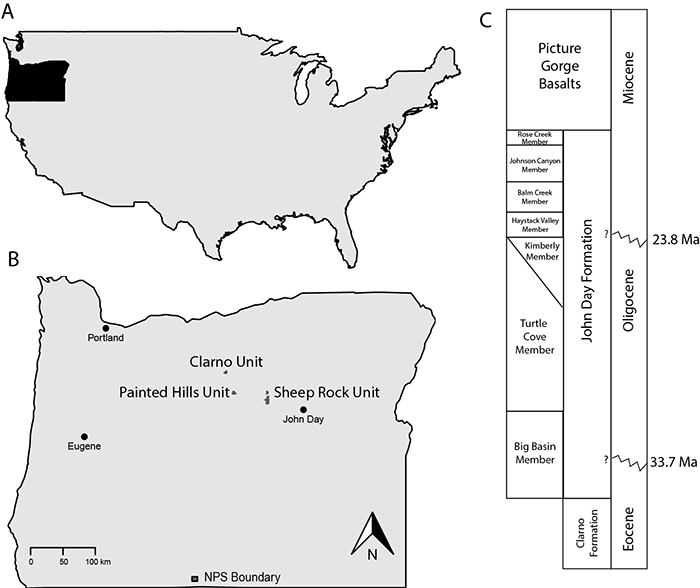
FIGURE 2. DEM models of avian tracks from JODA 1536. A. Tracks and associated features without highlighting. B. A1 and A2 highlighted in black, beak impressions highlighted in red, and Cochlichnus highlighted in yellow. Digits indicated by D2-D4. Black scale bar measures approximately 20 mm.
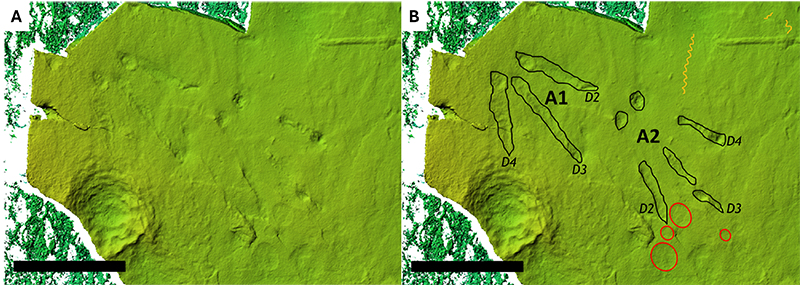
FIGURE 3. DEM models of reptile tracks from JODA 1535. A. Tracks and associated features without highlighting. B. L1, L2, and L3 highlighted in black. Digits indicated by D1-D5. Black scale bar measures approximately 20 mm.
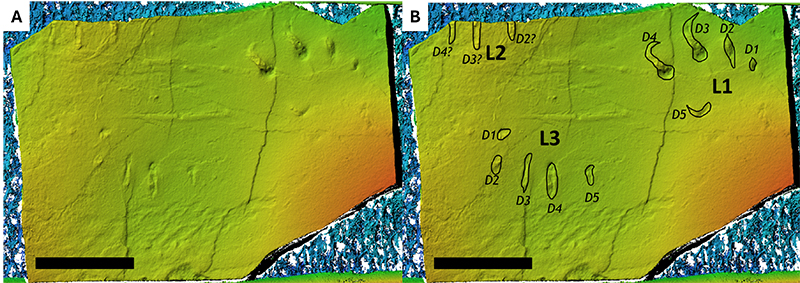
FIGURE 4. DEM models of feliform tracks on JODA 283. A. Tracks and associated features without highlighting. B. F1, F2, F3, and F4 highlighted in black. Digits indicated by D2-D5. Black scale bar measures approximately 30 mm.
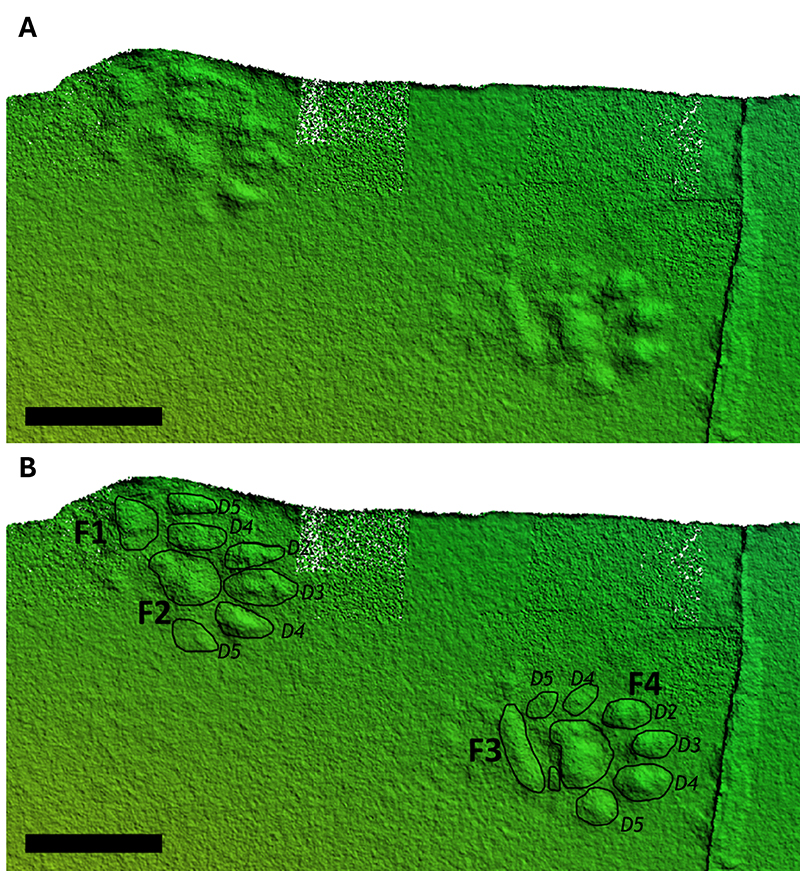
FIGURE 5. DEM models of feliform tracks on JODA 251. A. Tracks and associated features without highlighting. B. F5 and F6 highlighted in black. Digits indicated by D2-D5. Black scale bar measures approximately 7 mm.
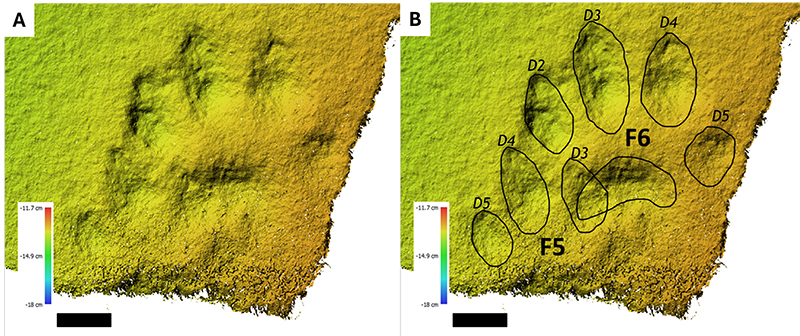
FIGURE 6. DEM models of the odd toed ungulate track on JODA 251. A. P1 without highlighting. B shows P1 highlighted in black. Digits indicated by D2-D4. Black scale bar measures approximately 50 mm.
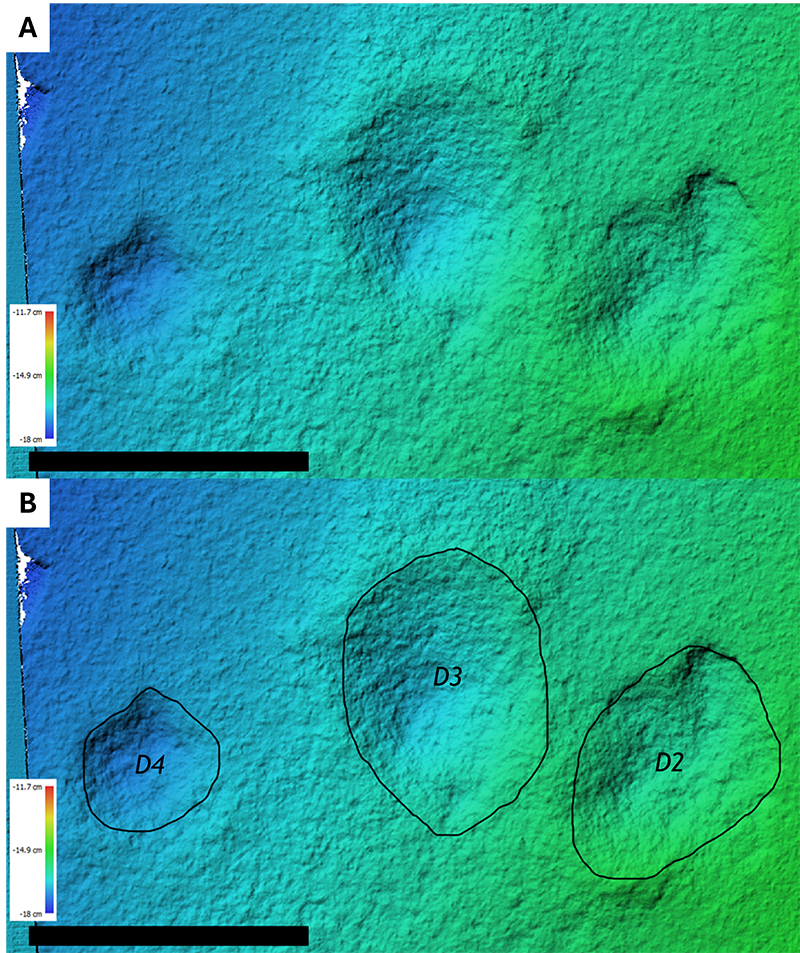
FIGURE 7. Graph comparing interdigital angles of known avian ichnotaxa against JODA 1536.
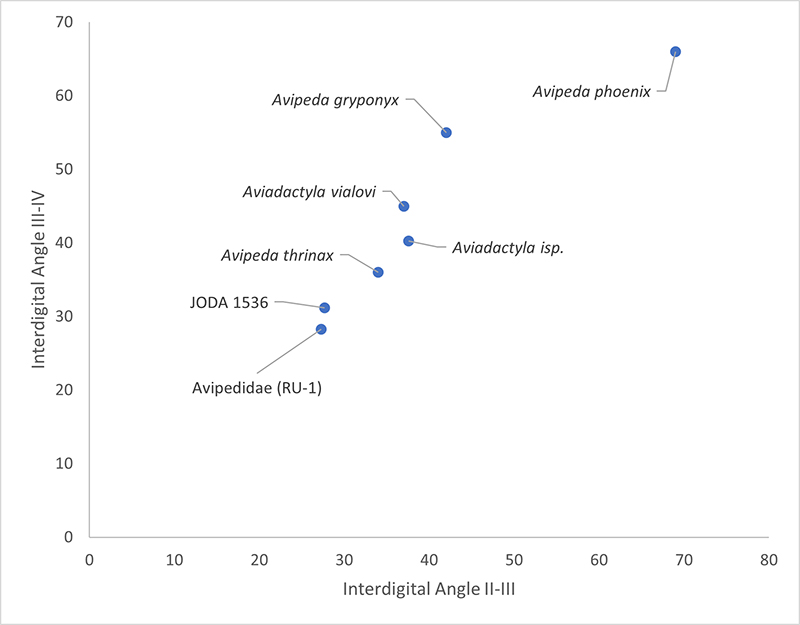
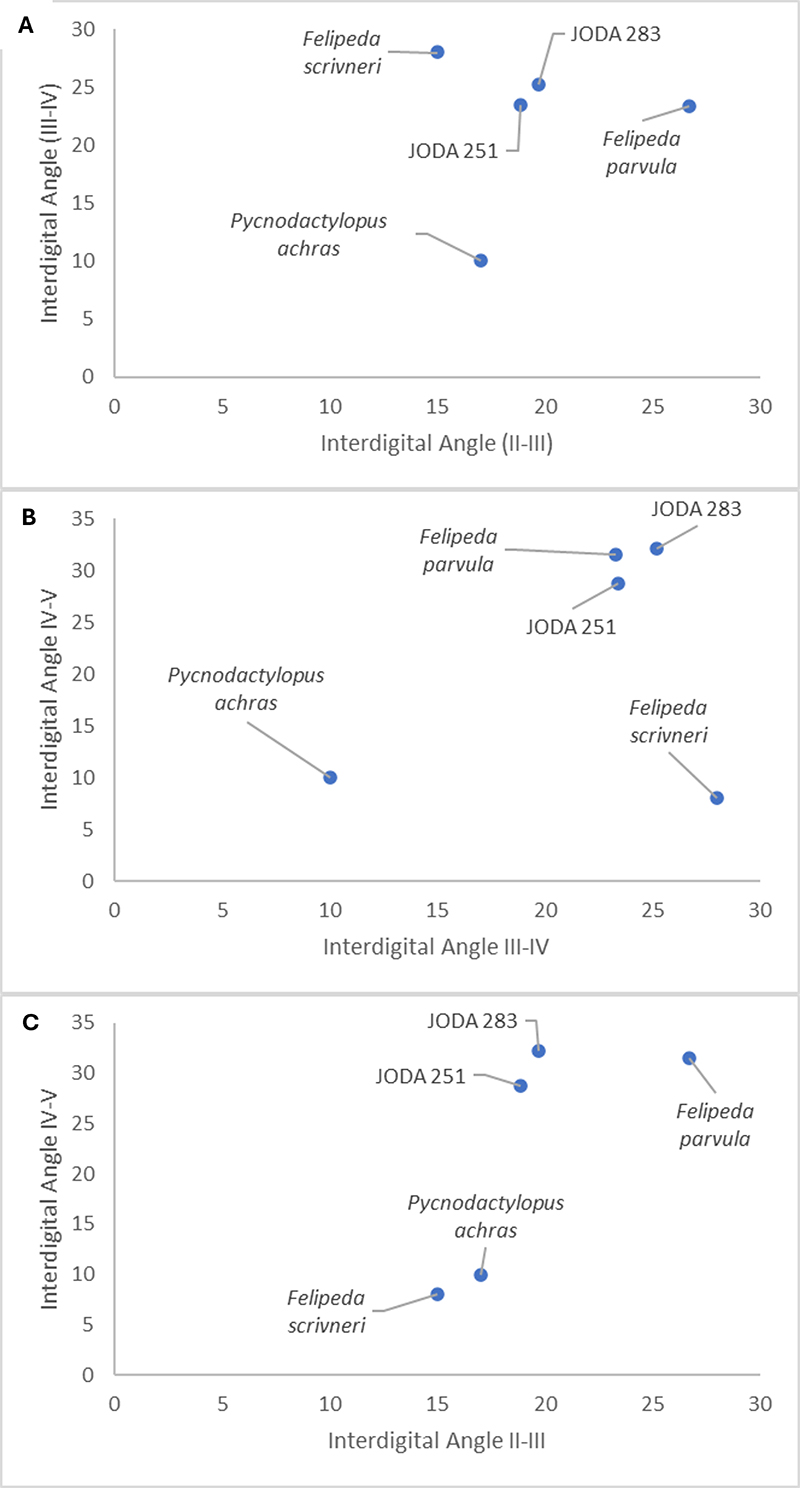
FIGURE 8. Graphs showing the interdigital angles of known feliform ichnotaxa compared against JODA 283 and 251.