FIGURE 1. Comparison of the number of Tyrannosaurus rex fossils collected by commercial outfits with those collected by public trusts (as of October 2024).
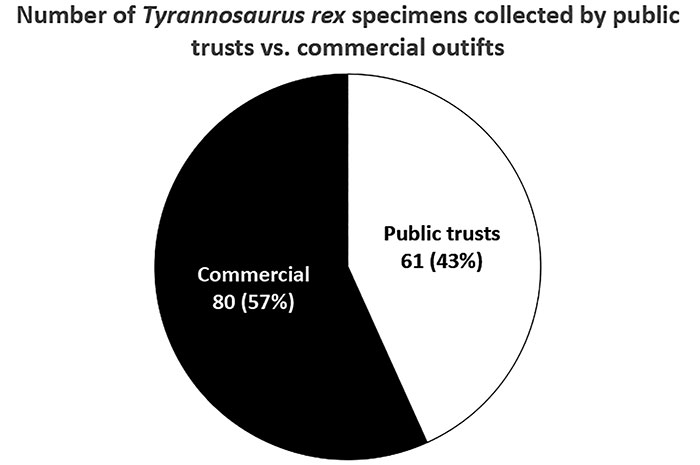
FIGURE 2. The number of commercially obtained Tyrannosaurus rex fossils that have been purchased by public trusts (as of October 2024).
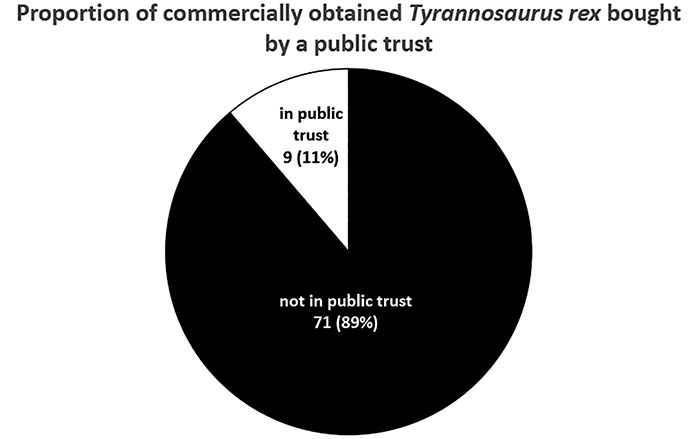
FIGURE 3. Chronological comparison of the number of Tyrannosaurus rex fossils collected by public trusts (white dots) and commercial outfits (black dots) (as of October 2024).
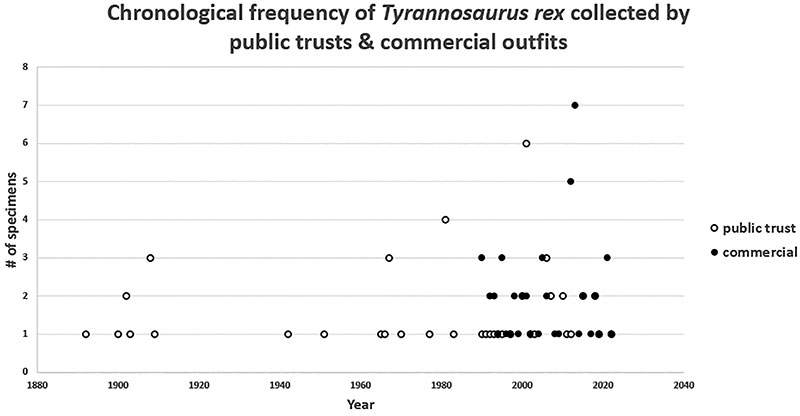
FIGURE 4. Regional commercial exploitation of Tyrannosaurus rex fossils by state (as of October 2024).
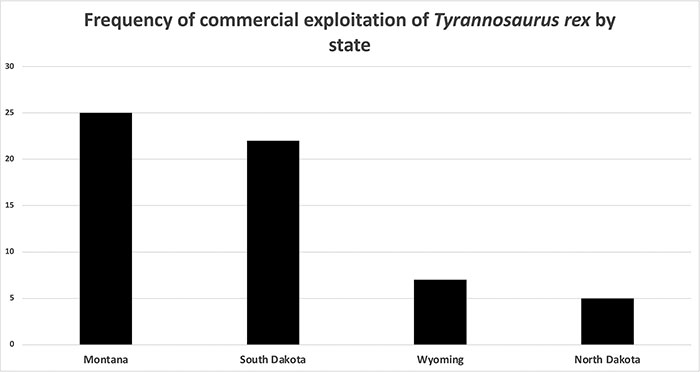
FIGURE 5. The cost (USD) of Tyrannosaurus rex fossils (as of October 2024). Asterisk (*) indicates specimens that are in a public trust. Original prices were adjusted to 2024 prices using usinflationcalculator.com.
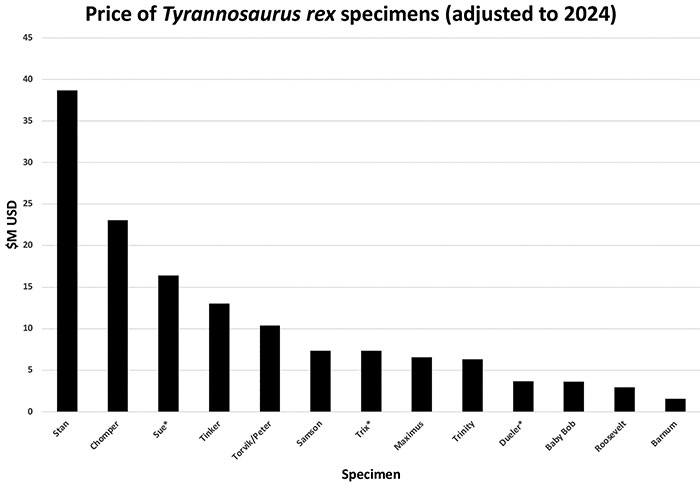
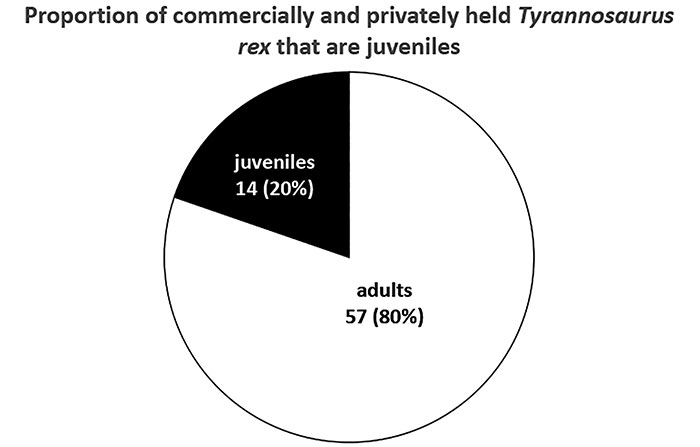
FIGURE 6. The number of juvenile Tyrannosaurus rex specimens currently held in commercial or private hands (as of October 2024).